| Param | Original file | Final file |
|---|---|---|
| Filename | modeM0/AS1P01_998T02_9000000190_01007cztM0_level2.evt | modeM0/AS1P01_998T02_9000000190_01007cztM0_level2_quad_clean.evt |
| Size (bytes) | 2,003,307,840 | 213,289,920 |
| Size | 1.9 GB | 203.4 MB |
| Events in quadrant A | 15,039,216 | 1,404,762 |
| Events in quadrant B | 15,986,377 | 1,422,339 |
| Events in quadrant C | 15,163,431 | 1,384,263 |
| Events in quadrant D | 13,634,145 | 1,363,516 |
| Mode M0 | |||
|---|---|---|---|
| Quadrant | BADHDUFLAG | Total packets | Discarded packets |
| A | 0 | 53759 | 3 |
| B | 0 | 56540 | 3 |
| C | 0 | 54110 | 3 |
| D | 0 | 49662 | 3 |
| Mode SS | |||
|---|---|---|---|
| Quadrant | BADHDUFLAG | Total packets | Discarded packets |
| A | 0 | 264 | 0 |
| B | 0 | 264 | 0 |
| C | 0 | 264 | 0 |
| D | 0 | 264 | 0 |
| Mode M9 | |||
|---|---|---|---|
| Quadrant | BADHDUFLAG | Total packets | Discarded packets |
| A | 0 | 17 | 0 |
| B | 0 | 17 | 0 |
| C | 0 | 17 | 0 |
| D | 0 | 17 | 0 |
| Quadrant | Total seconds | Saturated seconds | Saturation percentage |
|---|---|---|---|
| A | 12811 | 21 | 0.163922% |
| B | 12811 | 50 | 0.390290% |
| C | 12811 | 13 | 0.101475% |
| D | 12812 | 19 | 0.148298% |
Noise dominated data is calculated using 1-second bins in cleaned event files. If a bin has >2000 counts, and if more than 50% of those come from <1% of pixels, then it is considered to be noise-dominated and hence unusable.
| Quadrant | # 1 sec bins | Bins with >0 counts | Bins with >2000 counts | High rate bins dominated by noise | Noise dominated (total time) | Noise dominated (detector-on time) | Marked lightcurve |
|---|---|---|---|---|---|---|---|
| A | 14586 | 12814 | 342 | 342 | 2.34% | 2.67% | 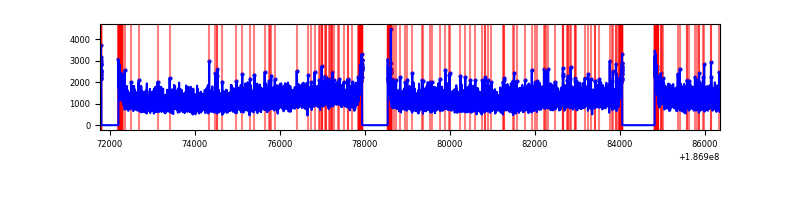 |
| B | 14586 | 12814 | 477 | 477 | 3.27% | 3.72% | 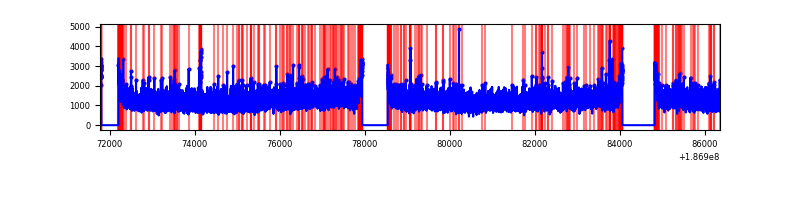 |
| C | 14586 | 12814 | 350 | 350 | 2.40% | 2.73% | 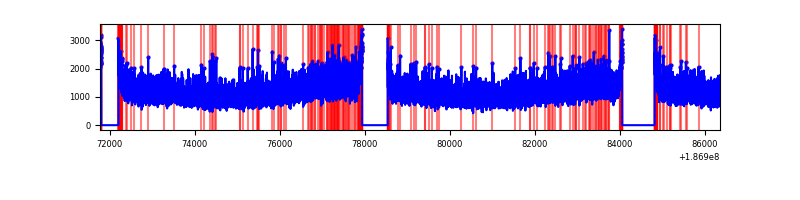 |
| D | 14587 | 12815 | 232 | 232 | 1.59% | 1.81% | 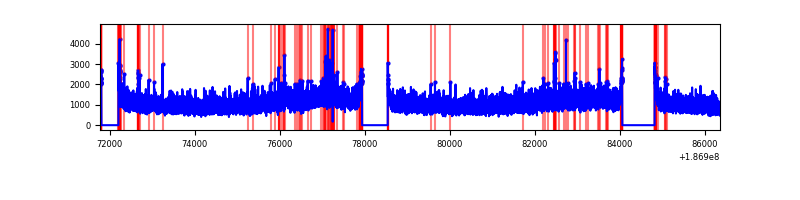 |
Top three noisy pixels from each quadrant. If the there are fewer than three noisy pixels in the level2.evt file, extra rows are filled as -1
| Pixel properties | Quadrant properties | ||||||
|---|---|---|---|---|---|---|---|
| Quadrant | DetID | PixID | Counts | Sigma | Mean | Median | Sigma |
| A | 13 | 164 | 39432 | 37.88 | 3901 | 3927 | 937.4 |
| A | 15 | 233 | 26289 | 23.85 | 3901 | 3927 | 937.4 |
| A | 12 | 189 | 16674 | 13.6 | 3901 | 3927 | 937.4 |
| B | 15 | 22 | 115450 | 115.11 | 4092 | 4110 | 967.2 |
| B | 7 | 221 | 108621 | 108.05 | 4092 | 4110 | 967.2 |
| B | 5 | 249 | 60876 | 58.69 | 4092 | 4110 | 967.2 |
| C | 15 | 241 | 639978 | 619.82 | 3684 | 3809 | 1026.4 |
| C | 3 | 111 | 53231 | 48.15 | 3684 | 3809 | 1026.4 |
| C | 3 | 79 | 46924 | 42.01 | 3684 | 3809 | 1026.4 |
| D | 1 | 4 | 232697 | 208.32 | 3538 | 3656 | 1099.5 |
| D | 2 | 107 | 51816 | 43.8 | 3538 | 3656 | 1099.5 |
| D | 13 | 13 | 42199 | 35.06 | 3538 | 3656 | 1099.5 |
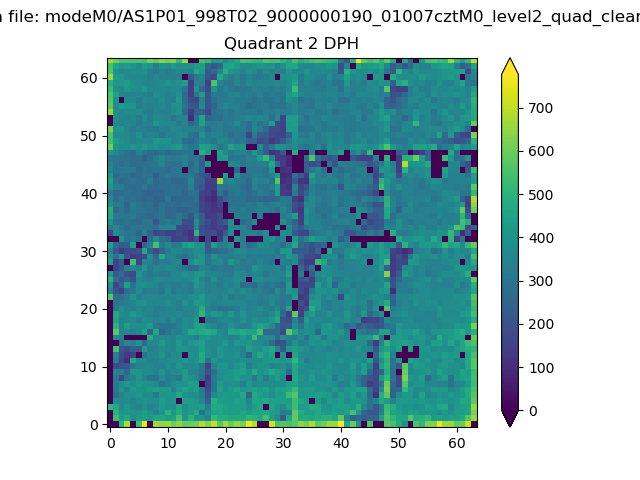
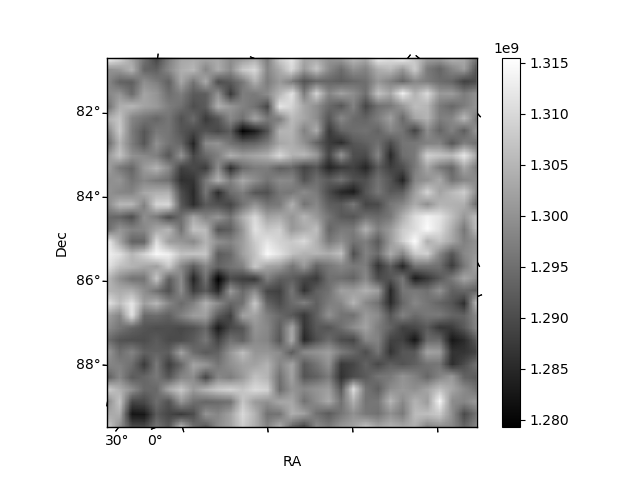
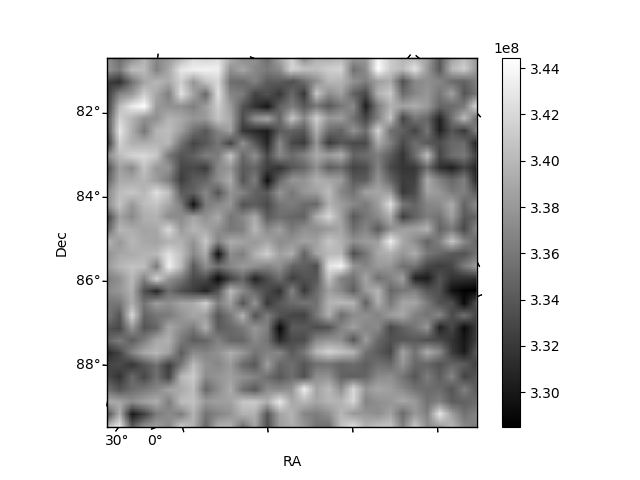
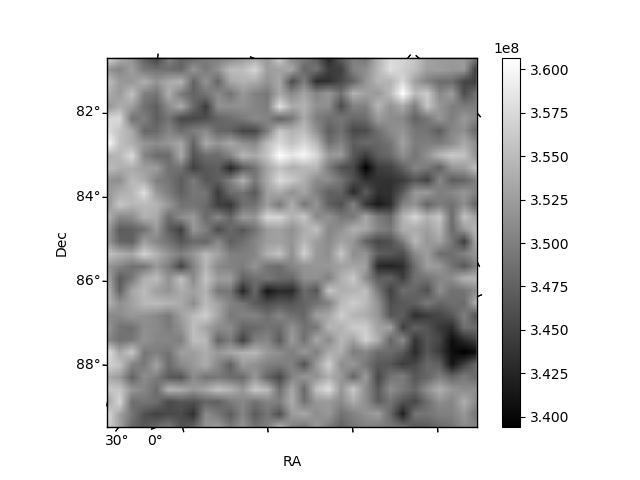
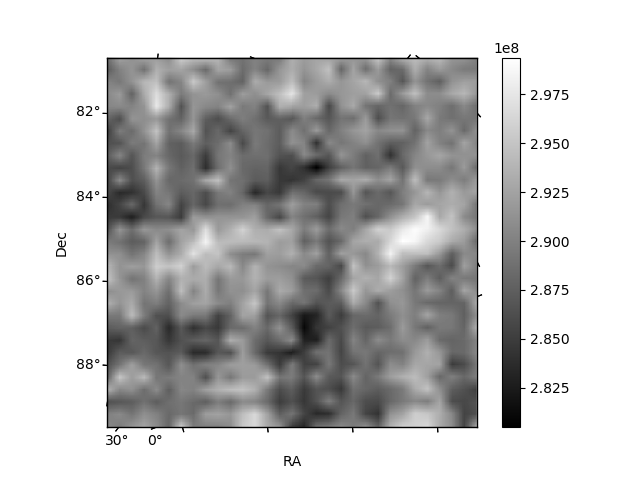
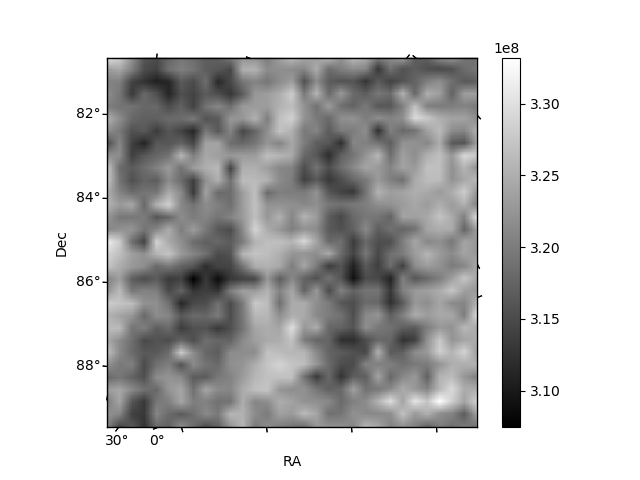
Histogram calculated using DETX and DETY for each event in the final _common_clean file
| Quadrant A | 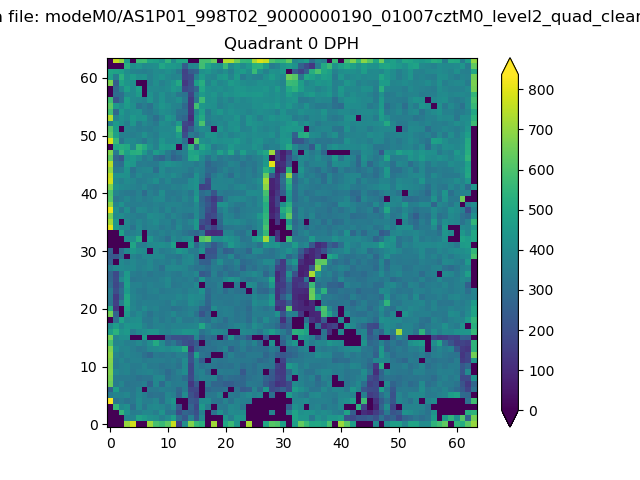 |
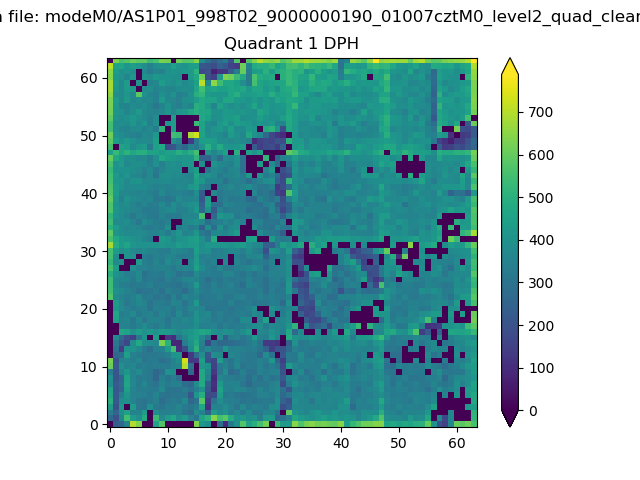 |
Quadrant B |
|---|---|---|---|
| Quadrant D | 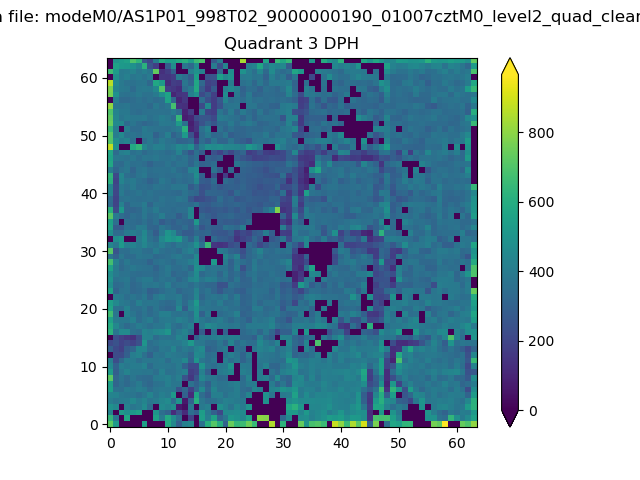 |
 |
Quadrant C |
| Plot type | Count rate plots | Images |
|---|---|---|
| Comparison with Poisson distribution Blue bars denote a histogram of data divided into 1 sec bins. Red curve is a Poisson curve with rate = median count rate of data. |
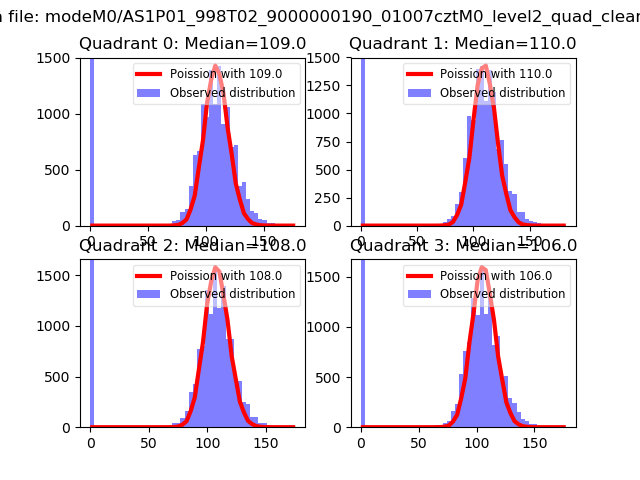 |
 |
| Quadrant-wise count rates Data is divided into 100 sec bins |
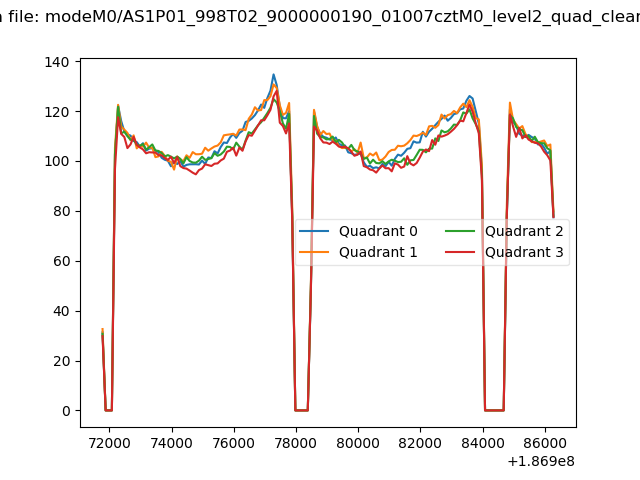 |
|
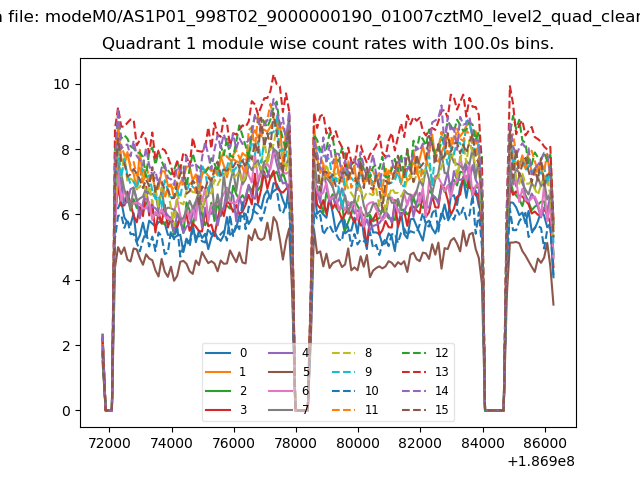
| Module-wise count rates for Quadrant A Data is divided into 100 sec bins |
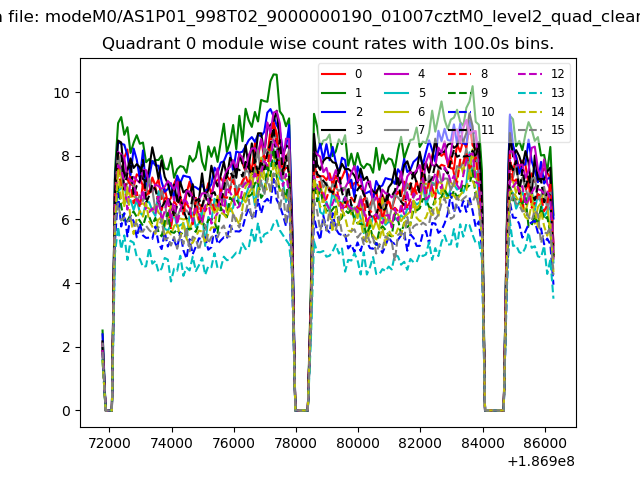 |
 |
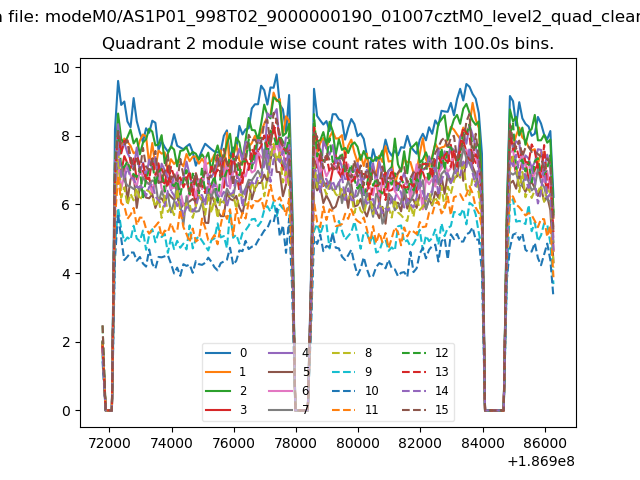
| Module-wise count rates for Quadrant B Data is divided into 100 sec bins |
 |
 |
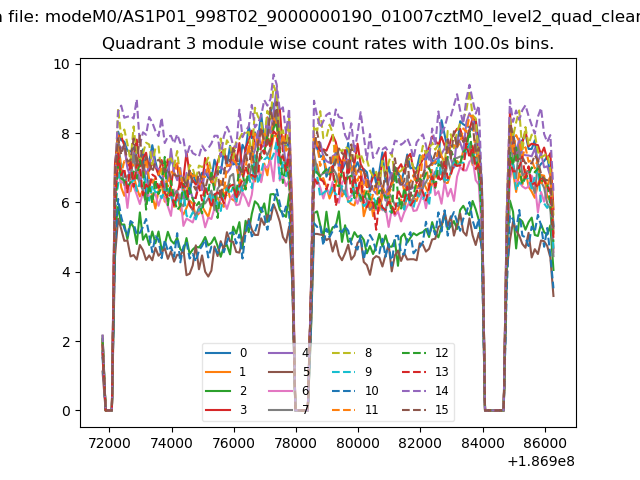
| Module-wise count rates for Quadrant C Data is divided into 100 sec bins |
 |
 |
| Module-wise count rates for Quadrant D Data is divided into 100 sec bins |
 |
 |
| Parameter | Plot |
|---|---|
| CZT HV Monitor | 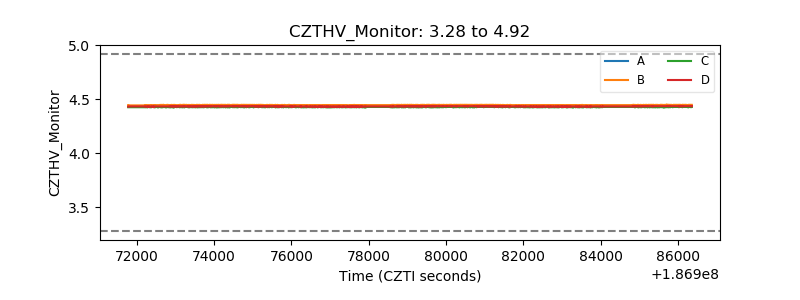 |
| D_VDD | 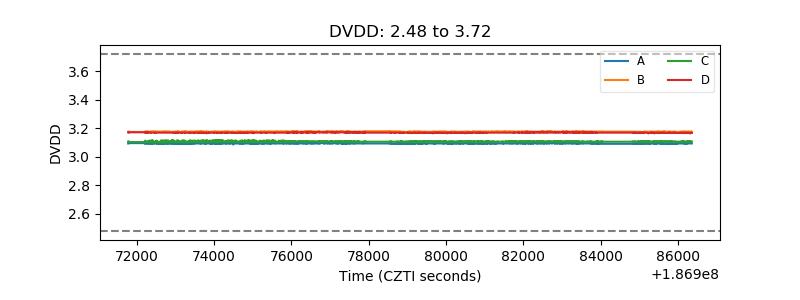 |
| Temperature 1 | 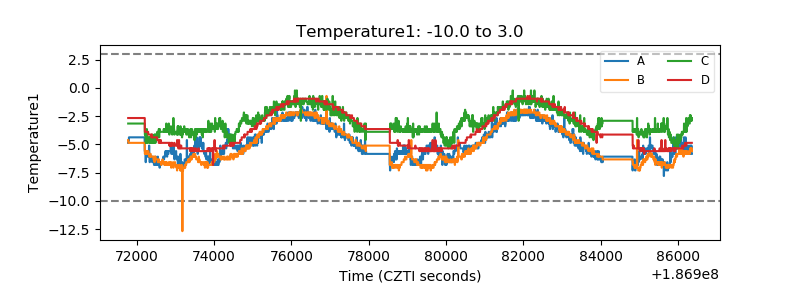 |
| Veto HV Monitor | 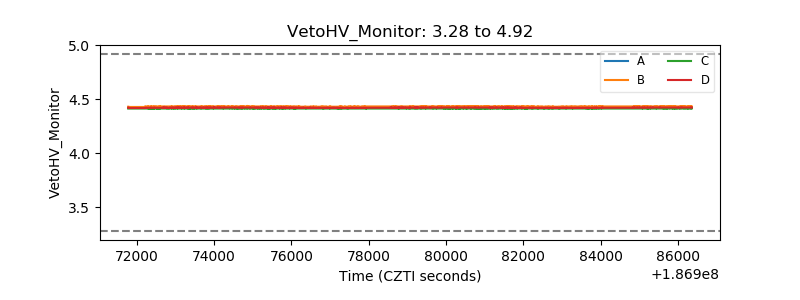 |
| Veto LLD | 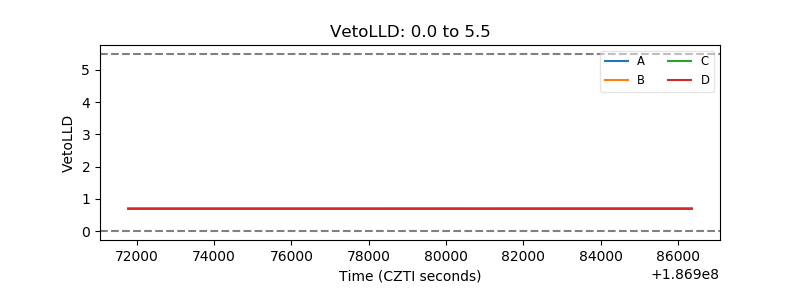 |
| Alpha Counter | 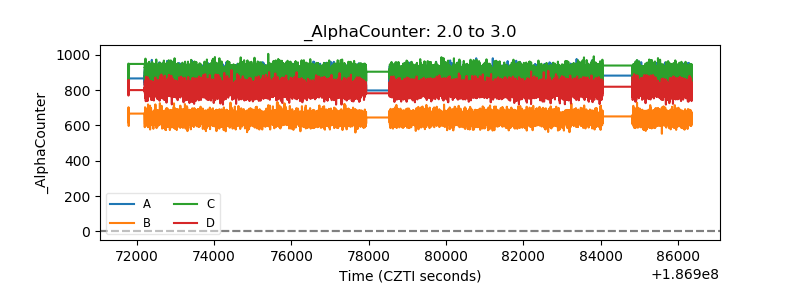 |
| _CPM_Rate | 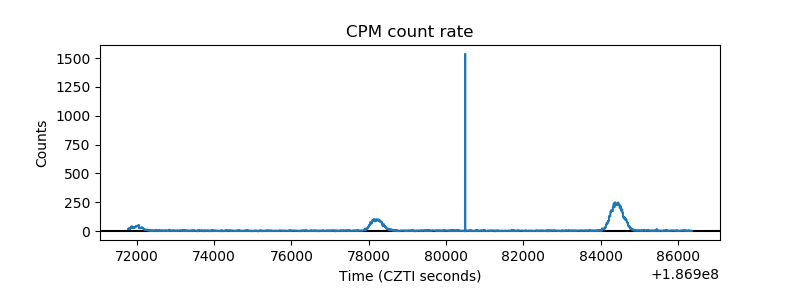 |
| CZT Counter | 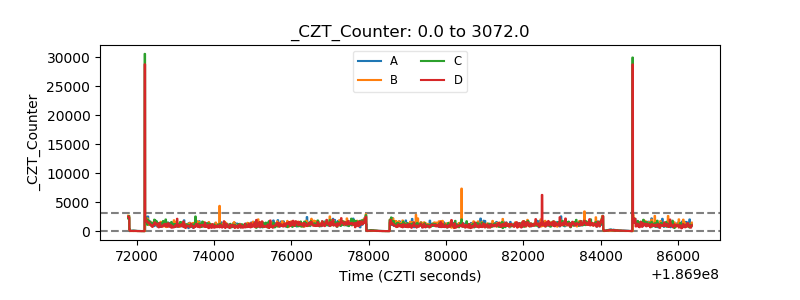 |
| +2.5 Volts monitor |  |
| +5 Volts monitor |  |
| _ROLL_ROT | 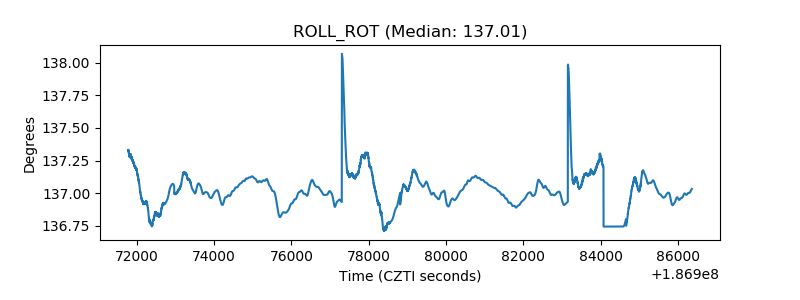 |
| _Roll_DEC | 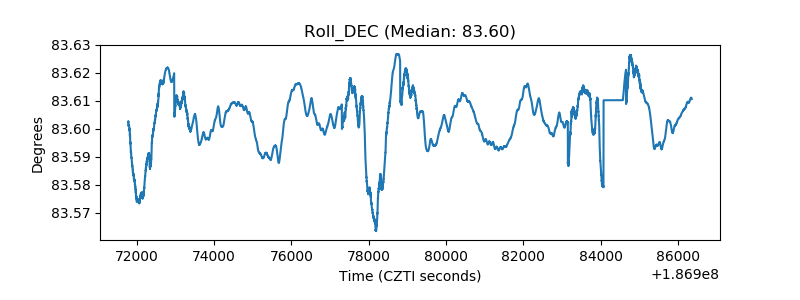 |
| _Roll_RA | 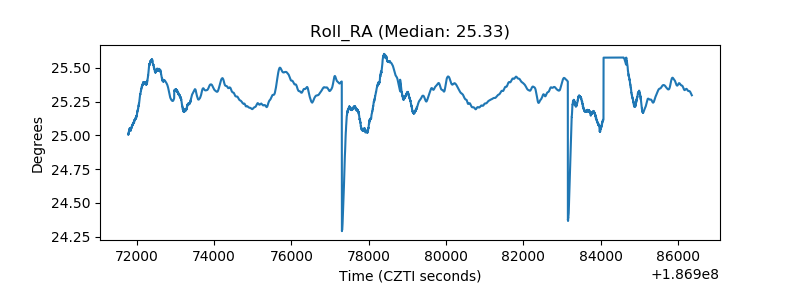 |
| Veto Counter | 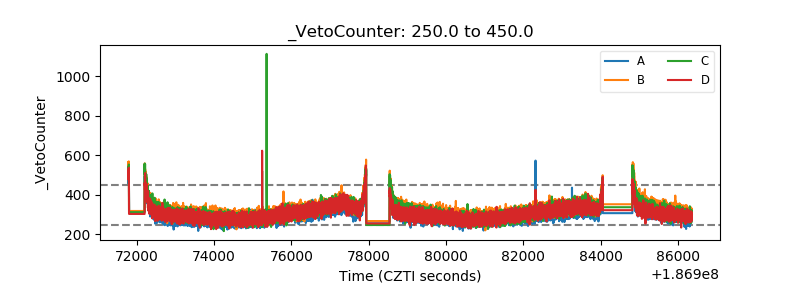 |