| Param | Original file | Final file |
|---|---|---|
| Filename | modeM0/AS1P01_998T02_9000000190_01008cztM0_level2.evt | modeM0/AS1P01_998T02_9000000190_01008cztM0_level2_quad_clean.evt |
| Size (bytes) | 946,365,120 | 103,239,360 |
| Size | 902.5 MB | 98.5 MB |
| Events in quadrant A | 7,145,864 | 680,911 |
| Events in quadrant B | 7,536,468 | 689,352 |
| Events in quadrant C | 7,092,544 | 668,329 |
| Events in quadrant D | 6,476,191 | 657,857 |
| Mode M0 | |||
|---|---|---|---|
| Quadrant | BADHDUFLAG | Total packets | Discarded packets |
| A | 0 | 25635 | 1 |
| B | 0 | 26775 | 5 |
| C | 0 | 25474 | 1 |
| D | 0 | 23651 | 1 |
| Mode SS | |||
|---|---|---|---|
| Quadrant | BADHDUFLAG | Total packets | Discarded packets |
| A | 0 | 126 | 0 |
| B | 0 | 126 | 0 |
| C | 0 | 126 | 0 |
| D | 0 | 126 | 0 |
| Mode M9 | |||
|---|---|---|---|
| Quadrant | BADHDUFLAG | Total packets | Discarded packets |
| A | 0 | 9 | 0 |
| B | 0 | 9 | 0 |
| C | 0 | 9 | 0 |
| D | 0 | 9 | 0 |
| Quadrant | Total seconds | Saturated seconds | Saturation percentage |
|---|---|---|---|
| A | 6163 | 11 | 0.178485% |
| B | 6162 | 17 | 0.275884% |
| C | 6162 | 3 | 0.048685% |
| D | 6162 | 5 | 0.081142% |
Noise dominated data is calculated using 1-second bins in cleaned event files. If a bin has >2000 counts, and if more than 50% of those come from <1% of pixels, then it is considered to be noise-dominated and hence unusable.
| Quadrant | # 1 sec bins | Bins with >0 counts | Bins with >2000 counts | High rate bins dominated by noise | Noise dominated (total time) | Noise dominated (detector-on time) | Marked lightcurve |
|---|---|---|---|---|---|---|---|
| A | 7113 | 6164 | 120 | 120 | 1.69% | 1.95% | 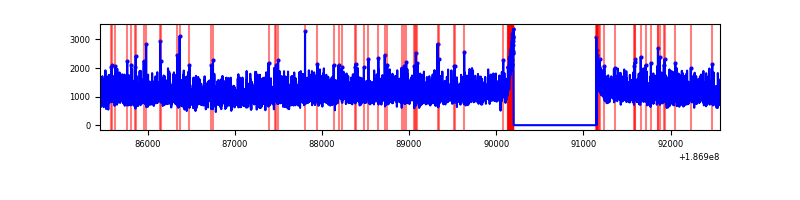 |
| B | 7112 | 6162 | 180 | 180 | 2.53% | 2.92% | 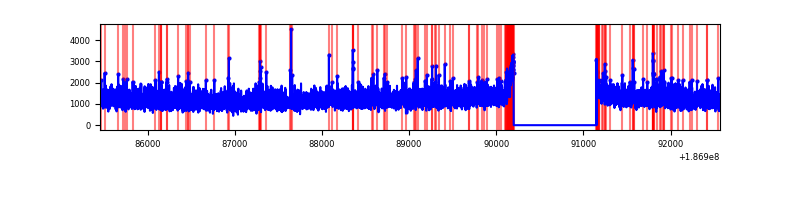 |
| C | 7112 | 6163 | 97 | 97 | 1.36% | 1.57% | 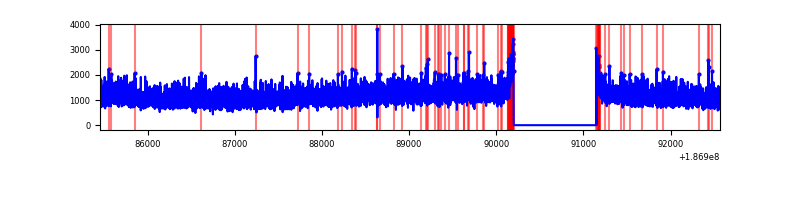 |
| D | 7112 | 6163 | 74 | 74 | 1.04% | 1.20% | 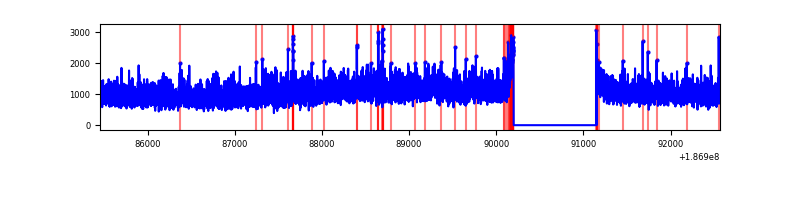 |
Top three noisy pixels from each quadrant. If the there are fewer than three noisy pixels in the level2.evt file, extra rows are filled as -1
| Pixel properties | Quadrant properties | ||||||
|---|---|---|---|---|---|---|---|
| Quadrant | DetID | PixID | Counts | Sigma | Mean | Median | Sigma |
| A | 12 | 189 | 9878 | 17.91 | 1859 | 1870 | 447.1 |
| A | 11 | 79 | 8022 | 13.76 | 1859 | 1870 | 447.1 |
| A | 3 | 111 | 5781 | 8.75 | 1859 | 1870 | 447.1 |
| B | 8 | 234 | 34247 | 70.42 | 1933 | 1948 | 458.7 |
| B | 5 | 249 | 23228 | 46.4 | 1933 | 1948 | 458.7 |
| B | 5 | 191 | 22035 | 43.79 | 1933 | 1948 | 458.7 |
| C | 15 | 241 | 308871 | 636.64 | 1725 | 1779 | 482.4 |
| C | 3 | 111 | 24889 | 47.91 | 1725 | 1779 | 482.4 |
| C | 3 | 79 | 22600 | 43.16 | 1725 | 1779 | 482.4 |
| D | 1 | 4 | 126230 | 238.54 | 1685 | 1743 | 521.9 |
| D | 1 | 83 | 32081 | 58.13 | 1685 | 1743 | 521.9 |
| D | 13 | 73 | 15620 | 26.59 | 1685 | 1743 | 521.9 |
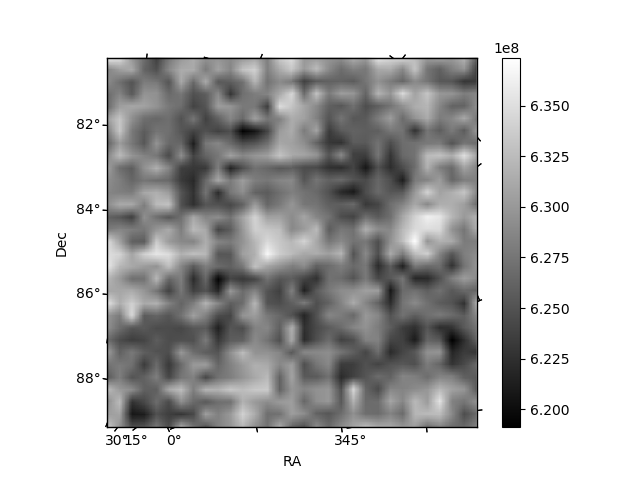
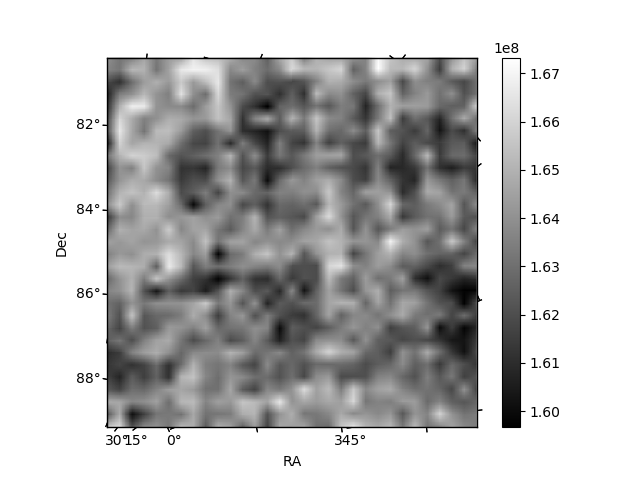
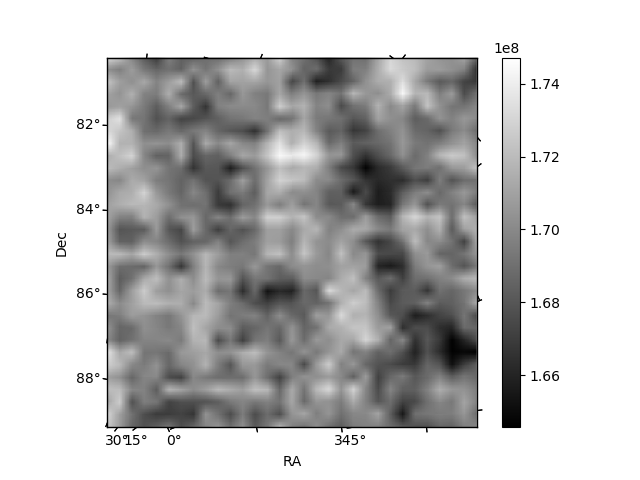
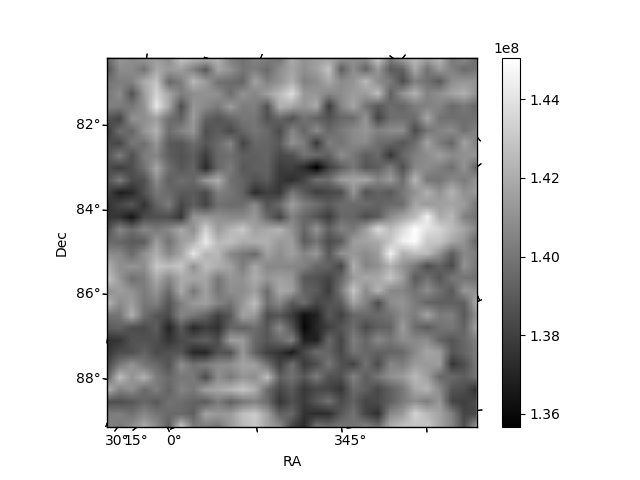
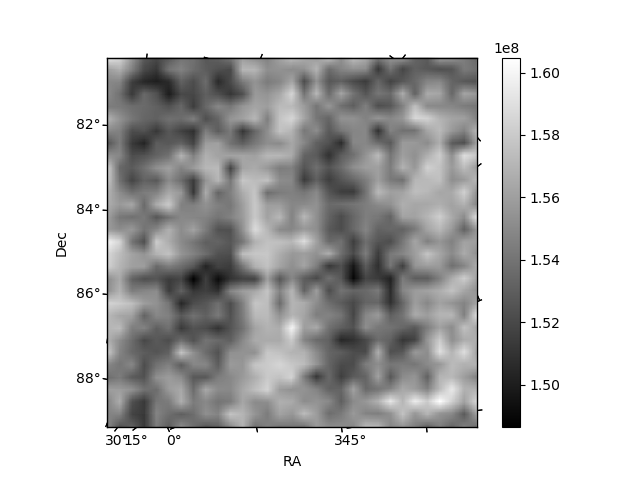
Histogram calculated using DETX and DETY for each event in the final _common_clean file
| Quadrant A | 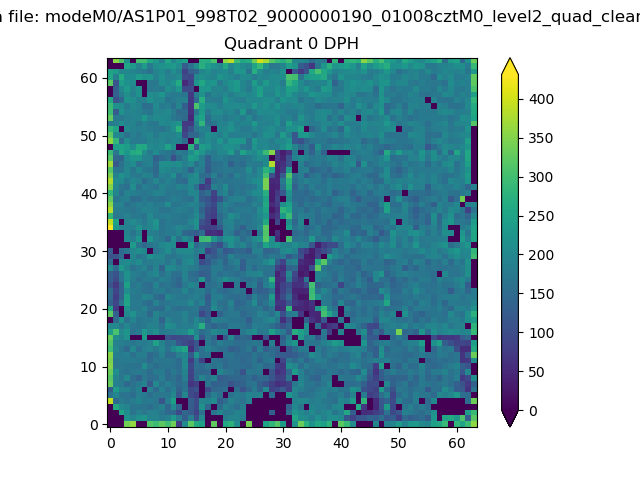 |
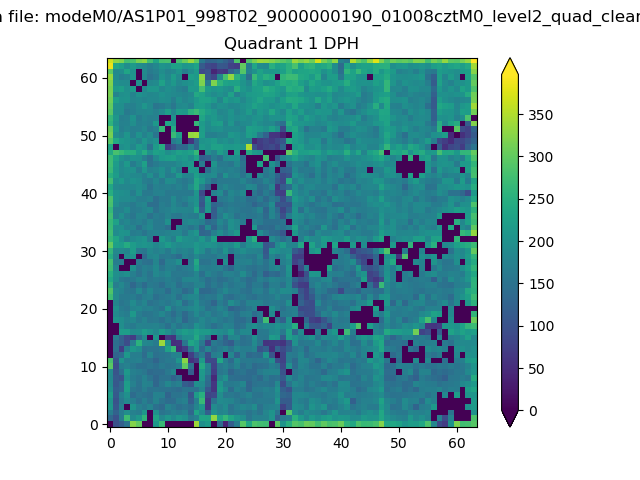 |
Quadrant B |
|---|---|---|---|
| Quadrant D | 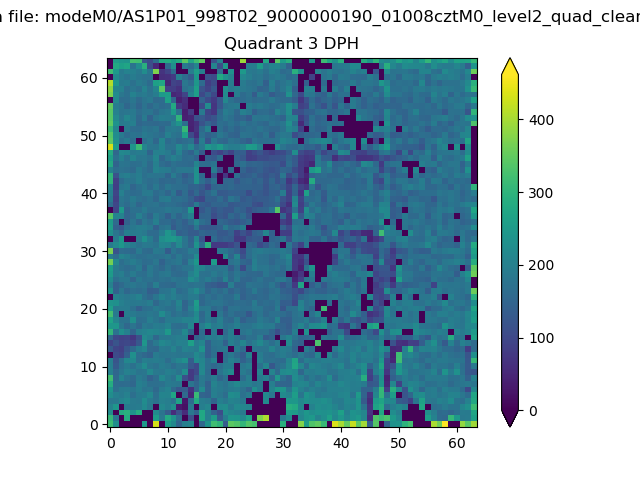 |
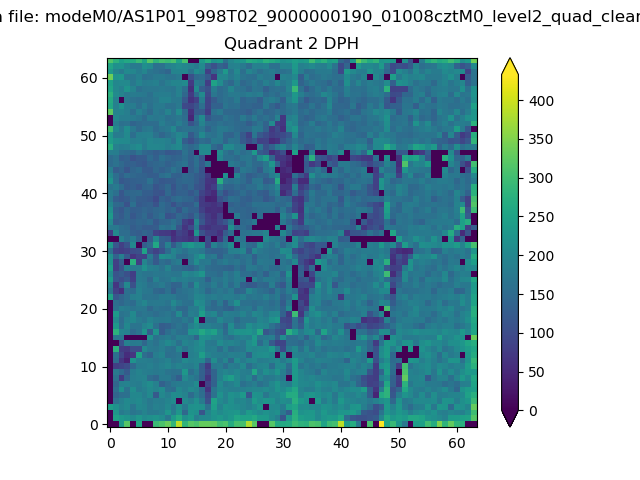 |
Quadrant C |
| Plot type | Count rate plots | Images |
|---|---|---|
| Comparison with Poisson distribution Blue bars denote a histogram of data divided into 1 sec bins. Red curve is a Poisson curve with rate = median count rate of data. |
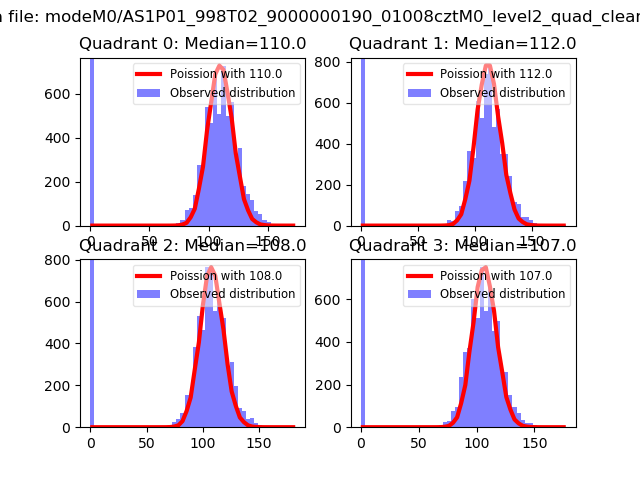 |
 |
| Quadrant-wise count rates Data is divided into 100 sec bins |
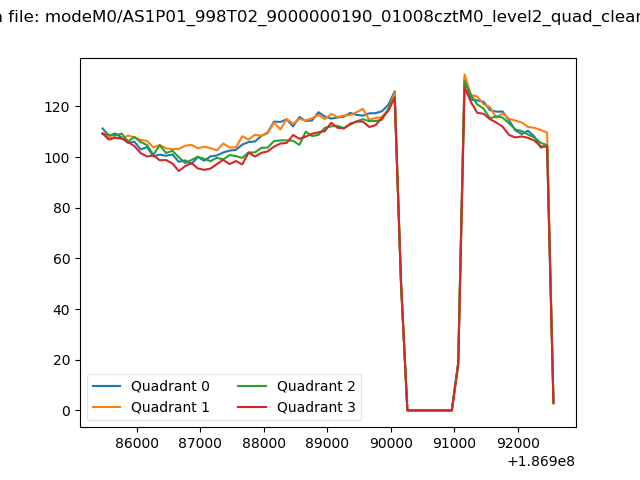 |
|
| Module-wise count rates for Quadrant A Data is divided into 100 sec bins |
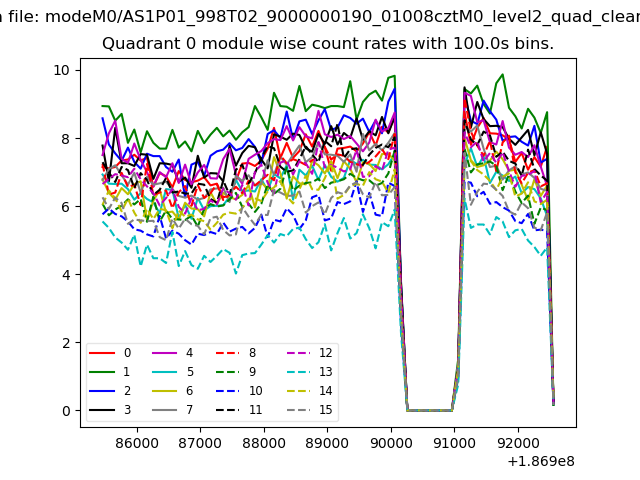 |
 |
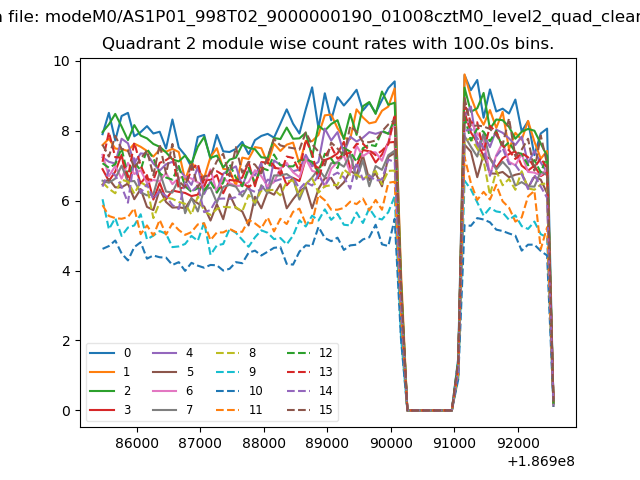
| Module-wise count rates for Quadrant B Data is divided into 100 sec bins |
 |
 |
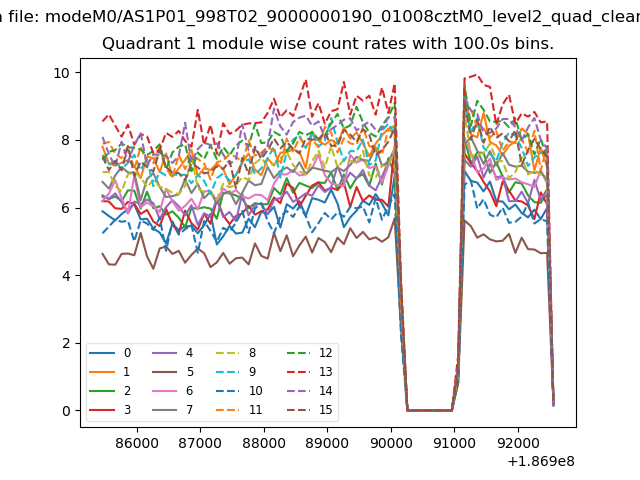
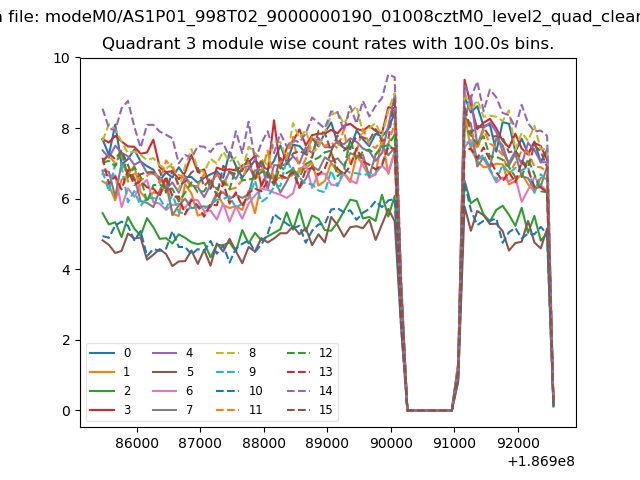
| Module-wise count rates for Quadrant C Data is divided into 100 sec bins |
 |
 |
| Module-wise count rates for Quadrant D Data is divided into 100 sec bins |
 |
 |
| Parameter | Plot |
|---|---|
| CZT HV Monitor | 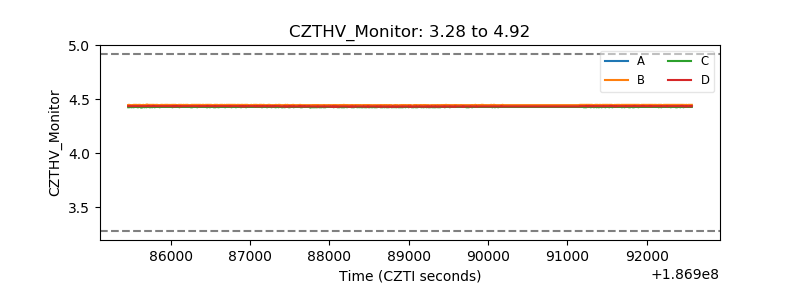 |
| D_VDD | 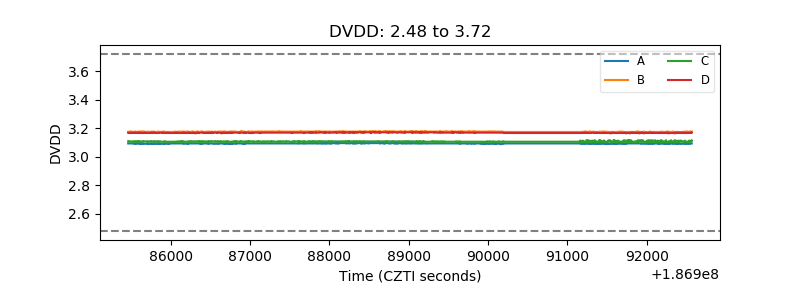 |
| Temperature 1 | 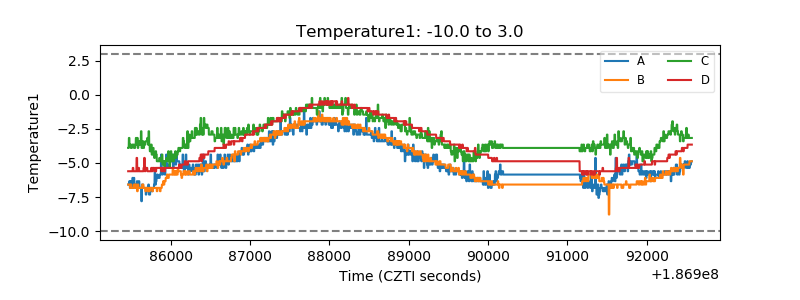 |
| Veto HV Monitor | 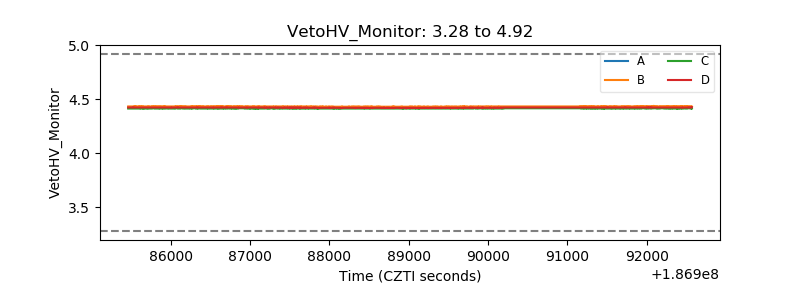 |
| Veto LLD |  |
| Alpha Counter | 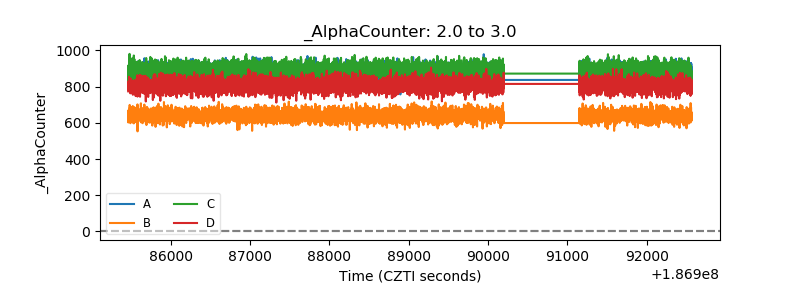 |
| _CPM_Rate | 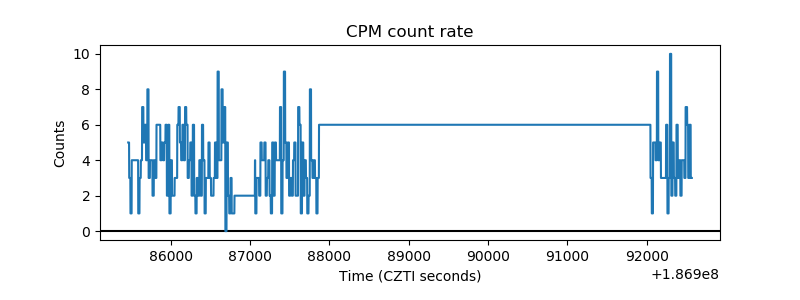 |
| CZT Counter | 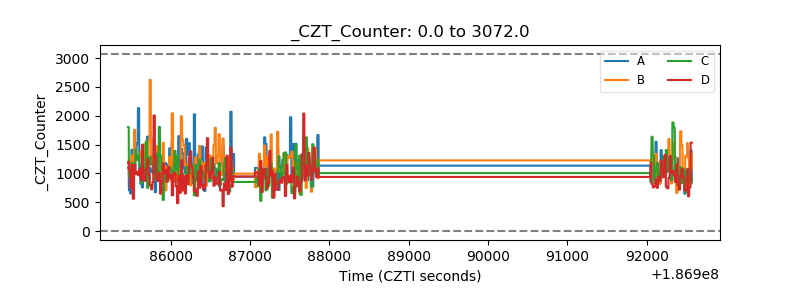 |
| +2.5 Volts monitor |  |
| +5 Volts monitor |  |
| _ROLL_ROT | 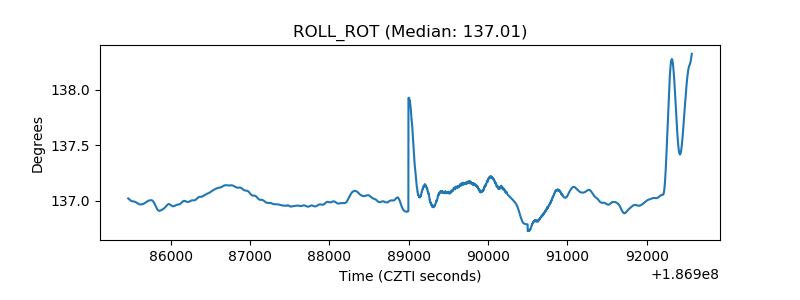 |
| _Roll_DEC | 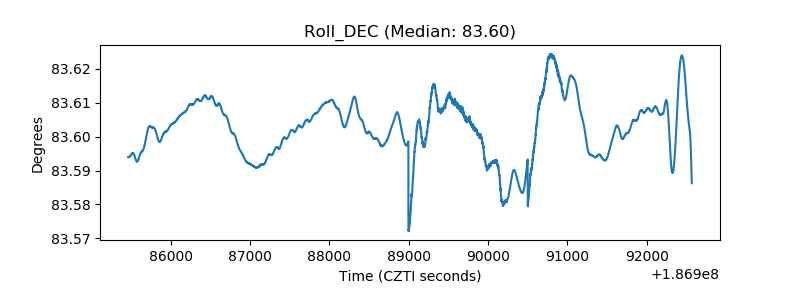 |
| _Roll_RA | 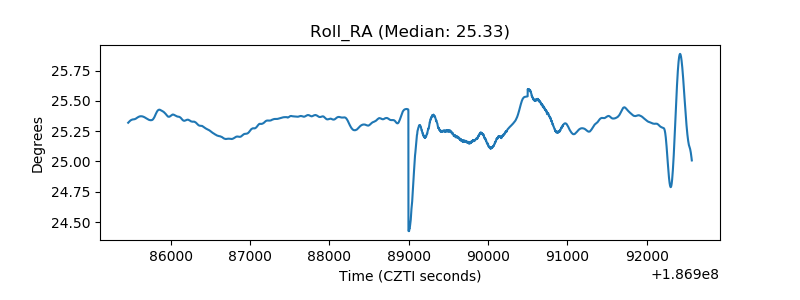 |
| Veto Counter | 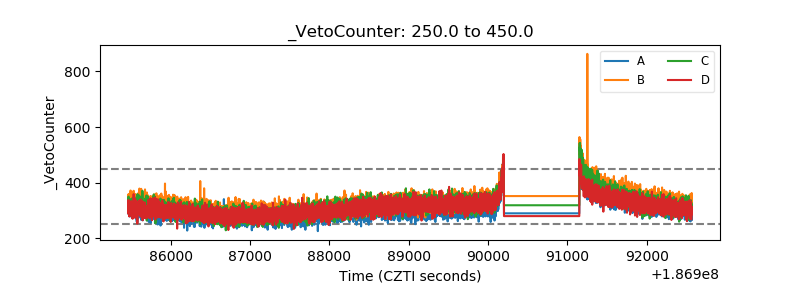 |