| Param | Original file | Final file |
|---|---|---|
| Filename | modeM0/AS1P01_998T02_9000000190_01011cztM0_level2.evt | modeM0/AS1P01_998T02_9000000190_01011cztM0_level2_quad_clean.evt |
| Size (bytes) | 1,015,257,600 | 114,514,560 |
| Size | 968.2 MB | 109.2 MB |
| Events in quadrant A | 7,687,831 | 770,584 |
| Events in quadrant B | 8,009,013 | 775,717 |
| Events in quadrant C | 7,611,441 | 739,679 |
| Events in quadrant D | 7,013,040 | 734,595 |
| Mode M0 | |||
|---|---|---|---|
| Quadrant | BADHDUFLAG | Total packets | Discarded packets |
| A | 0 | 27444 | 5 |
| B | 0 | 28359 | 1 |
| C | 0 | 27223 | 1 |
| D | 0 | 25395 | 1 |
| Mode SS | |||
|---|---|---|---|
| Quadrant | BADHDUFLAG | Total packets | Discarded packets |
| A | 0 | 132 | 0 |
| B | 0 | 132 | 0 |
| C | 0 | 132 | 0 |
| D | 0 | 132 | 0 |
| Mode M9 | |||
|---|---|---|---|
| Quadrant | BADHDUFLAG | Total packets | Discarded packets |
| A | 0 | 10 | 0 |
| B | 0 | 10 | 0 |
| C | 0 | 10 | 0 |
| D | 0 | 10 | 0 |
| Quadrant | Total seconds | Saturated seconds | Saturation percentage |
|---|---|---|---|
| A | 6412 | 60 | 0.935745% |
| B | 6412 | 62 | 0.966937% |
| C | 6412 | 50 | 0.779788% |
| D | 6412 | 49 | 0.764192% |
Noise dominated data is calculated using 1-second bins in cleaned event files. If a bin has >2000 counts, and if more than 50% of those come from <1% of pixels, then it is considered to be noise-dominated and hence unusable.
| Quadrant | # 1 sec bins | Bins with >0 counts | Bins with >2000 counts | High rate bins dominated by noise | Noise dominated (total time) | Noise dominated (detector-on time) | Marked lightcurve |
|---|---|---|---|---|---|---|---|
| A | 7502 | 6413 | 212 | 212 | 2.83% | 3.31% | 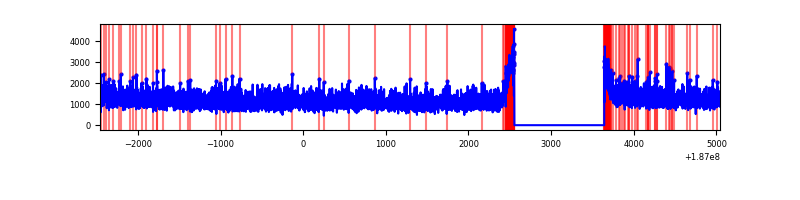 |
| B | 7502 | 6413 | 251 | 251 | 3.35% | 3.91% | 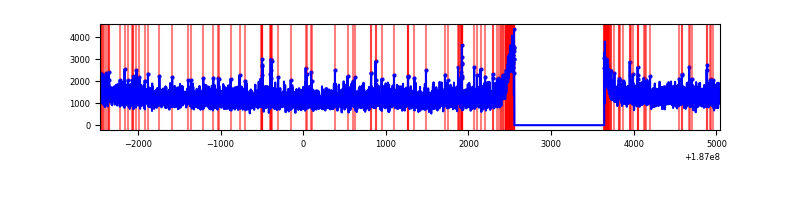 |
| C | 7502 | 6413 | 196 | 196 | 2.61% | 3.06% | 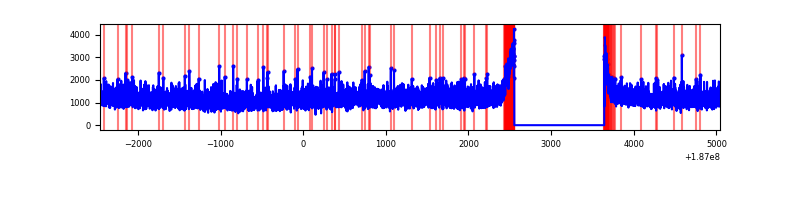 |
| D | 7502 | 6413 | 145 | 145 | 1.93% | 2.26% | 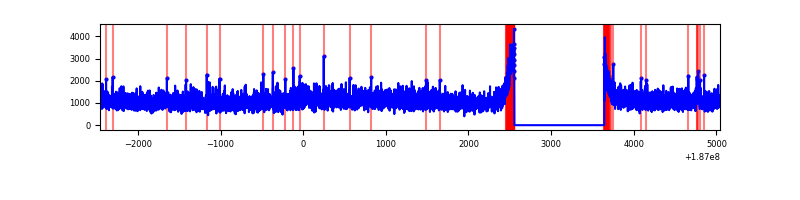 |
Top three noisy pixels from each quadrant. If the there are fewer than three noisy pixels in the level2.evt file, extra rows are filled as -1
| Pixel properties | Quadrant properties | ||||||
|---|---|---|---|---|---|---|---|
| Quadrant | DetID | PixID | Counts | Sigma | Mean | Median | Sigma |
| A | 12 | 189 | 12369 | 21.65 | 1999 | 2014 | 478.4 |
| A | 11 | 79 | 8503 | 13.56 | 1999 | 2014 | 478.4 |
| A | 3 | 111 | 6284 | 8.93 | 1999 | 2014 | 478.4 |
| B | 5 | 249 | 50208 | 98.97 | 2059 | 2063 | 486.5 |
| B | 7 | 221 | 27916 | 53.14 | 2059 | 2063 | 486.5 |
| B | 15 | 22 | 22953 | 42.94 | 2059 | 2063 | 486.5 |
| C | 15 | 241 | 301098 | 579.81 | 1855 | 1914 | 516.0 |
| C | 3 | 111 | 22810 | 40.49 | 1855 | 1914 | 516.0 |
| C | 9 | 85 | 19049 | 33.21 | 1855 | 1914 | 516.0 |
| D | 1 | 4 | 211586 | 374.92 | 1816 | 1875 | 559.4 |
| D | 13 | 73 | 10663 | 15.71 | 1816 | 1875 | 559.4 |
| D | 0 | 255 | 7242 | 9.59 | 1816 | 1875 | 559.4 |
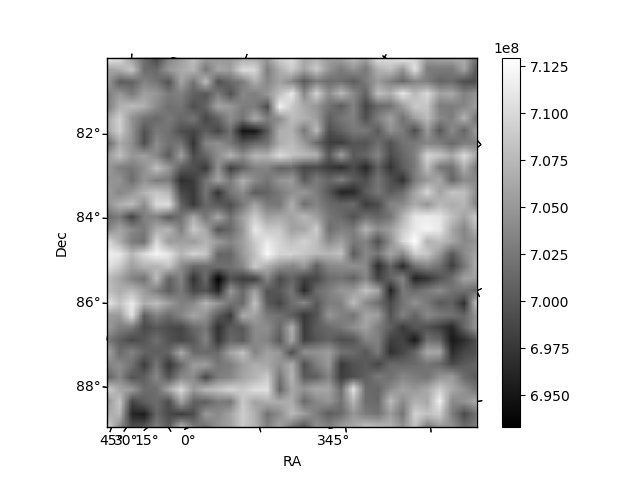
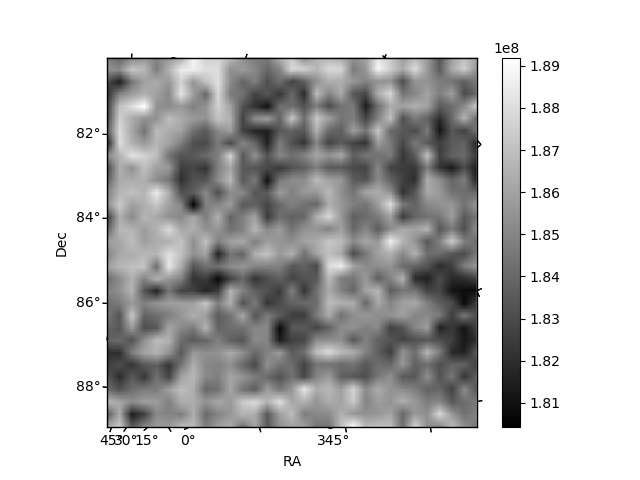
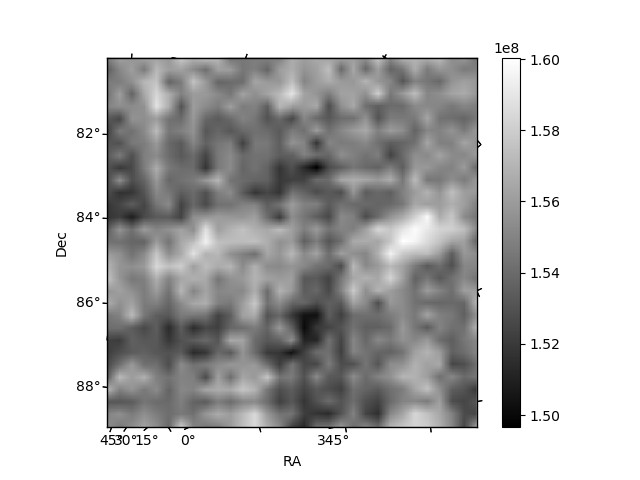
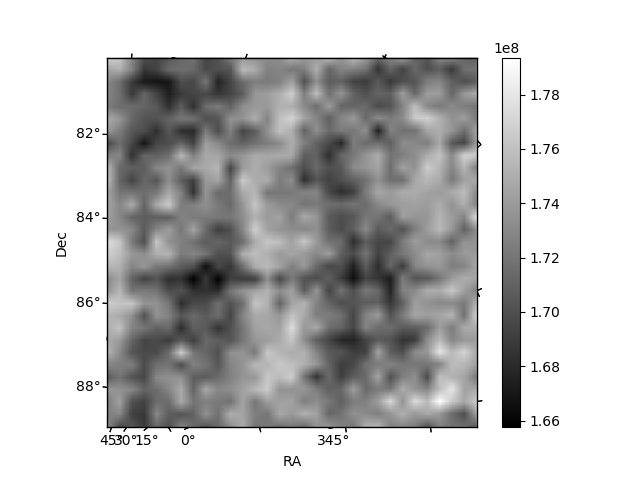
Histogram calculated using DETX and DETY for each event in the final _common_clean file
| Quadrant A | 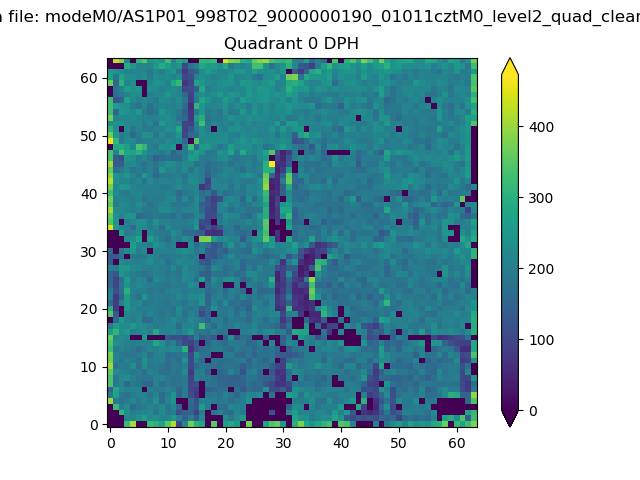 |
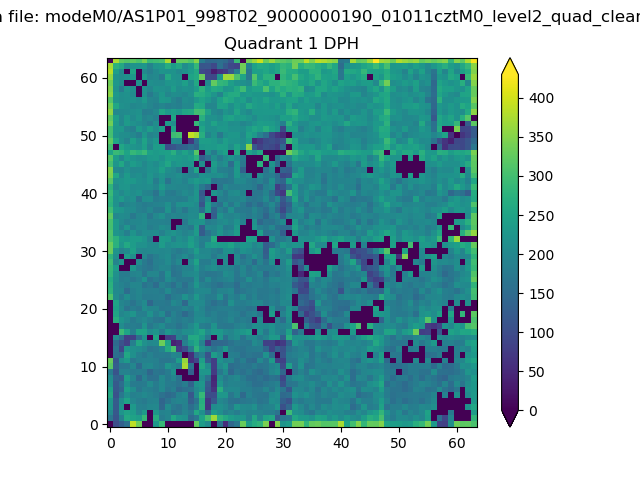 |
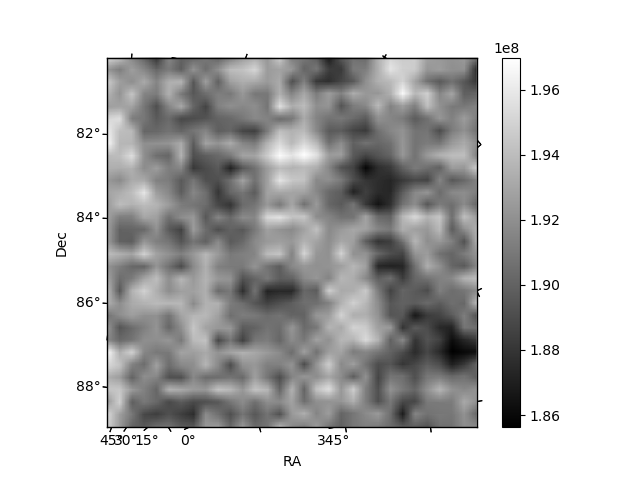
Quadrant B |
|---|---|---|---|
| Quadrant D | 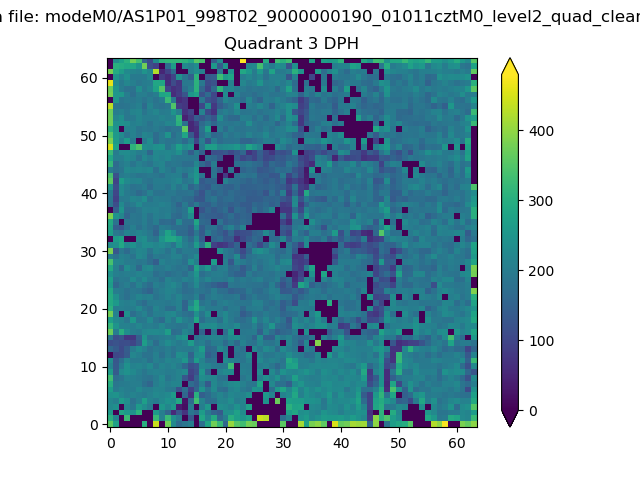 |
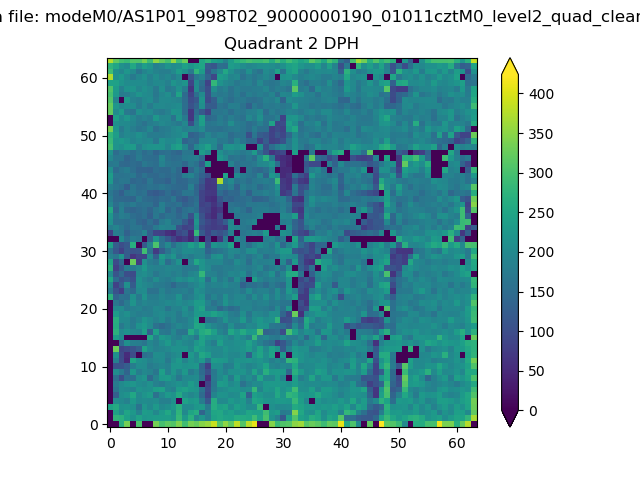 |
Quadrant C |
| Plot type | Count rate plots | Images |
|---|---|---|
| Comparison with Poisson distribution Blue bars denote a histogram of data divided into 1 sec bins. Red curve is a Poisson curve with rate = median count rate of data. |
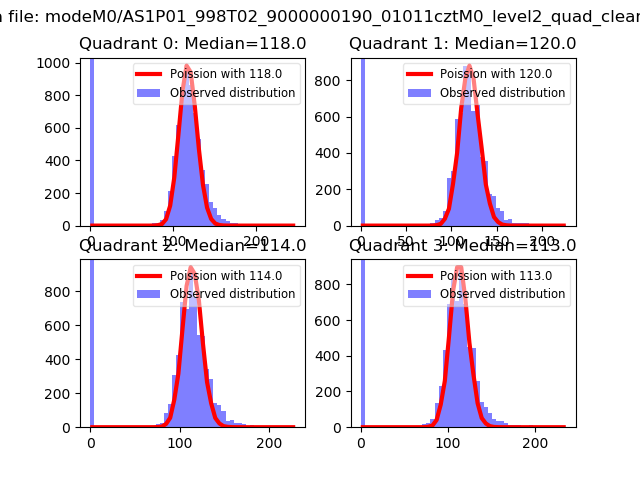 |
 |
| Quadrant-wise count rates Data is divided into 100 sec bins |
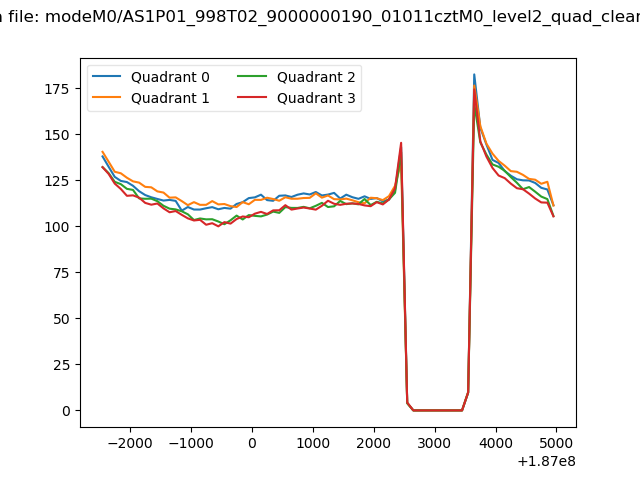 |
|
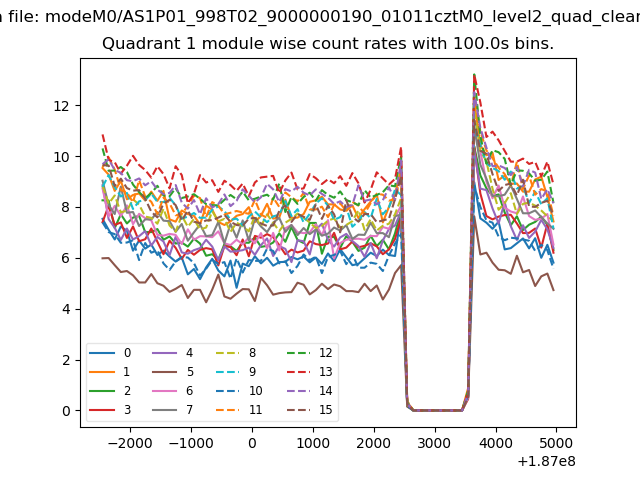
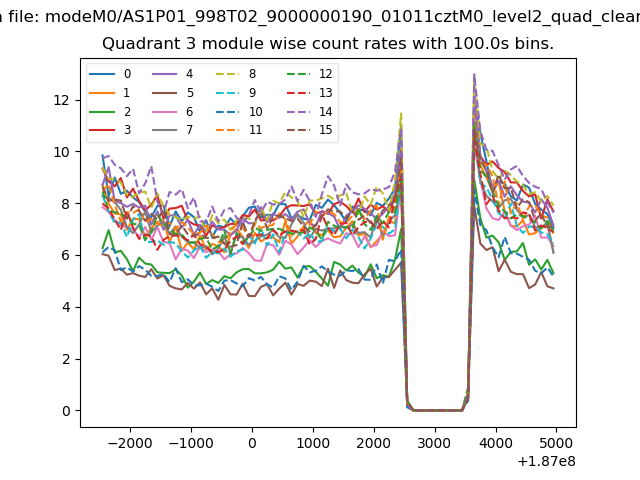
| Module-wise count rates for Quadrant A Data is divided into 100 sec bins |
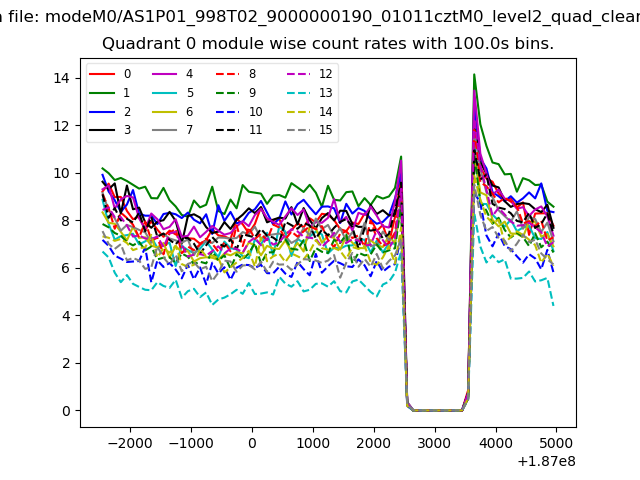 |
 |
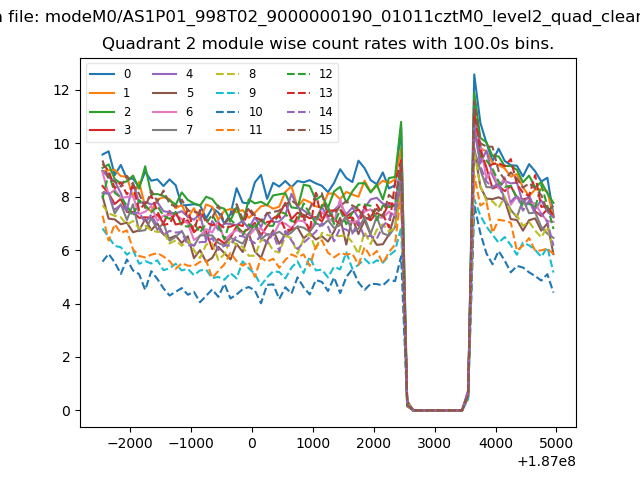
| Module-wise count rates for Quadrant B Data is divided into 100 sec bins |
 |
 |
| Module-wise count rates for Quadrant C Data is divided into 100 sec bins |
 |
 |
| Module-wise count rates for Quadrant D Data is divided into 100 sec bins |
 |
 |
| Parameter | Plot |
|---|---|
| CZT HV Monitor | 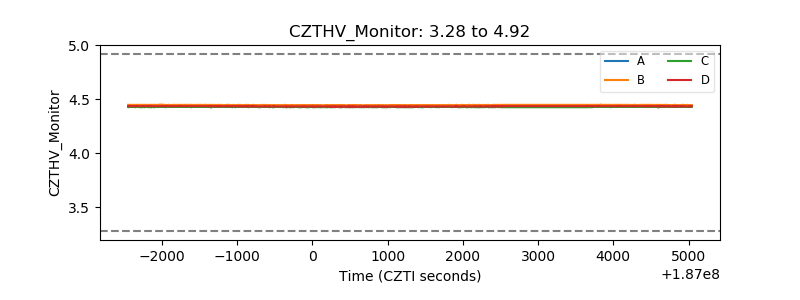 |
| D_VDD | 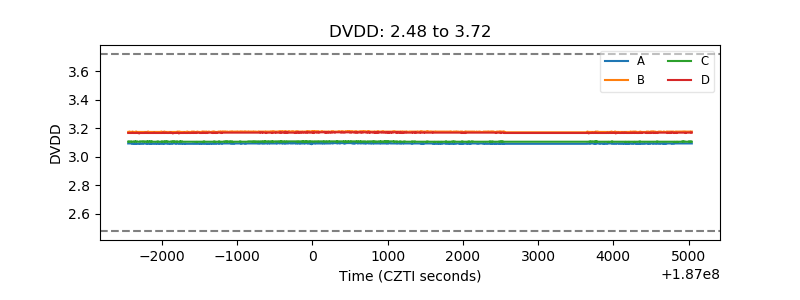 |
| Temperature 1 | 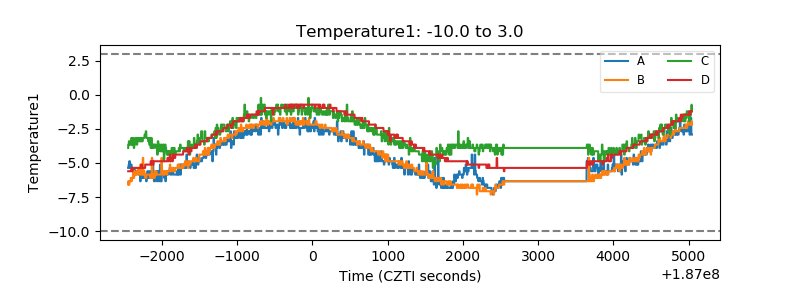 |
| Veto HV Monitor | 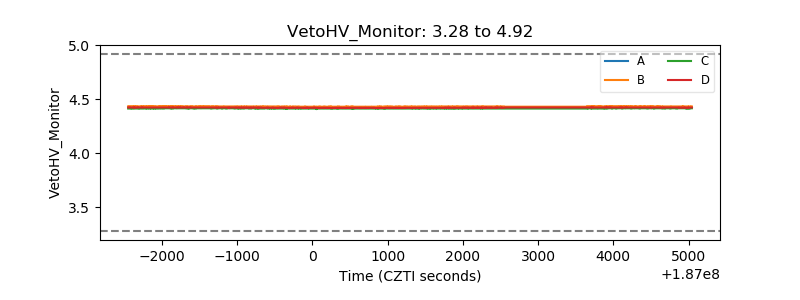 |
| Veto LLD | 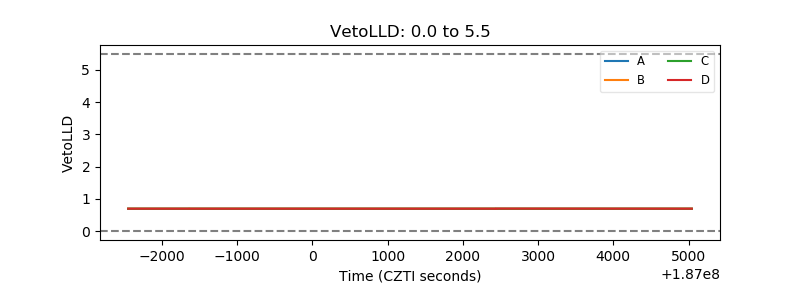 |
| Alpha Counter | 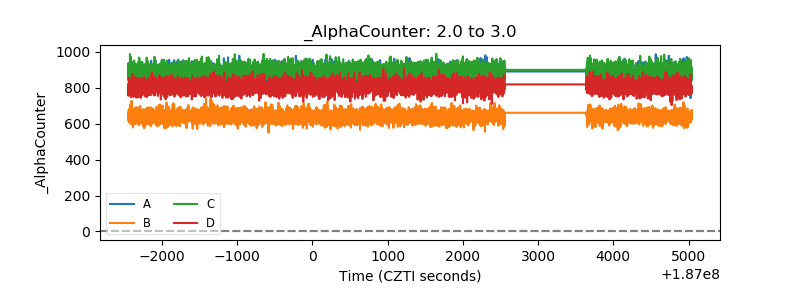 |
| _CPM_Rate | 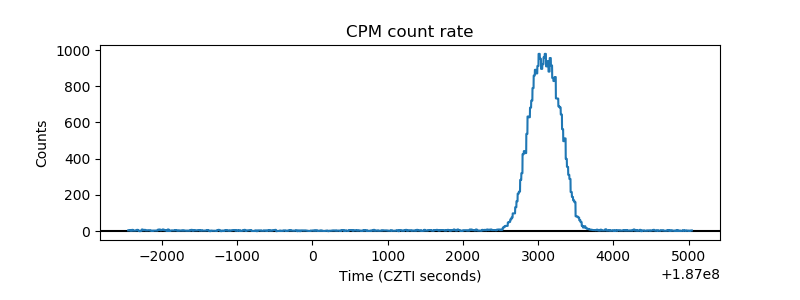 |
| CZT Counter | 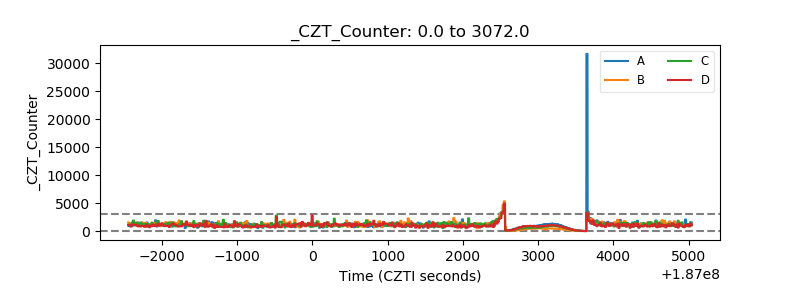 |
| +2.5 Volts monitor |  |
| +5 Volts monitor |  |
| _ROLL_ROT | 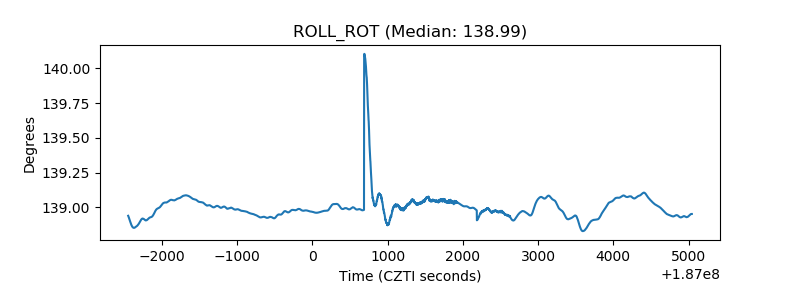 |
| _Roll_DEC | 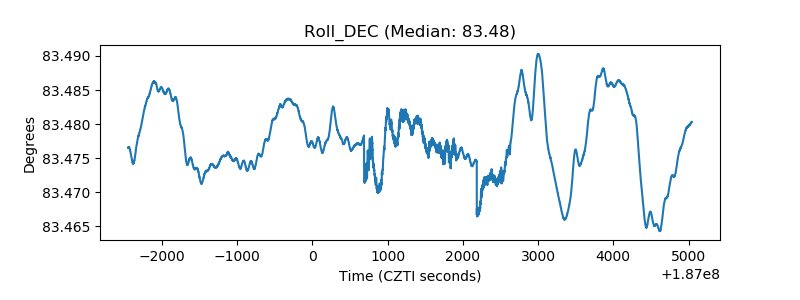 |
| _Roll_RA | 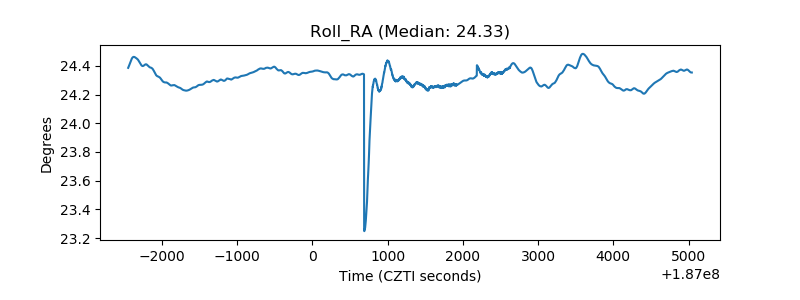 |
| Veto Counter | 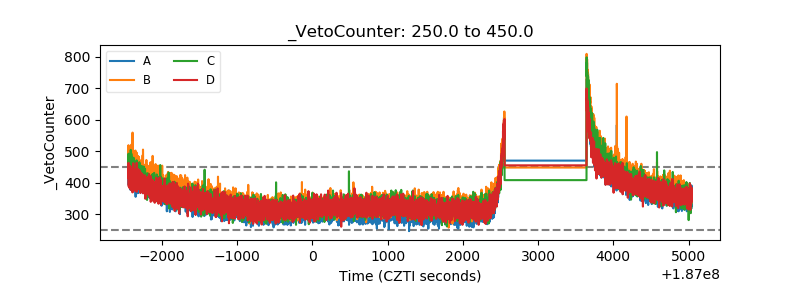 |