| Param | Original file | Final file |
|---|---|---|
| Filename | modeM0/AS1P01_998T02_9000000190_01012cztM0_level2.evt | modeM0/AS1P01_998T02_9000000190_01012cztM0_level2_quad_clean.evt |
| Size (bytes) | 941,590,080 | 104,135,040 |
| Size | 898.0 MB | 99.3 MB |
| Events in quadrant A | 6,945,100 | 702,145 |
| Events in quadrant B | 7,299,230 | 704,889 |
| Events in quadrant C | 6,992,243 | 675,100 |
| Events in quadrant D | 6,896,414 | 668,092 |
| Mode M0 | |||
|---|---|---|---|
| Quadrant | BADHDUFLAG | Total packets | Discarded packets |
| A | 0 | 24704 | 1 |
| B | 0 | 25743 | 1 |
| C | 0 | 24902 | 1 |
| D | 0 | 24588 | 4 |
| Mode SS | |||
|---|---|---|---|
| Quadrant | BADHDUFLAG | Total packets | Discarded packets |
| A | 0 | 118 | 0 |
| B | 0 | 118 | 0 |
| C | 0 | 118 | 0 |
| D | 0 | 118 | 0 |
| Mode M9 | |||
|---|---|---|---|
| Quadrant | BADHDUFLAG | Total packets | Discarded packets |
| A | 0 | 12 | 0 |
| B | 0 | 12 | 0 |
| C | 0 | 12 | 0 |
| D | 0 | 12 | 0 |
| Quadrant | Total seconds | Saturated seconds | Saturation percentage |
|---|---|---|---|
| A | 5773 | 60 | 1.039321% |
| B | 5773 | 78 | 1.351117% |
| C | 5773 | 59 | 1.021999% |
| D | 5772 | 46 | 0.796951% |
Noise dominated data is calculated using 1-second bins in cleaned event files. If a bin has >2000 counts, and if more than 50% of those come from <1% of pixels, then it is considered to be noise-dominated and hence unusable.
| Quadrant | # 1 sec bins | Bins with >0 counts | Bins with >2000 counts | High rate bins dominated by noise | Noise dominated (total time) | Noise dominated (detector-on time) | Marked lightcurve |
|---|---|---|---|---|---|---|---|
| A | 6948 | 5774 | 216 | 216 | 3.11% | 3.74% | 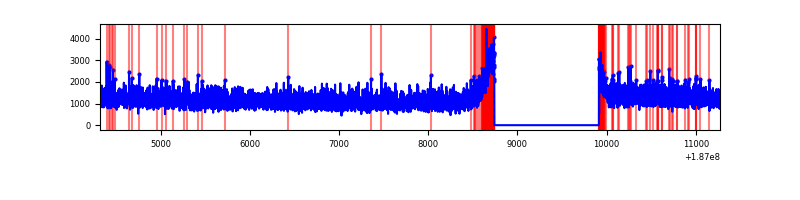 |
| B | 6948 | 5774 | 248 | 248 | 3.57% | 4.30% | 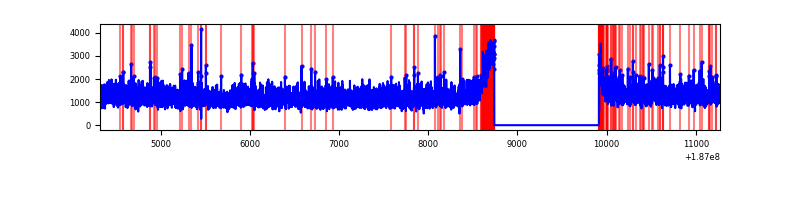 |
| C | 6948 | 5774 | 207 | 207 | 2.98% | 3.59% | 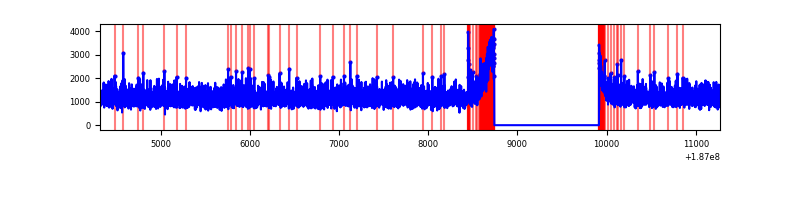 |
| D | 6947 | 5773 | 228 | 228 | 3.28% | 3.95% | 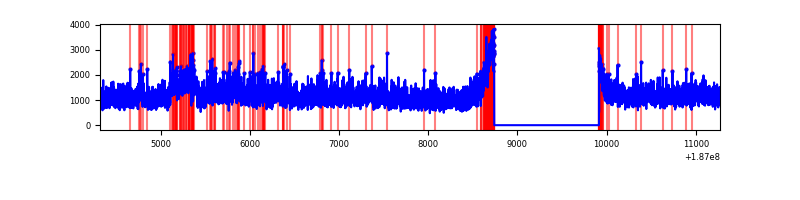 |
Top three noisy pixels from each quadrant. If the there are fewer than three noisy pixels in the level2.evt file, extra rows are filled as -1
| Pixel properties | Quadrant properties | ||||||
|---|---|---|---|---|---|---|---|
| Quadrant | DetID | PixID | Counts | Sigma | Mean | Median | Sigma |
| A | 12 | 189 | 7438 | 12.94 | 1809 | 1823 | 433.8 |
| A | 11 | 79 | 7324 | 12.68 | 1809 | 1823 | 433.8 |
| A | 3 | 111 | 5396 | 8.24 | 1809 | 1823 | 433.8 |
| B | 0 | 151 | 60121 | 132.93 | 1854 | 1861 | 438.3 |
| B | 15 | 22 | 55597 | 122.61 | 1854 | 1861 | 438.3 |
| B | 7 | 221 | 30935 | 66.34 | 1854 | 1861 | 438.3 |
| C | 15 | 241 | 275756 | 579.25 | 1695 | 1751 | 473.0 |
| C | 10 | 19 | 29356 | 58.36 | 1695 | 1751 | 473.0 |
| C | 8 | 208 | 26562 | 52.45 | 1695 | 1751 | 473.0 |
| D | 1 | 4 | 410855 | 796.15 | 1670 | 1730 | 513.9 |
| D | 10 | 85 | 179577 | 346.09 | 1670 | 1730 | 513.9 |
| D | 0 | 255 | 25204 | 45.68 | 1670 | 1730 | 513.9 |
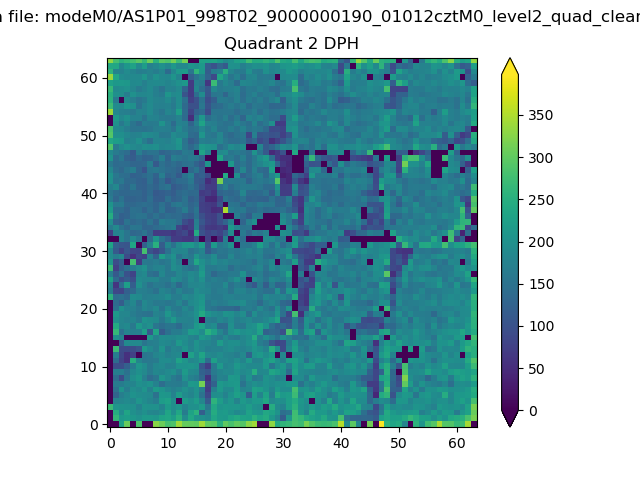
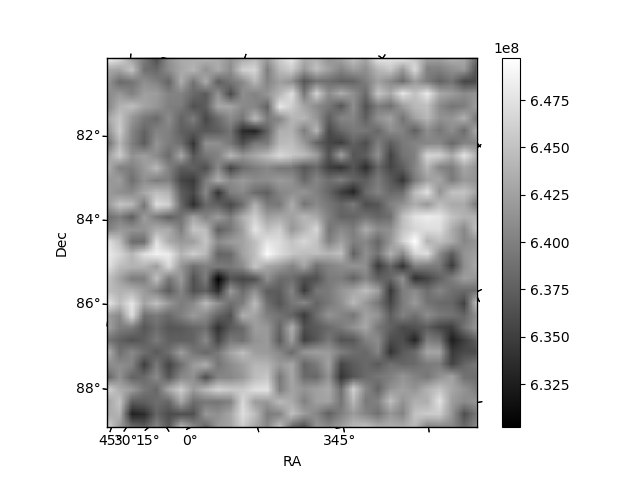
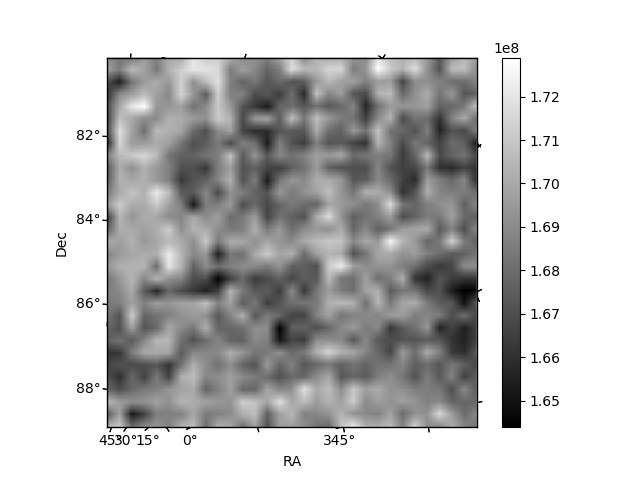
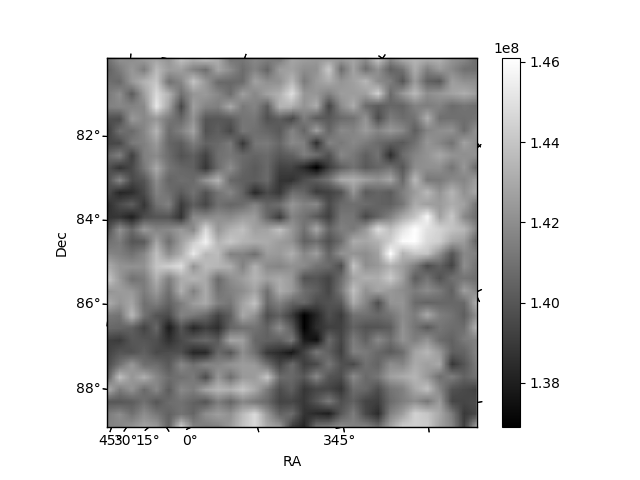
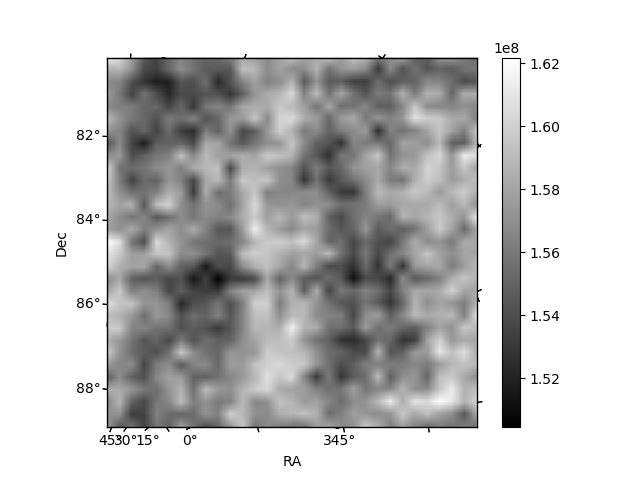
Histogram calculated using DETX and DETY for each event in the final _common_clean file
| Quadrant A | 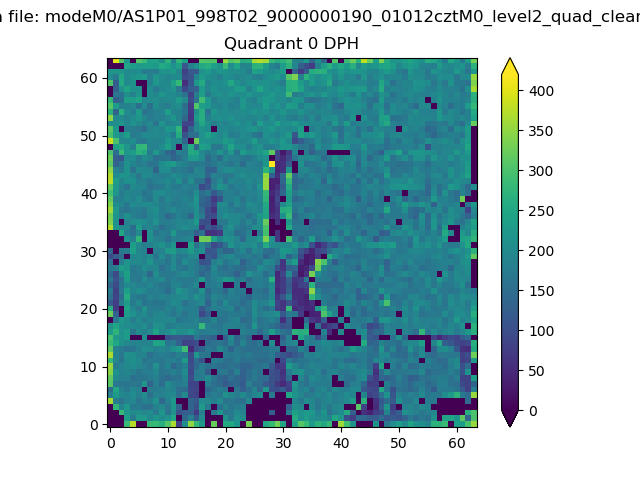 |
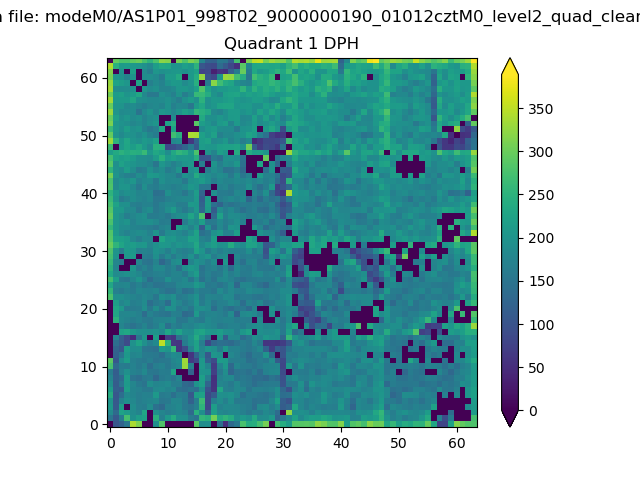 |
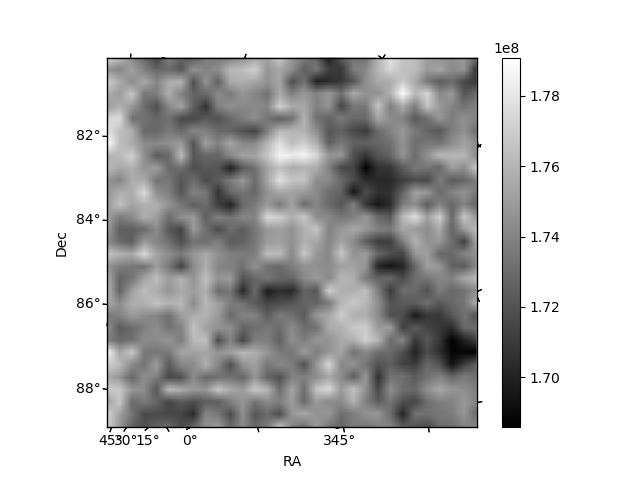
Quadrant B |
|---|---|---|---|
| Quadrant D | 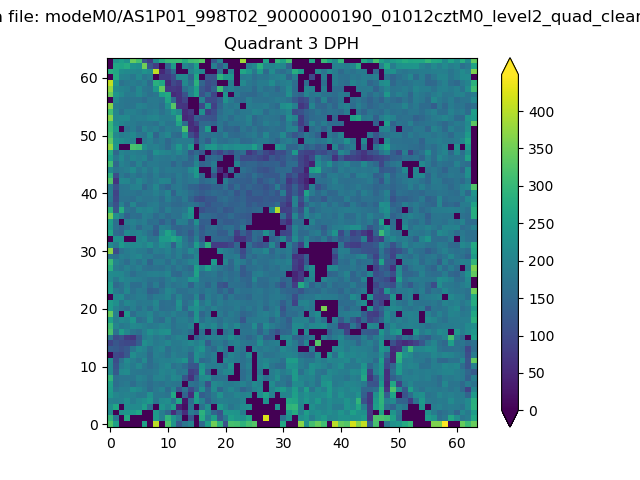 |
 |
Quadrant C |
| Plot type | Count rate plots | Images |
|---|---|---|
| Comparison with Poisson distribution Blue bars denote a histogram of data divided into 1 sec bins. Red curve is a Poisson curve with rate = median count rate of data. |
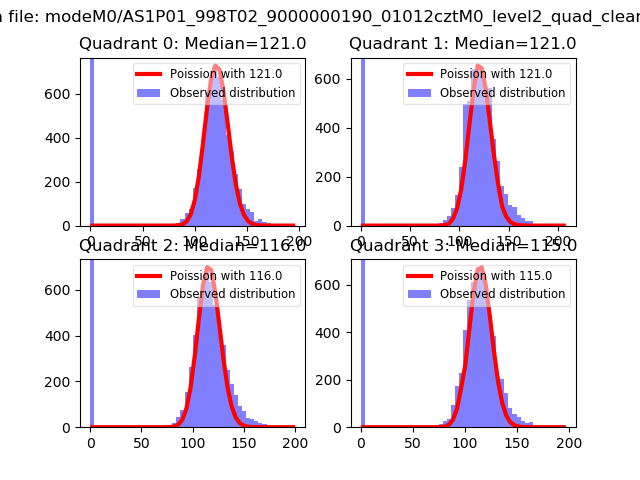 |
 |
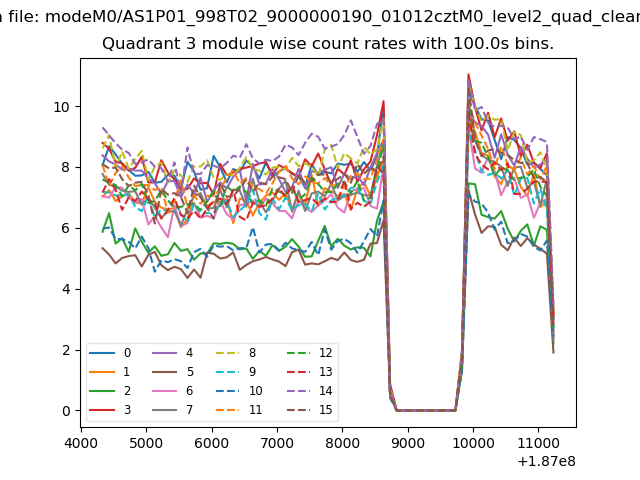
| Quadrant-wise count rates Data is divided into 100 sec bins |
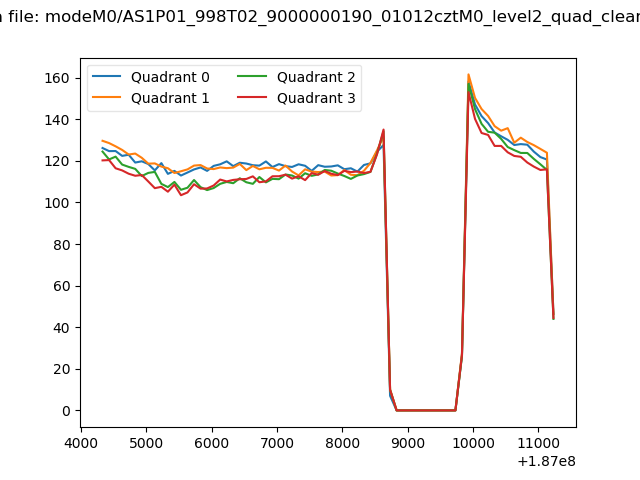 |
|
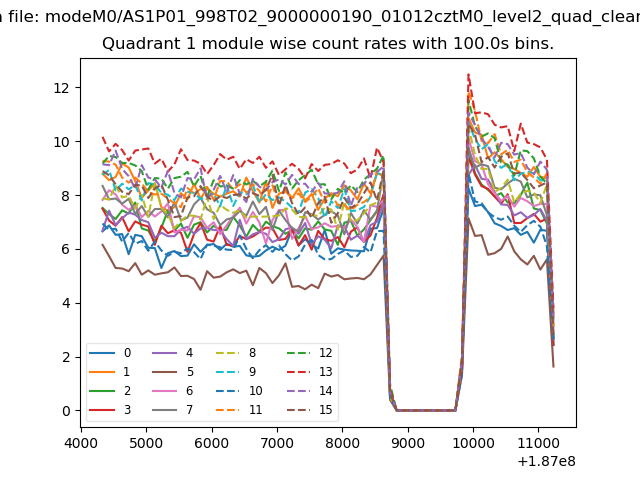
| Module-wise count rates for Quadrant A Data is divided into 100 sec bins |
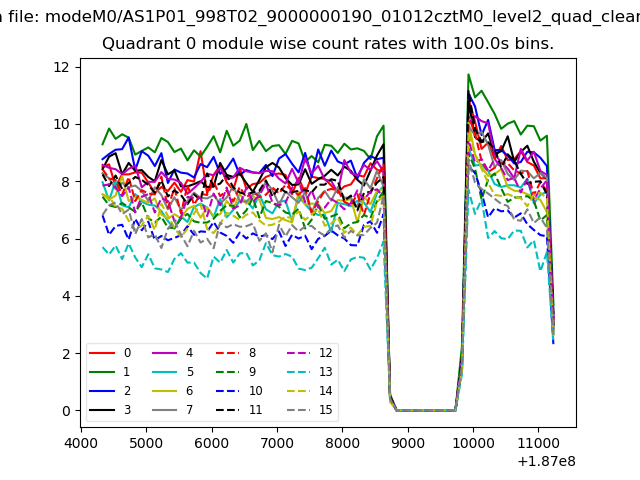 |
 |
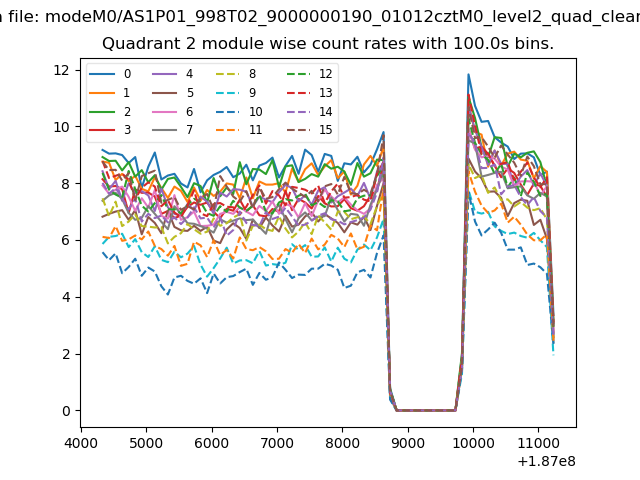
| Module-wise count rates for Quadrant B Data is divided into 100 sec bins |
 |
 |
| Module-wise count rates for Quadrant C Data is divided into 100 sec bins |
 |
 |
| Module-wise count rates for Quadrant D Data is divided into 100 sec bins |
 |
 |
| Parameter | Plot |
|---|---|
| CZT HV Monitor | 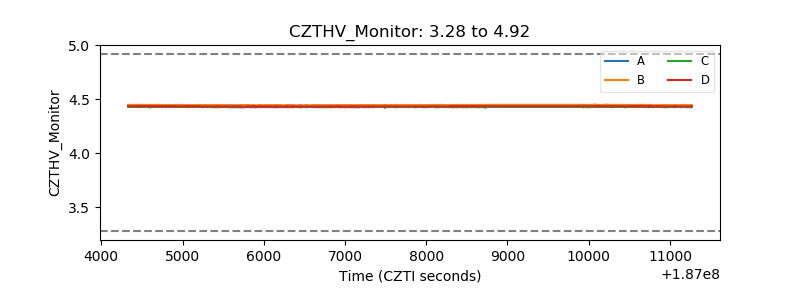 |
| D_VDD | 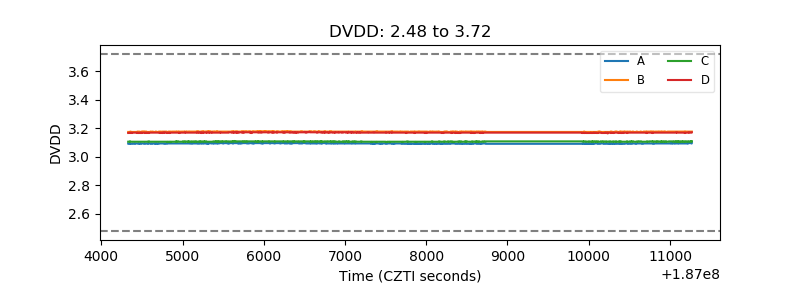 |
| Temperature 1 | 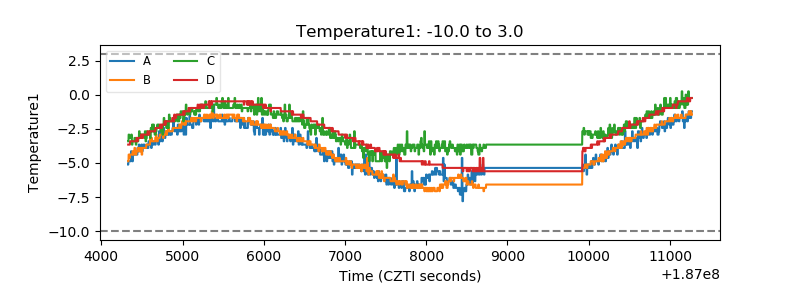 |
| Veto HV Monitor | 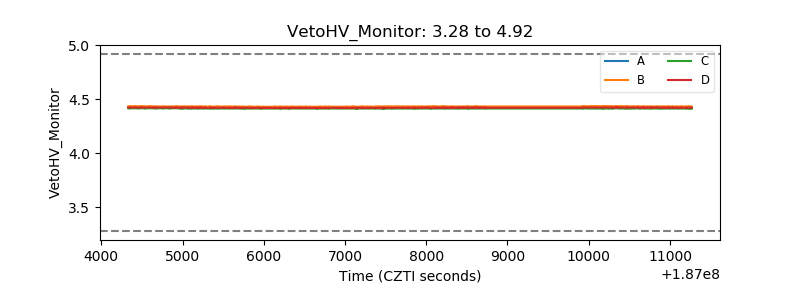 |
| Veto LLD | 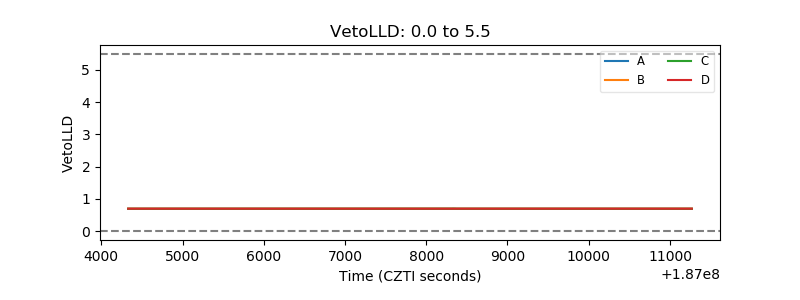 |
| Alpha Counter | 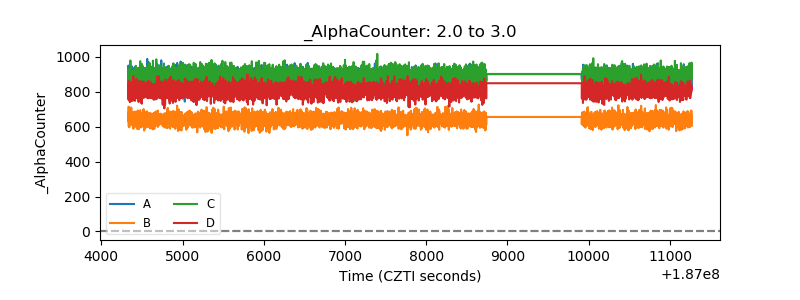 |
| _CPM_Rate | 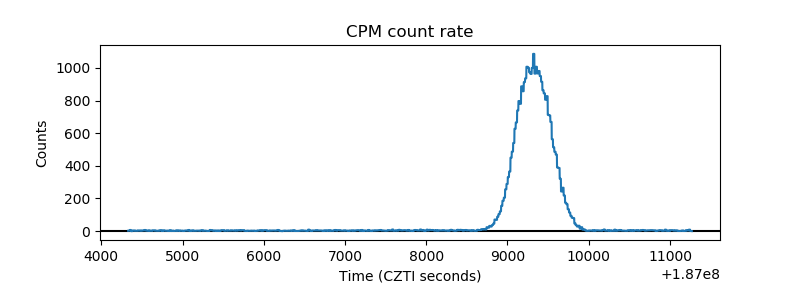 |
| CZT Counter | 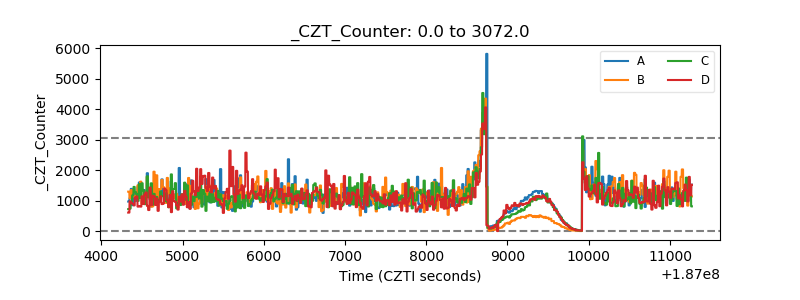 |
| +2.5 Volts monitor |  |
| +5 Volts monitor |  |
| _ROLL_ROT | 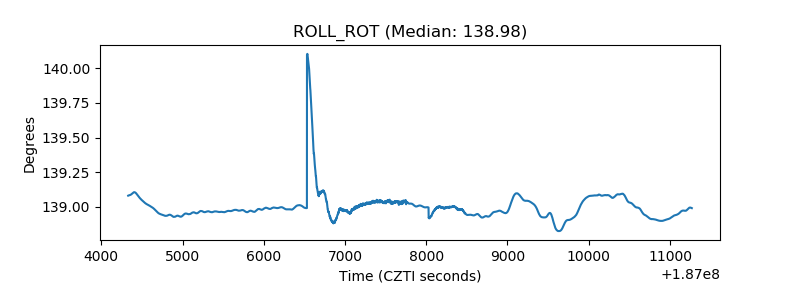 |
| _Roll_DEC | 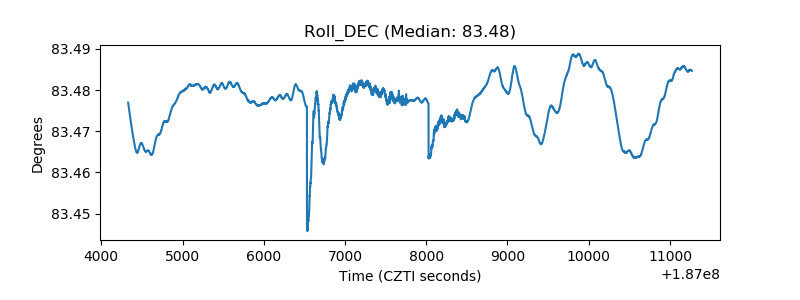 |
| _Roll_RA |  |
| Veto Counter | 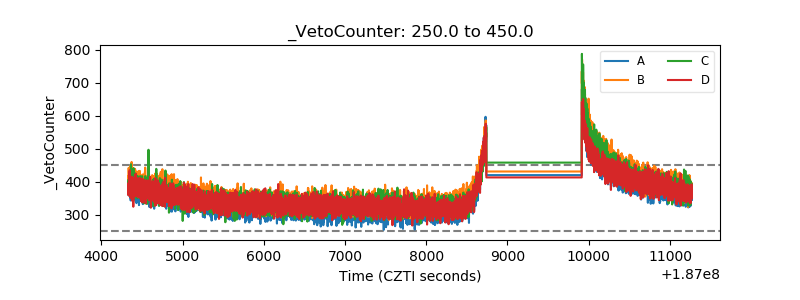 |