| Param | Original file | Final file |
|---|---|---|
| Filename | modeM0/AS1P01_998T02_9000000190_01013cztM0_level2.evt | modeM0/AS1P01_998T02_9000000190_01013cztM0_level2_quad_clean.evt |
| Size (bytes) | 997,217,280 | 110,059,200 |
| Size | 951.0 MB | 105.0 MB |
| Events in quadrant A | 7,302,785 | 745,192 |
| Events in quadrant B | 8,138,394 | 734,851 |
| Events in quadrant C | 7,356,987 | 717,514 |
| Events in quadrant D | 6,997,950 | 709,596 |
| Mode M0 | |||
|---|---|---|---|
| Quadrant | BADHDUFLAG | Total packets | Discarded packets |
| A | 0 | 26026 | 4 |
| B | 0 | 28557 | 1 |
| C | 0 | 26188 | 1 |
| D | 0 | 25133 | 1 |
| Mode SS | |||
|---|---|---|---|
| Quadrant | BADHDUFLAG | Total packets | Discarded packets |
| A | 0 | 124 | 0 |
| B | 0 | 124 | 0 |
| C | 0 | 124 | 0 |
| D | 0 | 124 | 0 |
| Mode M9 | |||
|---|---|---|---|
| Quadrant | BADHDUFLAG | Total packets | Discarded packets |
| A | 0 | 12 | 0 |
| B | 0 | 12 | 0 |
| C | 0 | 12 | 0 |
| D | 0 | 12 | 0 |
| Quadrant | Total seconds | Saturated seconds | Saturation percentage |
|---|---|---|---|
| A | 6103 | 68 | 1.114206% |
| B | 6103 | 231 | 3.785024% |
| C | 6103 | 57 | 0.933967% |
| D | 6104 | 62 | 1.015727% |
Noise dominated data is calculated using 1-second bins in cleaned event files. If a bin has >2000 counts, and if more than 50% of those come from <1% of pixels, then it is considered to be noise-dominated and hence unusable.
| Quadrant | # 1 sec bins | Bins with >0 counts | Bins with >2000 counts | High rate bins dominated by noise | Noise dominated (total time) | Noise dominated (detector-on time) | Marked lightcurve |
|---|---|---|---|---|---|---|---|
| A | 7298 | 6104 | 248 | 248 | 3.40% | 4.06% | 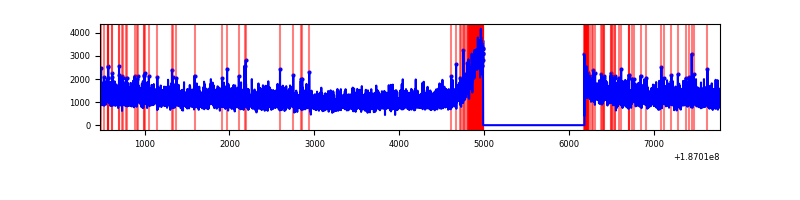 |
| B | 7298 | 6104 | 526 | 526 | 7.21% | 8.62% | 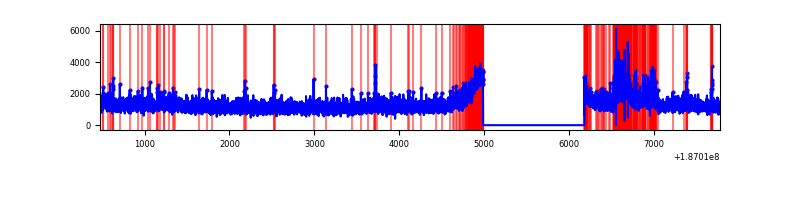 |
| C | 7298 | 6104 | 207 | 207 | 2.84% | 3.39% | 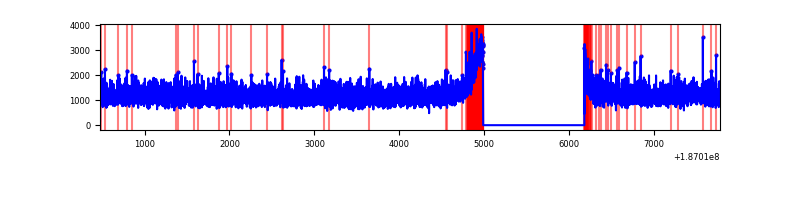 |
| D | 7299 | 6105 | 196 | 196 | 2.69% | 3.21% | 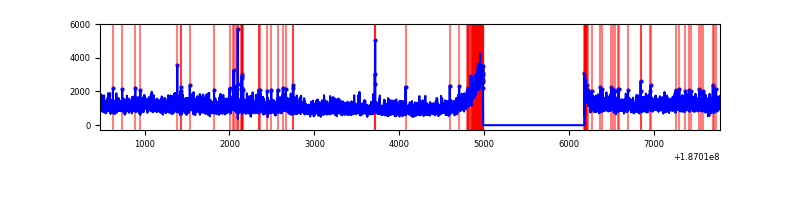 |
Top three noisy pixels from each quadrant. If the there are fewer than three noisy pixels in the level2.evt file, extra rows are filled as -1
| Pixel properties | Quadrant properties | ||||||
|---|---|---|---|---|---|---|---|
| Quadrant | DetID | PixID | Counts | Sigma | Mean | Median | Sigma |
| A | 12 | 189 | 11091 | 20.18 | 1899 | 1913 | 454.8 |
| A | 15 | 233 | 7286 | 11.81 | 1899 | 1913 | 454.8 |
| A | 11 | 79 | 6404 | 9.87 | 1899 | 1913 | 454.8 |
| B | 4 | 200 | 538906 | 1187.94 | 1926 | 1931 | 452.0 |
| B | 15 | 22 | 69059 | 148.51 | 1926 | 1931 | 452.0 |
| B | 5 | 249 | 56521 | 120.77 | 1926 | 1931 | 452.0 |
| C | 15 | 241 | 297486 | 595.2 | 1790 | 1850 | 496.7 |
| C | 3 | 79 | 29338 | 55.34 | 1790 | 1850 | 496.7 |
| C | 3 | 111 | 27251 | 51.14 | 1790 | 1850 | 496.7 |
| D | 1 | 4 | 276895 | 515.22 | 1770 | 1828 | 533.9 |
| D | 9 | 49 | 29519 | 51.87 | 1770 | 1828 | 533.9 |
| D | 0 | 255 | 21710 | 37.24 | 1770 | 1828 | 533.9 |
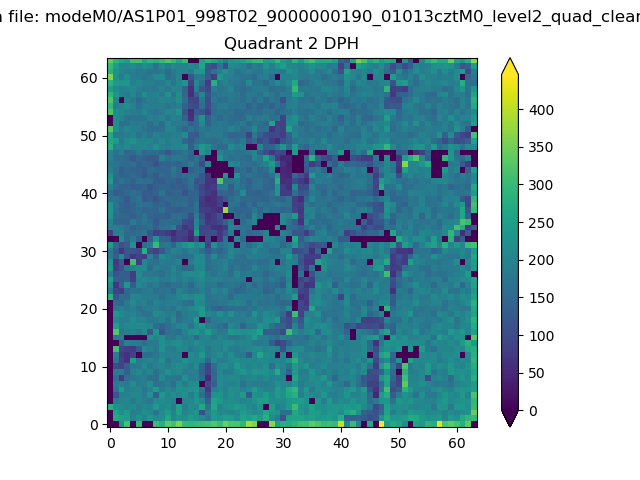
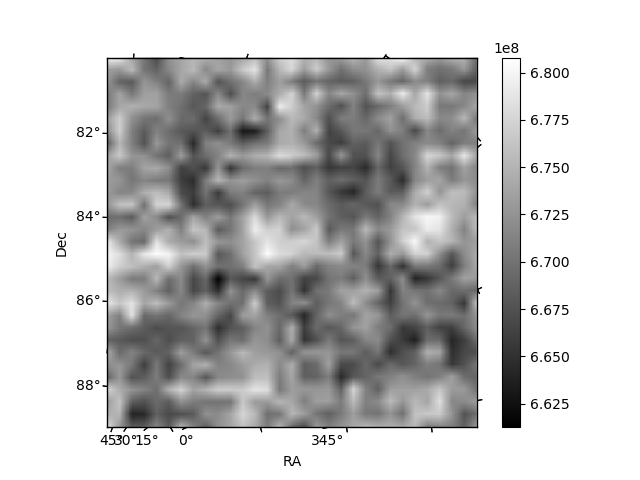
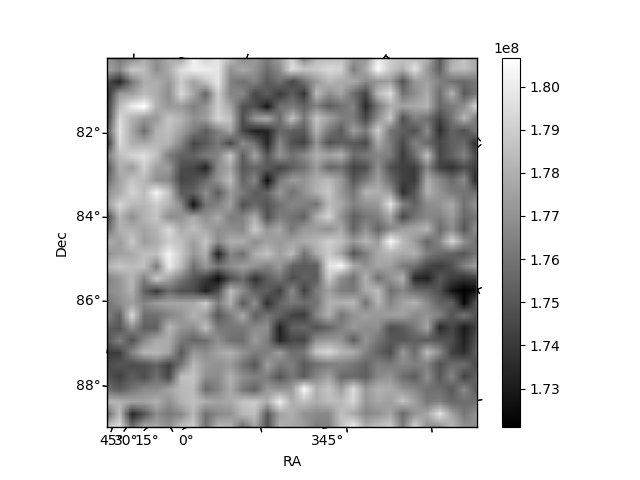
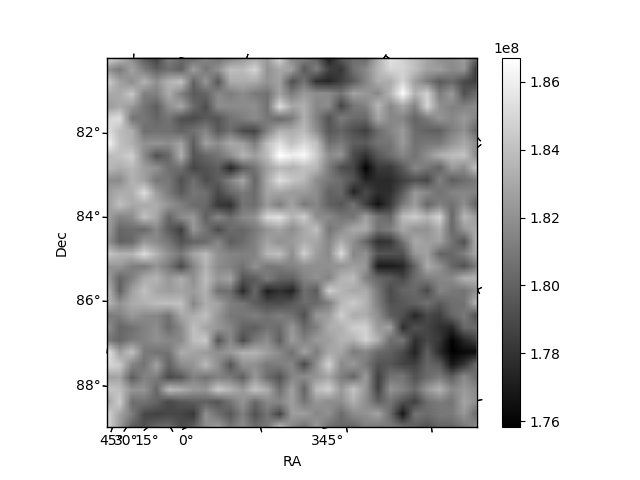
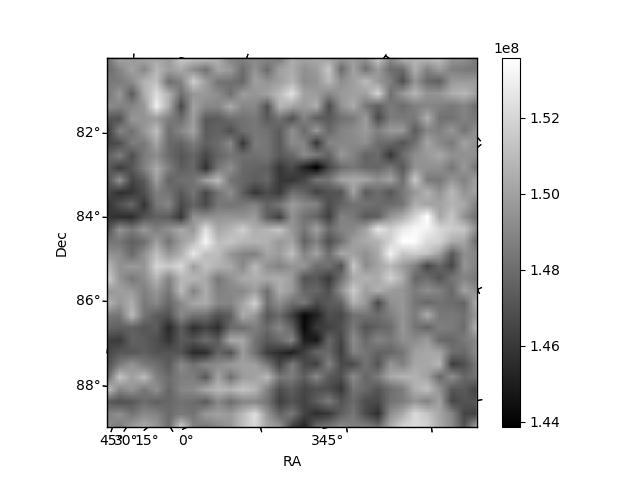
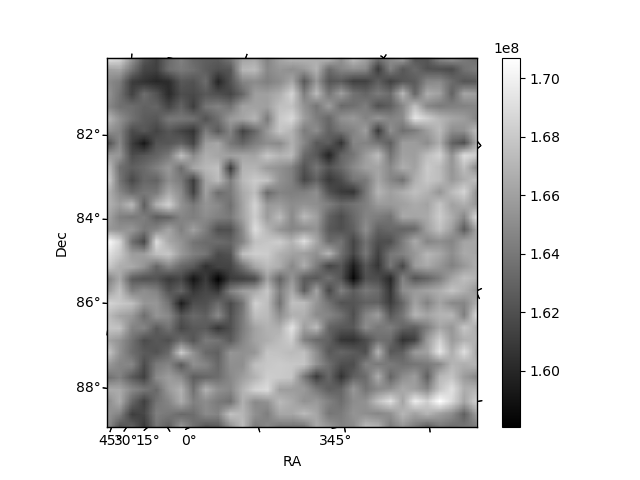
Histogram calculated using DETX and DETY for each event in the final _common_clean file
| Quadrant A | 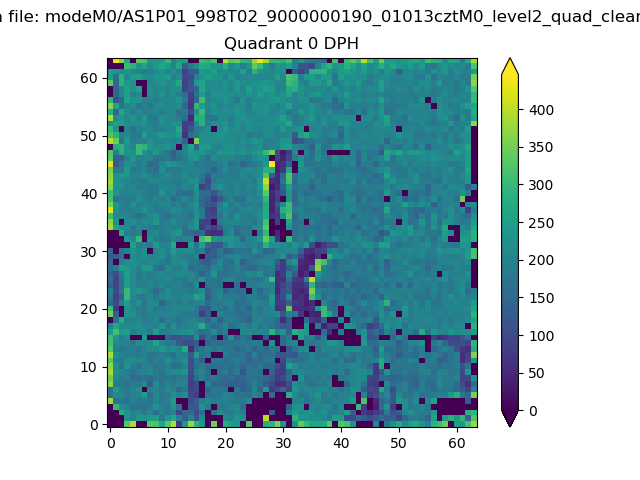 |
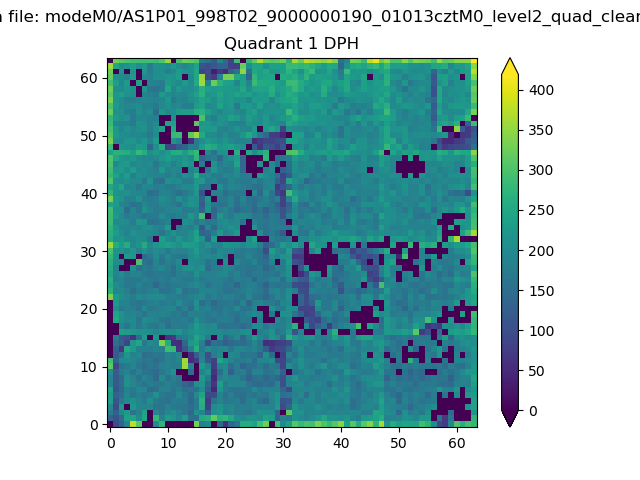 |
Quadrant B |
|---|---|---|---|
| Quadrant D | 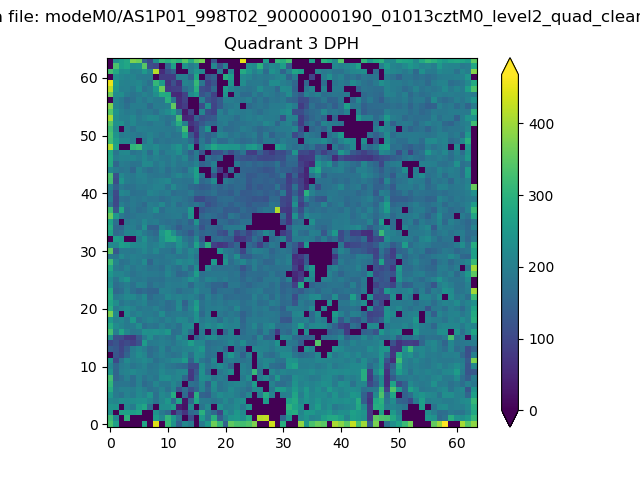 |
 |
Quadrant C |
| Plot type | Count rate plots | Images |
|---|---|---|
| Comparison with Poisson distribution Blue bars denote a histogram of data divided into 1 sec bins. Red curve is a Poisson curve with rate = median count rate of data. |
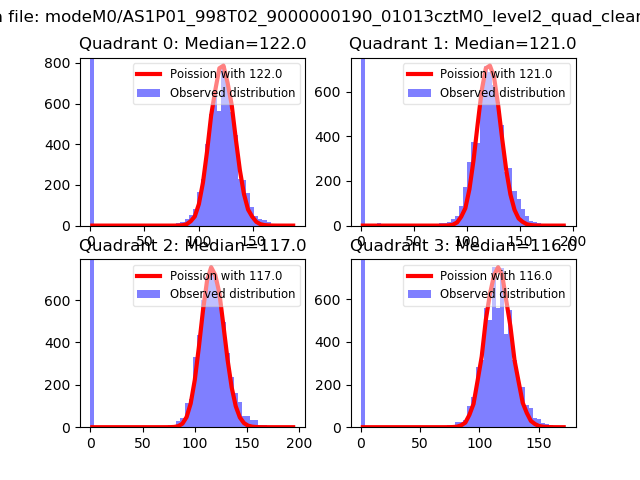 |
 |
| Quadrant-wise count rates Data is divided into 100 sec bins |
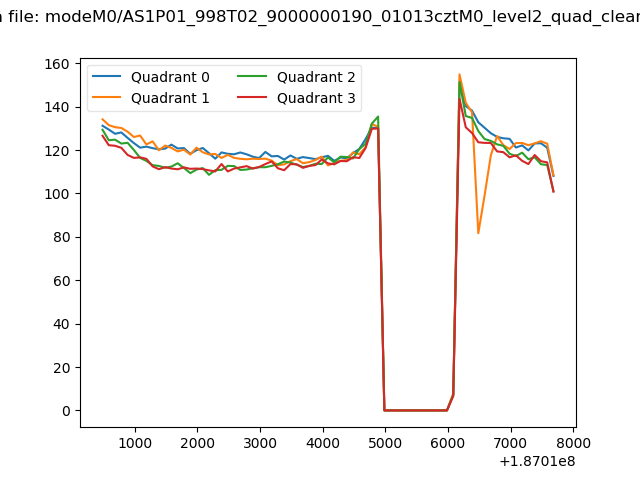 |
|
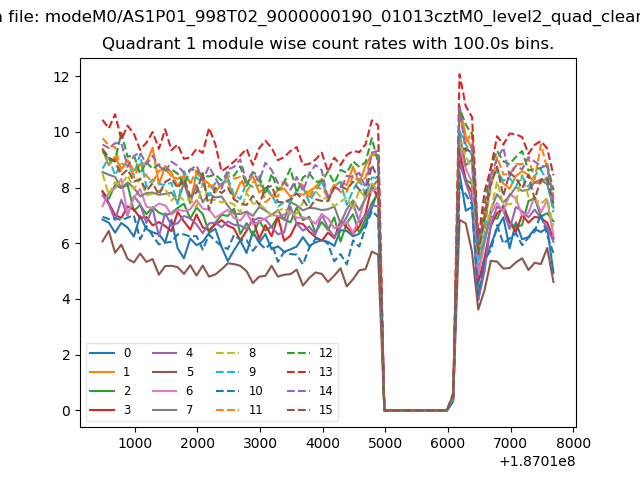
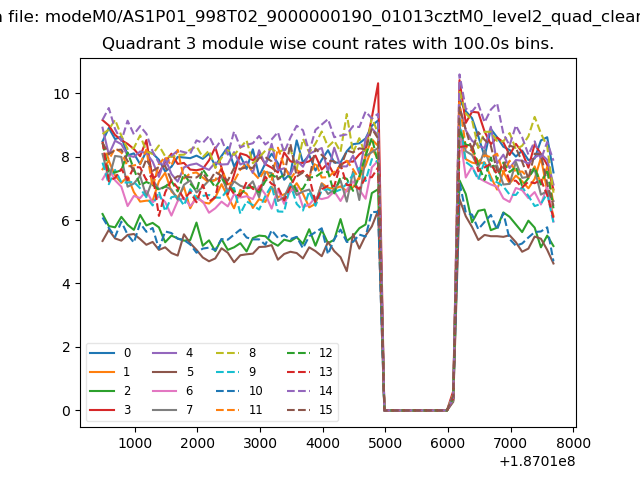
| Module-wise count rates for Quadrant A Data is divided into 100 sec bins |
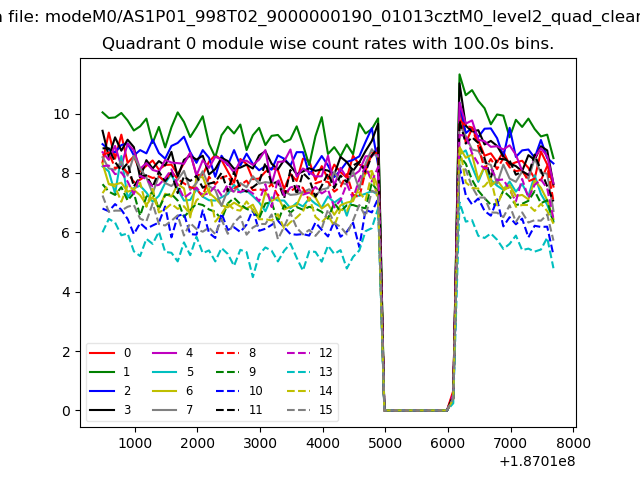 |
 |
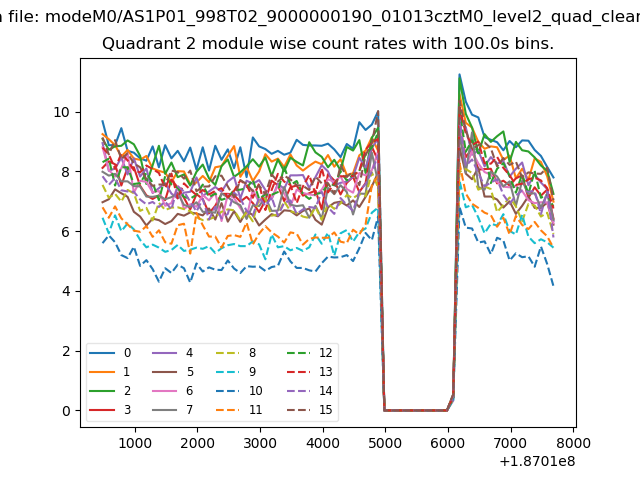
| Module-wise count rates for Quadrant B Data is divided into 100 sec bins |
 |
 |
| Module-wise count rates for Quadrant C Data is divided into 100 sec bins |
 |
 |
| Module-wise count rates for Quadrant D Data is divided into 100 sec bins |
 |
 |
| Parameter | Plot |
|---|---|
| CZT HV Monitor | 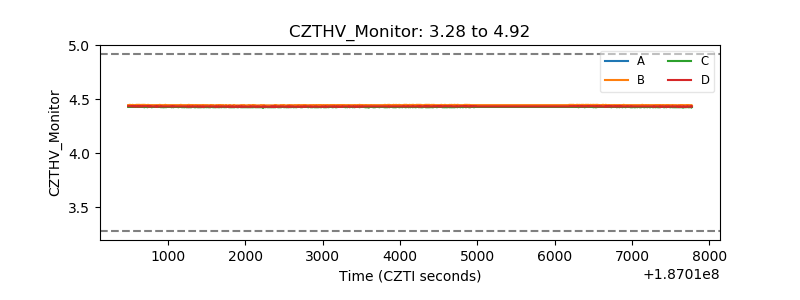 |
| D_VDD | 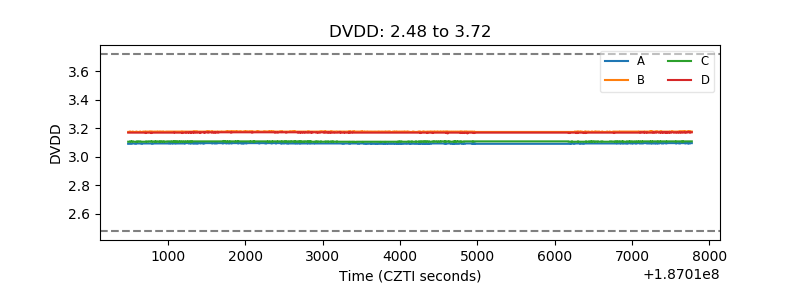 |
| Temperature 1 | 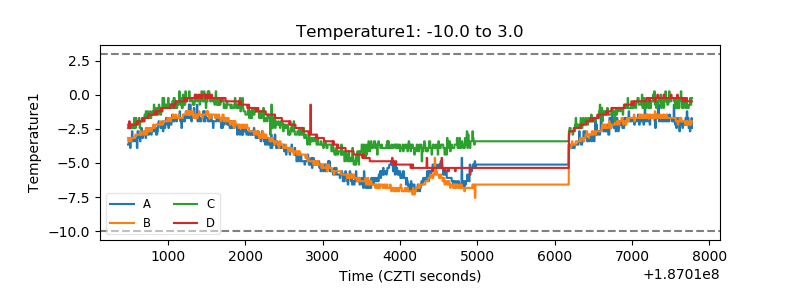 |
| Veto HV Monitor | 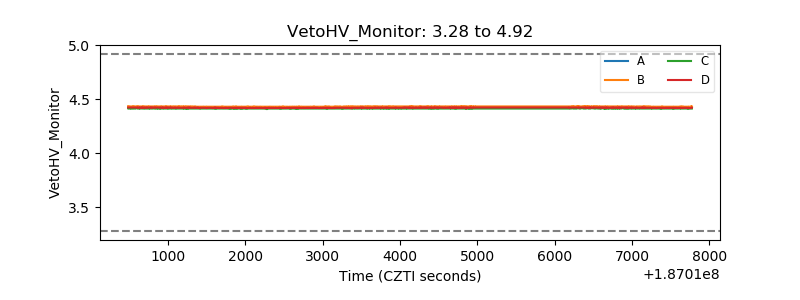 |
| Veto LLD | 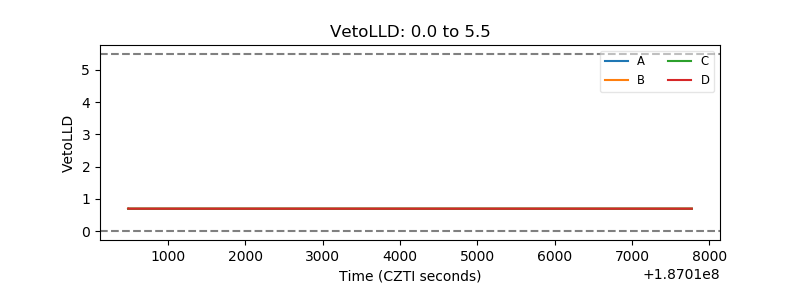 |
| Alpha Counter | 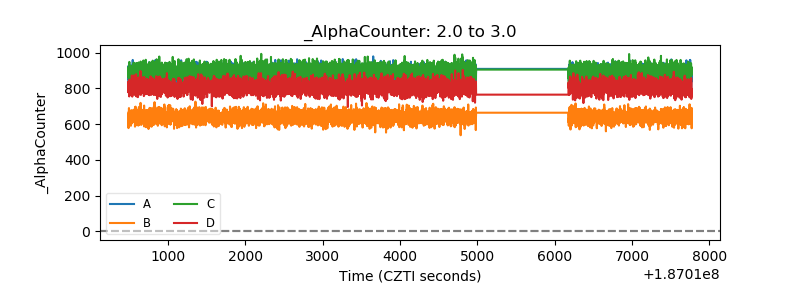 |
| _CPM_Rate | 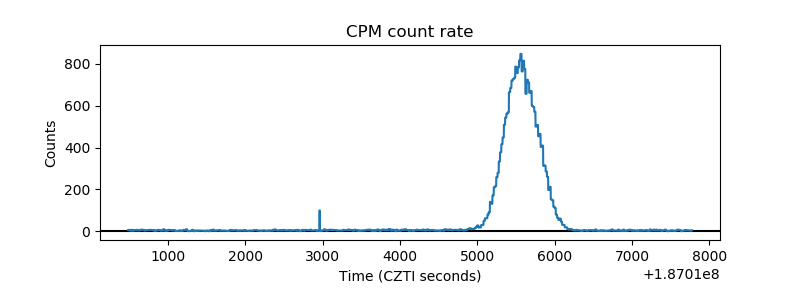 |
| CZT Counter | 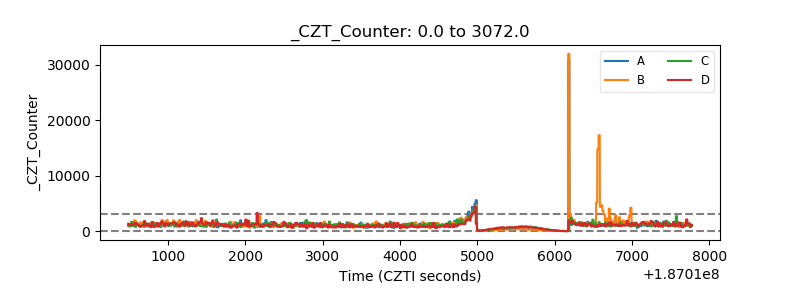 |
| +2.5 Volts monitor |  |
| +5 Volts monitor |  |
| _ROLL_ROT | 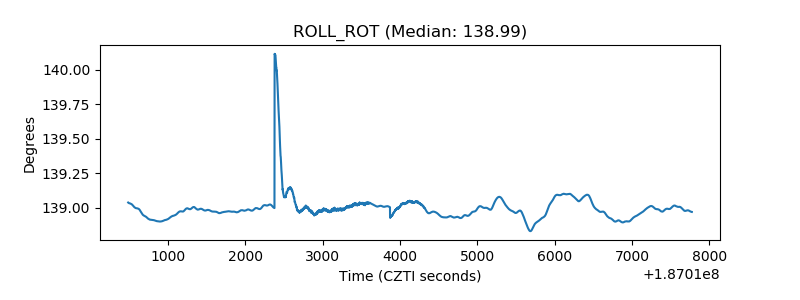 |
| _Roll_DEC | 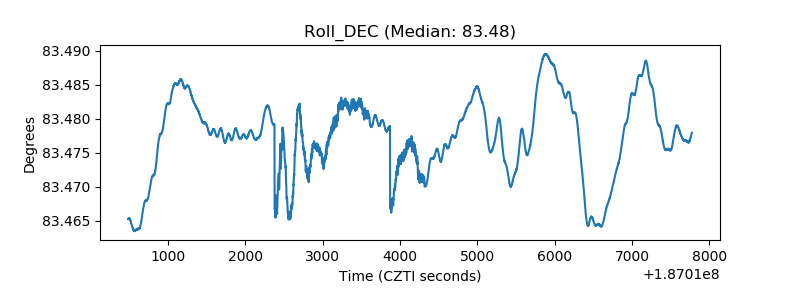 |
| _Roll_RA | 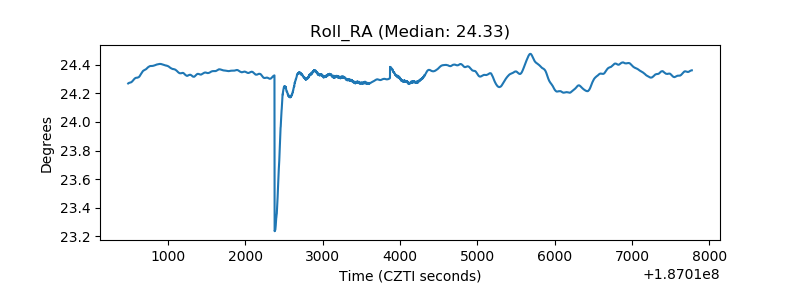 |
| Veto Counter | 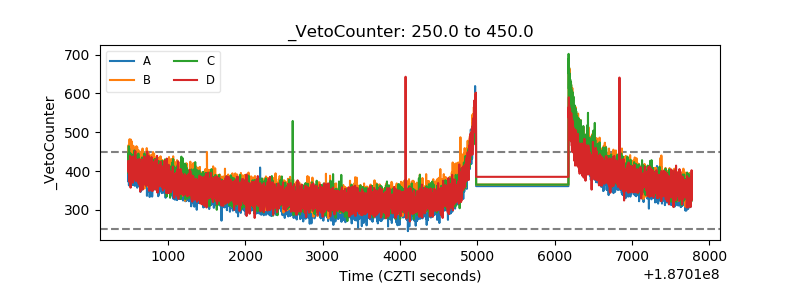 |