| Param | Original file | Final file |
|---|---|---|
| Filename | modeM0/AS1P01_998T02_9000000190_01014cztM0_level2.evt | modeM0/AS1P01_998T02_9000000190_01014cztM0_level2_quad_clean.evt |
| Size (bytes) | 1,018,768,320 | 112,109,760 |
| Size | 971.6 MB | 106.9 MB |
| Events in quadrant A | 7,439,017 | 755,558 |
| Events in quadrant B | 8,077,423 | 750,728 |
| Events in quadrant C | 7,685,655 | 727,525 |
| Events in quadrant D | 7,234,122 | 722,402 |
| Mode M0 | |||
|---|---|---|---|
| Quadrant | BADHDUFLAG | Total packets | Discarded packets |
| A | 0 | 26592 | 1 |
| B | 0 | 28435 | 1 |
| C | 0 | 27337 | 5 |
| D | 0 | 25967 | 1 |
| Mode SS | |||
|---|---|---|---|
| Quadrant | BADHDUFLAG | Total packets | Discarded packets |
| A | 0 | 128 | 0 |
| B | 0 | 128 | 0 |
| C | 0 | 128 | 0 |
| D | 0 | 128 | 0 |
| Mode M9 | |||
|---|---|---|---|
| Quadrant | BADHDUFLAG | Total packets | Discarded packets |
| A | 0 | 11 | 0 |
| B | 0 | 11 | 0 |
| C | 0 | 11 | 0 |
| D | 0 | 11 | 0 |
| Quadrant | Total seconds | Saturated seconds | Saturation percentage |
|---|---|---|---|
| A | 6293 | 59 | 0.937550% |
| B | 6293 | 103 | 1.636739% |
| C | 6292 | 70 | 1.112524% |
| D | 6293 | 49 | 0.778643% |
Noise dominated data is calculated using 1-second bins in cleaned event files. If a bin has >2000 counts, and if more than 50% of those come from <1% of pixels, then it is considered to be noise-dominated and hence unusable.
| Quadrant | # 1 sec bins | Bins with >0 counts | Bins with >2000 counts | High rate bins dominated by noise | Noise dominated (total time) | Noise dominated (detector-on time) | Marked lightcurve |
|---|---|---|---|---|---|---|---|
| A | 7398 | 6294 | 236 | 236 | 3.19% | 3.75% | 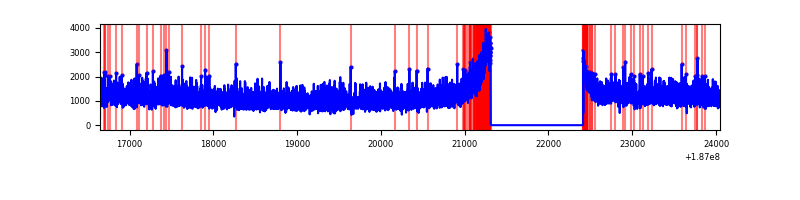 |
| B | 7398 | 6294 | 428 | 428 | 5.79% | 6.80% | 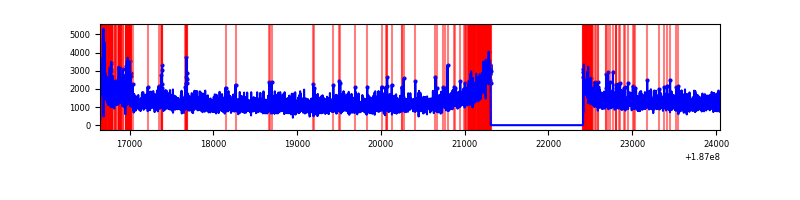 |
| C | 7397 | 6293 | 252 | 252 | 3.41% | 4.00% | 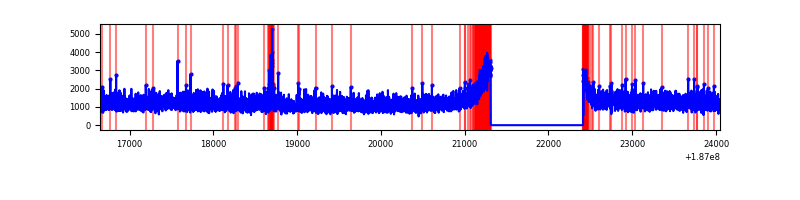 |
| D | 7398 | 6294 | 182 | 182 | 2.46% | 2.89% | 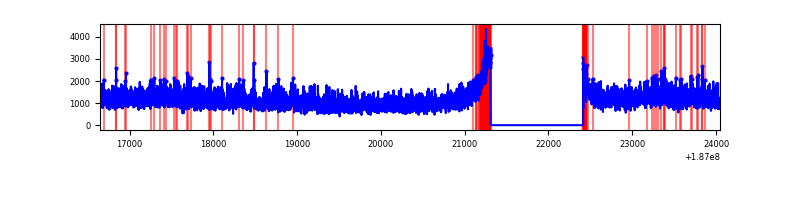 |
Top three noisy pixels from each quadrant. If the there are fewer than three noisy pixels in the level2.evt file, extra rows are filled as -1
| Pixel properties | Quadrant properties | ||||||
|---|---|---|---|---|---|---|---|
| Quadrant | DetID | PixID | Counts | Sigma | Mean | Median | Sigma |
| A | 12 | 189 | 8936 | 15.04 | 1936 | 1946 | 464.8 |
| A | 15 | 233 | 6696 | 10.22 | 1936 | 1946 | 464.8 |
| A | 11 | 79 | 6528 | 9.86 | 1936 | 1946 | 464.8 |
| B | 4 | 200 | 277761 | 586.77 | 1992 | 1998 | 470.0 |
| B | 5 | 249 | 38701 | 78.1 | 1992 | 1998 | 470.0 |
| B | 15 | 22 | 37255 | 75.02 | 1992 | 1998 | 470.0 |
| C | 15 | 241 | 312055 | 604.46 | 1851 | 1915 | 513.1 |
| C | 5 | 234 | 57977 | 109.27 | 1851 | 1915 | 513.1 |
| C | 3 | 79 | 31060 | 56.8 | 1851 | 1915 | 513.1 |
| D | 1 | 4 | 411668 | 739.22 | 1810 | 1873 | 554.4 |
| D | 9 | 49 | 33306 | 56.7 | 1810 | 1873 | 554.4 |
| D | 12 | 16 | 18981 | 30.86 | 1810 | 1873 | 554.4 |
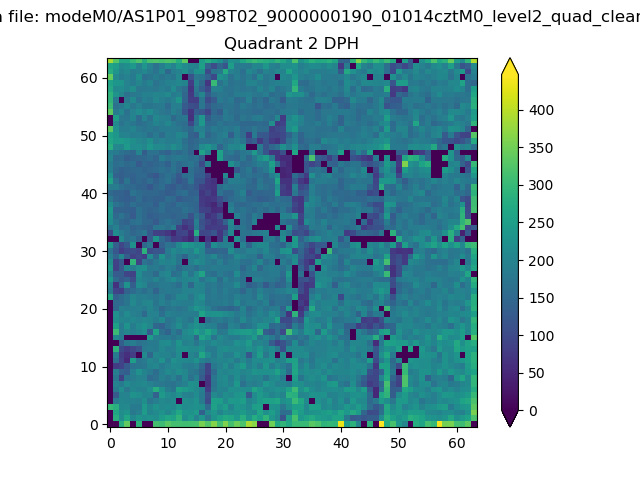
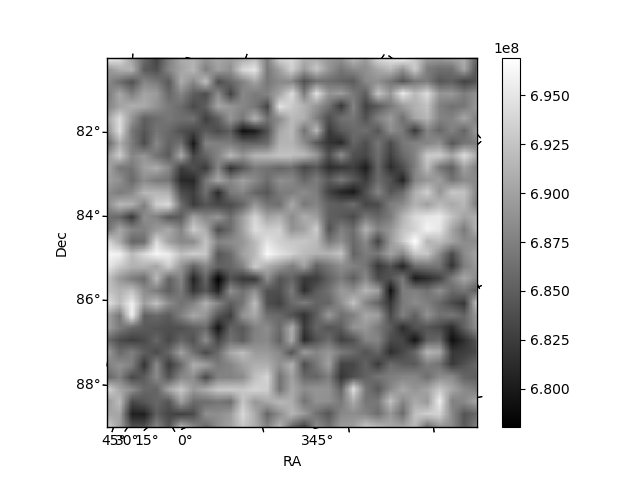
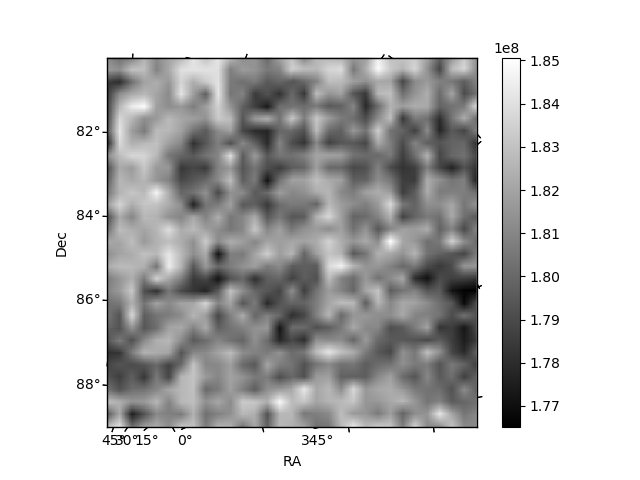
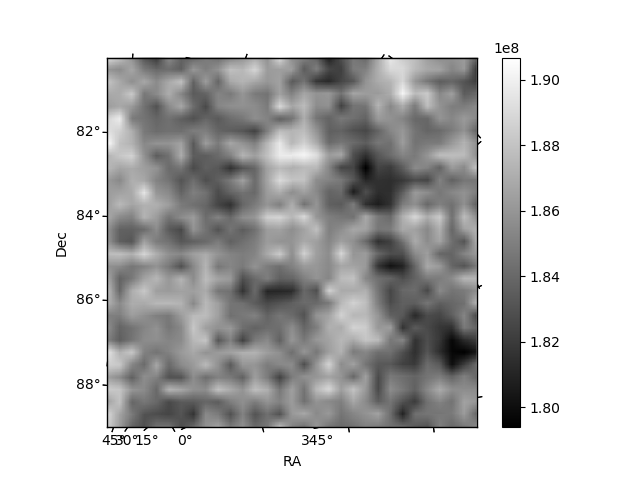
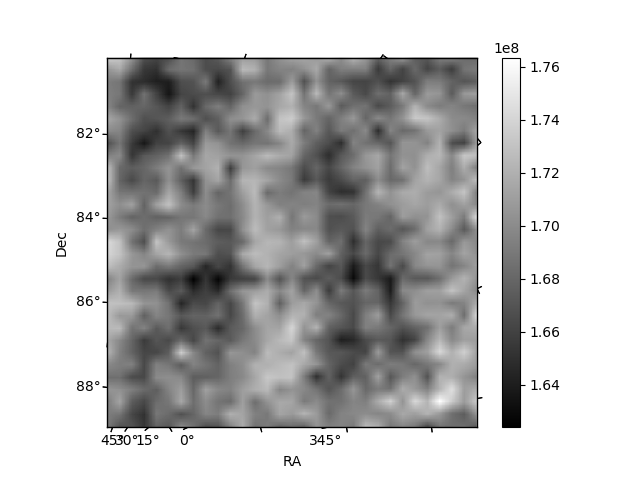
Histogram calculated using DETX and DETY for each event in the final _common_clean file
| Quadrant A | 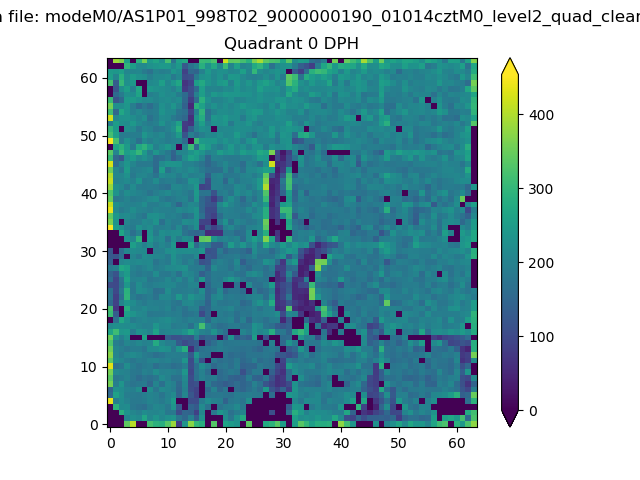 |
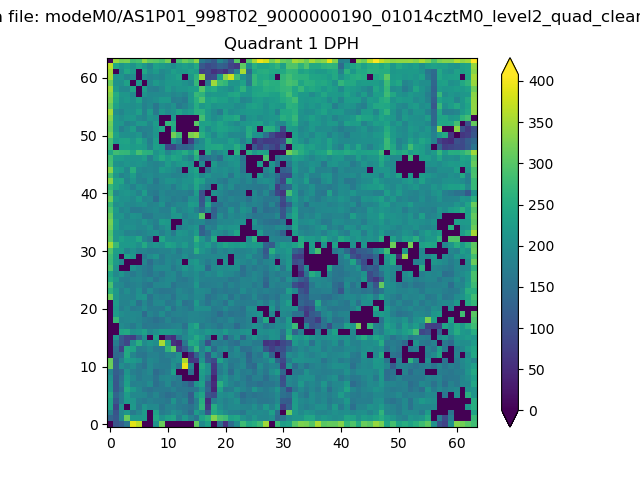 |
Quadrant B |
|---|---|---|---|
| Quadrant D | 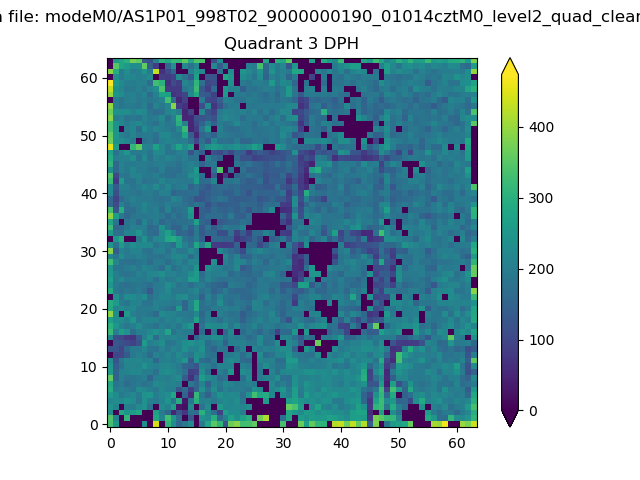 |
 |
Quadrant C |
| Plot type | Count rate plots | Images |
|---|---|---|
| Comparison with Poisson distribution Blue bars denote a histogram of data divided into 1 sec bins. Red curve is a Poisson curve with rate = median count rate of data. |
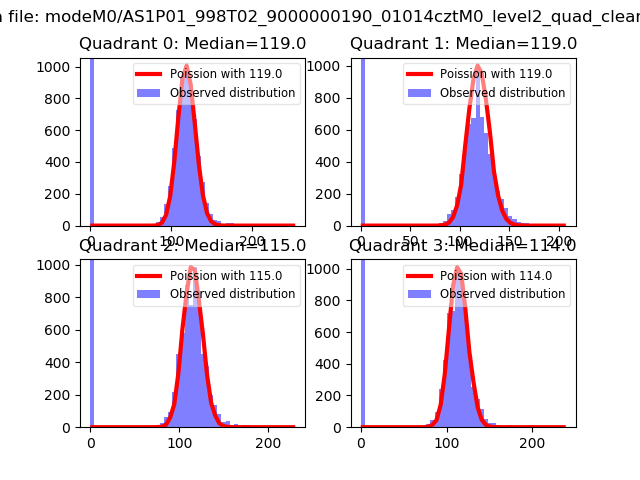 |
 |
| Quadrant-wise count rates Data is divided into 100 sec bins |
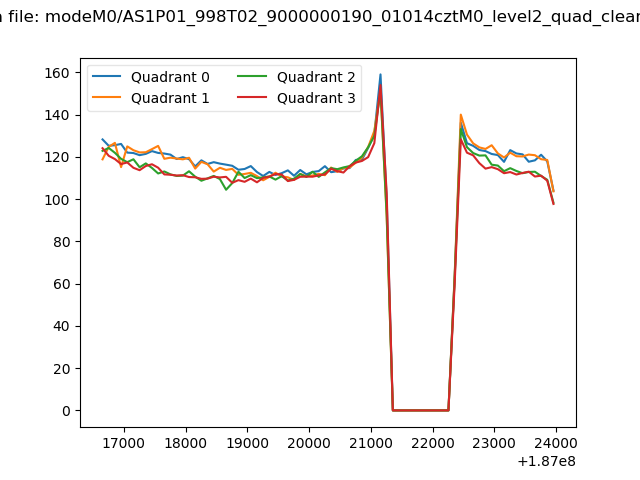 |
|
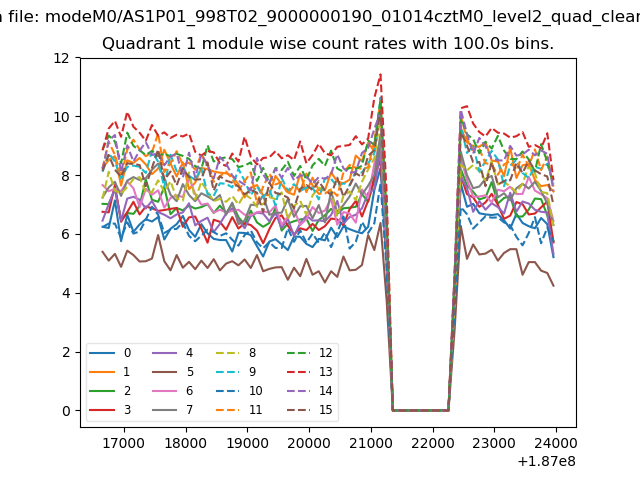
| Module-wise count rates for Quadrant A Data is divided into 100 sec bins |
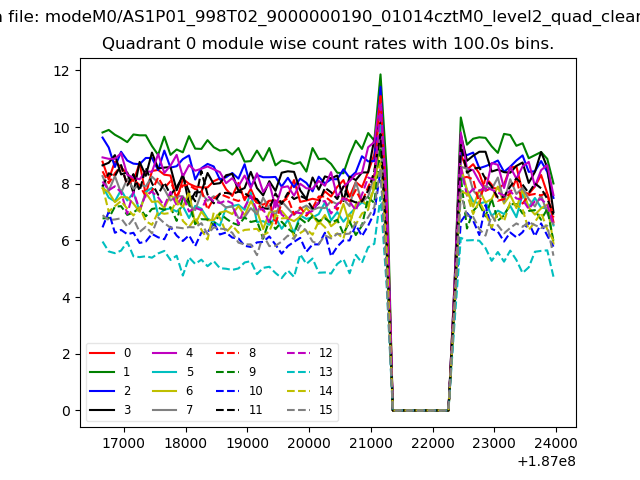 |
 |
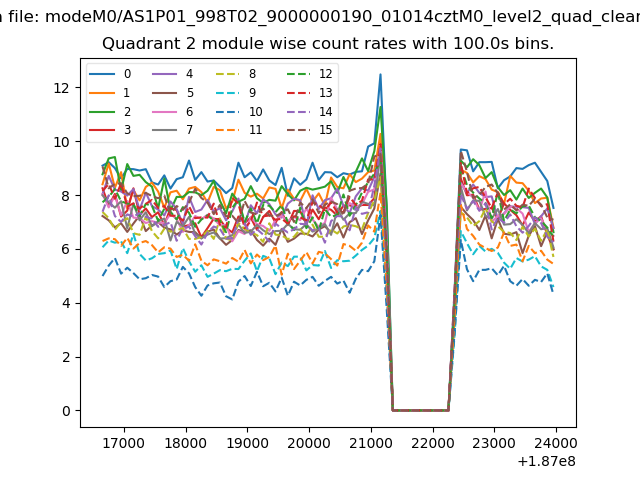
| Module-wise count rates for Quadrant B Data is divided into 100 sec bins |
 |
 |
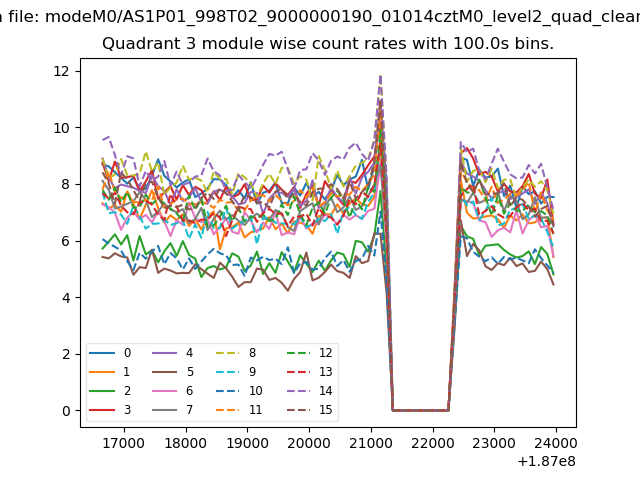
| Module-wise count rates for Quadrant C Data is divided into 100 sec bins |
 |
 |
| Module-wise count rates for Quadrant D Data is divided into 100 sec bins |
 |
 |
| Parameter | Plot |
|---|---|
| CZT HV Monitor | 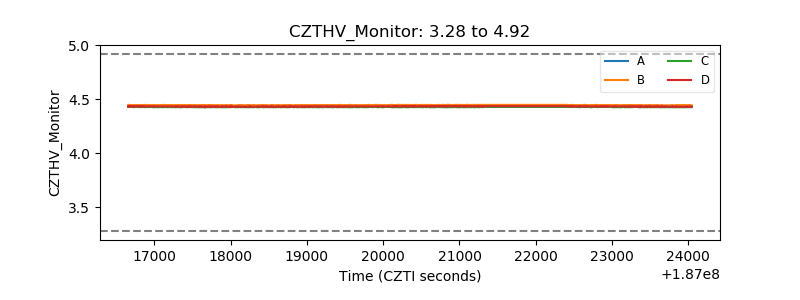 |
| D_VDD |  |
| Temperature 1 | 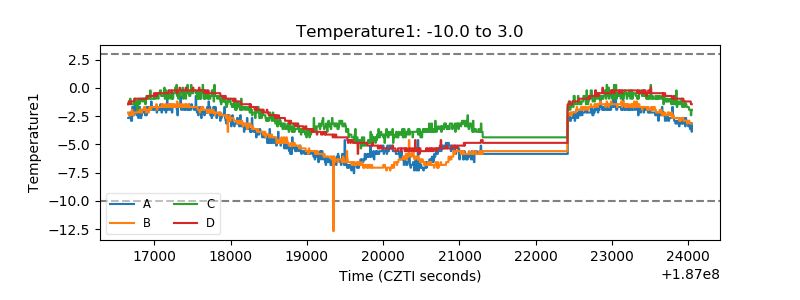 |
| Veto HV Monitor | 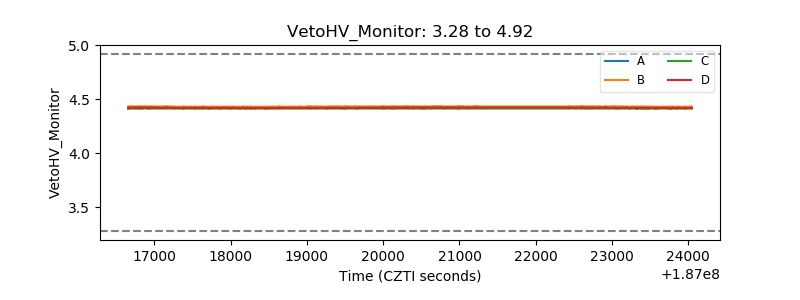 |
| Veto LLD | 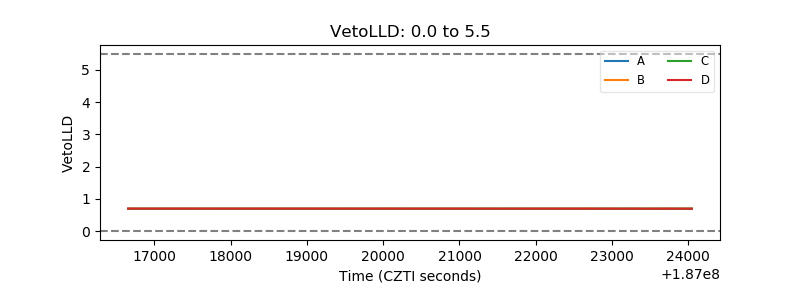 |
| Alpha Counter | 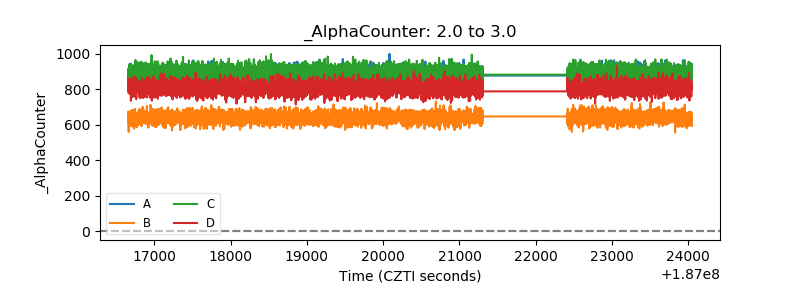 |
| _CPM_Rate | 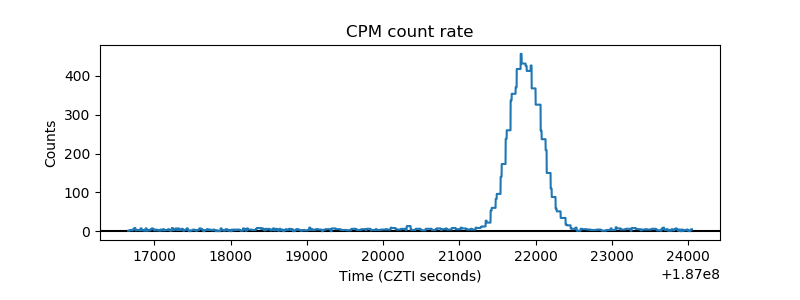 |
| CZT Counter | 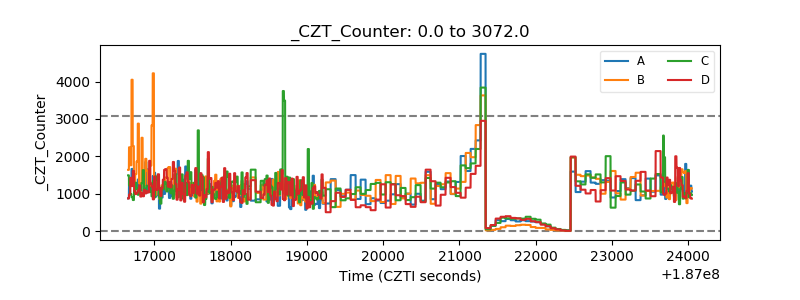 |
| +2.5 Volts monitor |  |
| +5 Volts monitor |  |
| _ROLL_ROT | 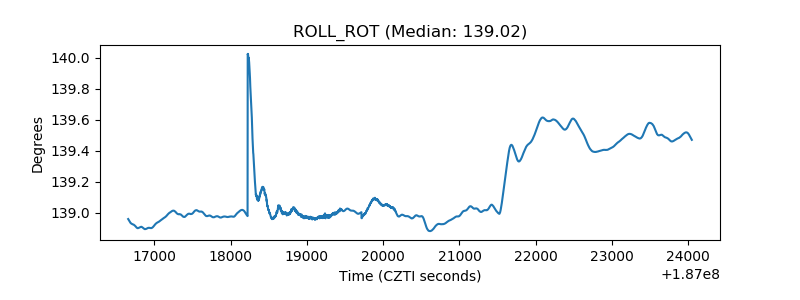 |
| _Roll_DEC | 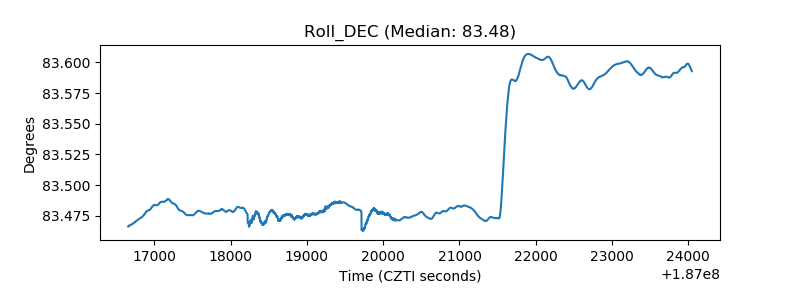 |
| _Roll_RA | 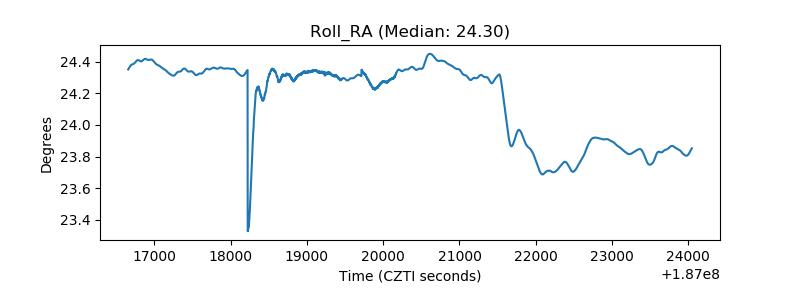 |
| Veto Counter | 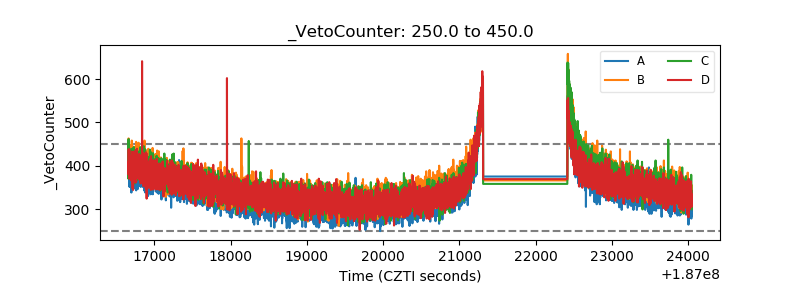 |