| Param | Original file | Final file |
|---|---|---|
| Filename | modeM0/AS1P01_998T02_9000000190_01015cztM0_level2.evt | modeM0/AS1P01_998T02_9000000190_01015cztM0_level2_quad_clean.evt |
| Size (bytes) | 1,046,678,400 | 111,432,960 |
| Size | 998.2 MB | 106.3 MB |
| Events in quadrant A | 7,451,721 | 747,373 |
| Events in quadrant B | 7,896,974 | 747,911 |
| Events in quadrant C | 7,640,739 | 724,727 |
| Events in quadrant D | 8,282,291 | 705,693 |
| Mode M0 | |||
|---|---|---|---|
| Quadrant | BADHDUFLAG | Total packets | Discarded packets |
| A | 0 | 26719 | 1 |
| B | 0 | 28012 | 1 |
| C | 0 | 27270 | 1 |
| D | 0 | 29193 | 5 |
| Mode SS | |||
|---|---|---|---|
| Quadrant | BADHDUFLAG | Total packets | Discarded packets |
| A | 0 | 130 | 0 |
| B | 0 | 130 | 0 |
| C | 0 | 130 | 0 |
| D | 0 | 130 | 0 |
| Mode M9 | |||
|---|---|---|---|
| Quadrant | BADHDUFLAG | Total packets | Discarded packets |
| A | 0 | 10 | 0 |
| B | 0 | 10 | 0 |
| C | 0 | 10 | 0 |
| D | 0 | 10 | 0 |
| Quadrant | Total seconds | Saturated seconds | Saturation percentage |
|---|---|---|---|
| A | 6442 | 8 | 0.124185% |
| B | 6442 | 8 | 0.124185% |
| C | 6442 | 10 | 0.155231% |
| D | 6441 | 198 | 3.074057% |
Noise dominated data is calculated using 1-second bins in cleaned event files. If a bin has >2000 counts, and if more than 50% of those come from <1% of pixels, then it is considered to be noise-dominated and hence unusable.
| Quadrant | # 1 sec bins | Bins with >0 counts | Bins with >2000 counts | High rate bins dominated by noise | Noise dominated (total time) | Noise dominated (detector-on time) | Marked lightcurve |
|---|---|---|---|---|---|---|---|
| A | 7407 | 6443 | 185 | 185 | 2.50% | 2.87% | 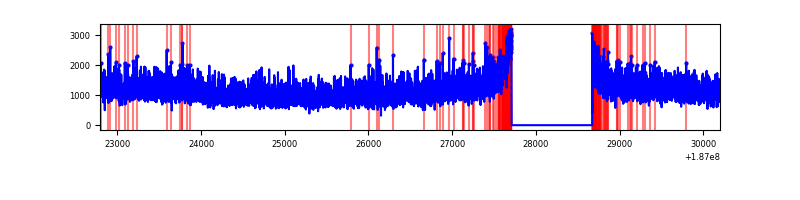 |
| B | 7407 | 6443 | 222 | 222 | 3.00% | 3.45% | 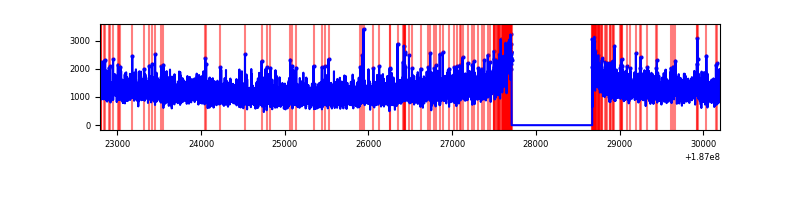 |
| C | 7407 | 6443 | 174 | 174 | 2.35% | 2.70% | 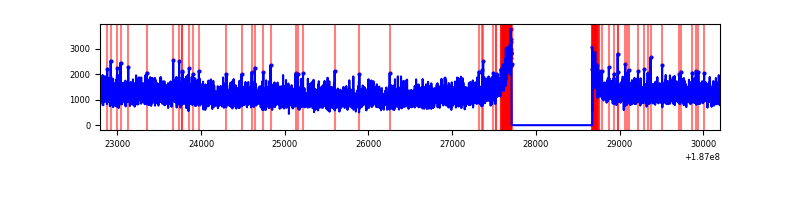 |
| D | 7406 | 6442 | 533 | 533 | 7.20% | 8.27% | 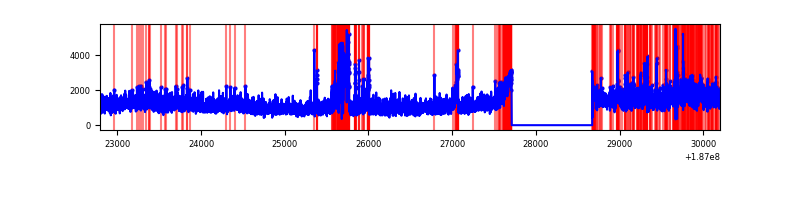 |
Top three noisy pixels from each quadrant. If the there are fewer than three noisy pixels in the level2.evt file, extra rows are filled as -1
| Pixel properties | Quadrant properties | ||||||
|---|---|---|---|---|---|---|---|
| Quadrant | DetID | PixID | Counts | Sigma | Mean | Median | Sigma |
| A | 12 | 189 | 10614 | 18.63 | 1939 | 1946 | 465.2 |
| A | 11 | 79 | 10496 | 18.38 | 1939 | 1946 | 465.2 |
| A | 3 | 111 | 5773 | 8.23 | 1939 | 1946 | 465.2 |
| B | 15 | 22 | 47511 | 96.91 | 2008 | 2012 | 469.5 |
| B | 0 | 151 | 42359 | 85.94 | 2008 | 2012 | 469.5 |
| B | 8 | 234 | 31997 | 63.87 | 2008 | 2012 | 469.5 |
| C | 15 | 241 | 321824 | 626.0 | 1851 | 1915 | 511.0 |
| C | 3 | 79 | 33565 | 61.93 | 1851 | 1915 | 511.0 |
| C | 3 | 111 | 29992 | 54.94 | 1851 | 1915 | 511.0 |
| D | 1 | 4 | 805312 | 1510.69 | 1799 | 1858 | 531.8 |
| D | 9 | 64 | 571566 | 1071.19 | 1799 | 1858 | 531.8 |
| D | 10 | 102 | 51796 | 93.9 | 1799 | 1858 | 531.8 |
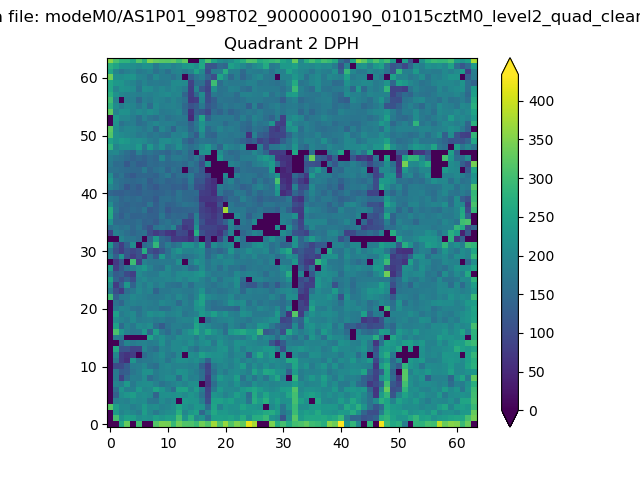
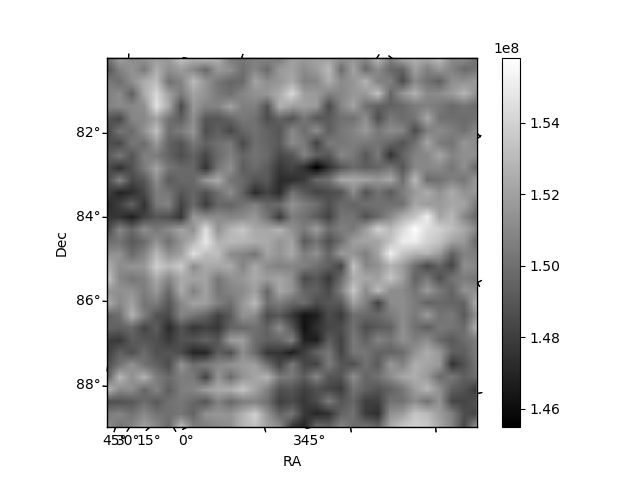
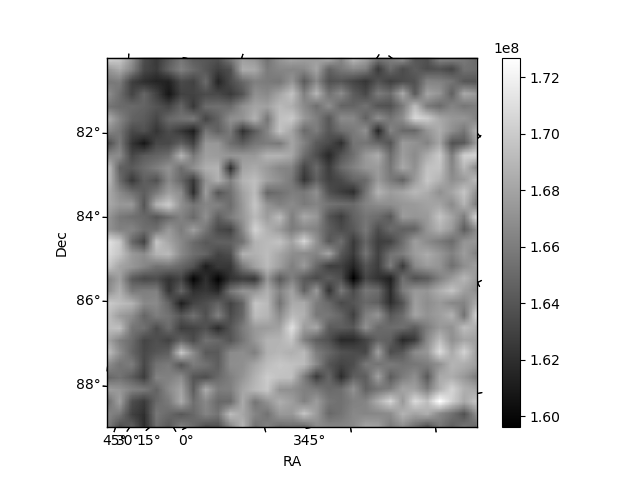
Histogram calculated using DETX and DETY for each event in the final _common_clean file
| Quadrant A | 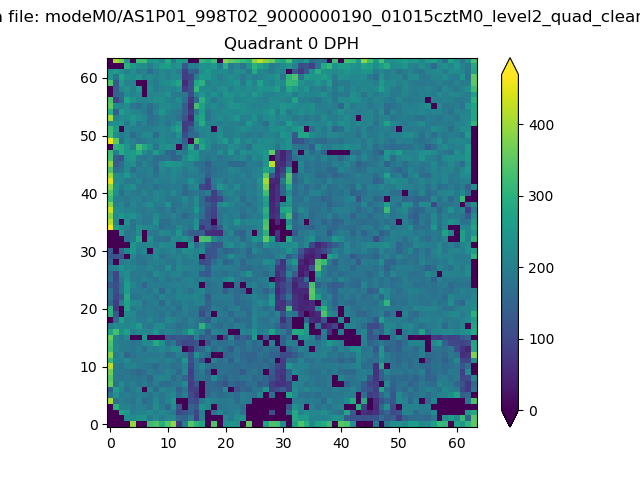 |
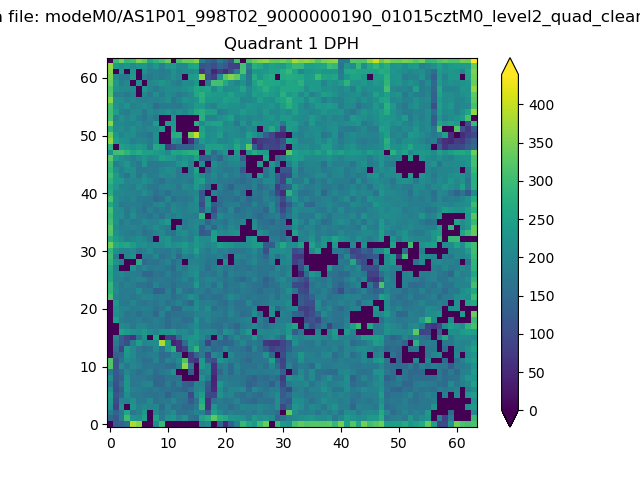 |
Quadrant B |
|---|---|---|---|
| Quadrant D | 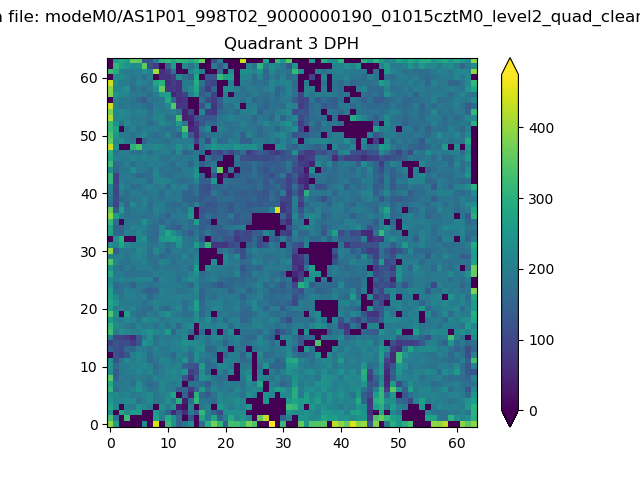 |
 |
Quadrant C |
| Plot type | Count rate plots | Images |
|---|---|---|
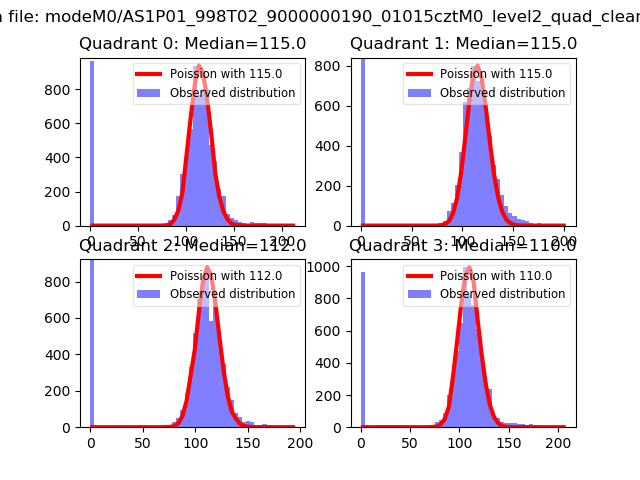
| Comparison with Poisson distribution Blue bars denote a histogram of data divided into 1 sec bins. Red curve is a Poisson curve with rate = median count rate of data. |
 |
 |
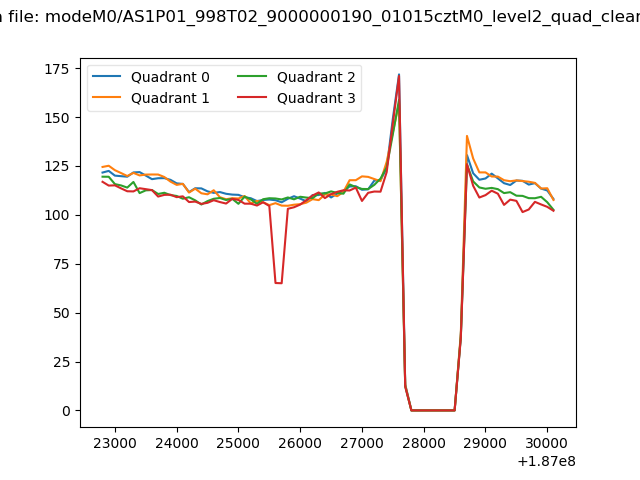
| Quadrant-wise count rates Data is divided into 100 sec bins |
 |
|
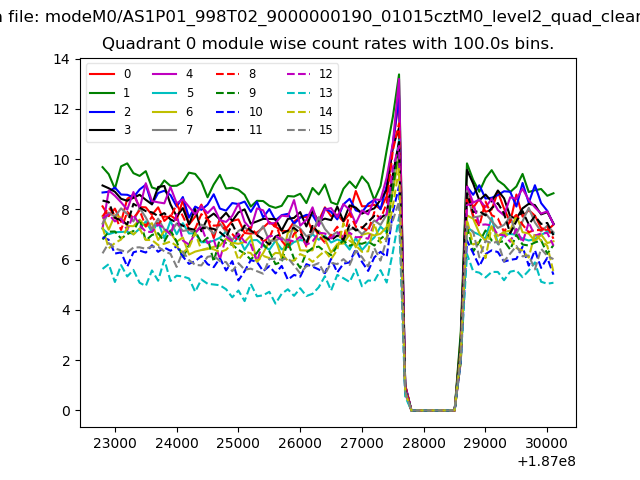
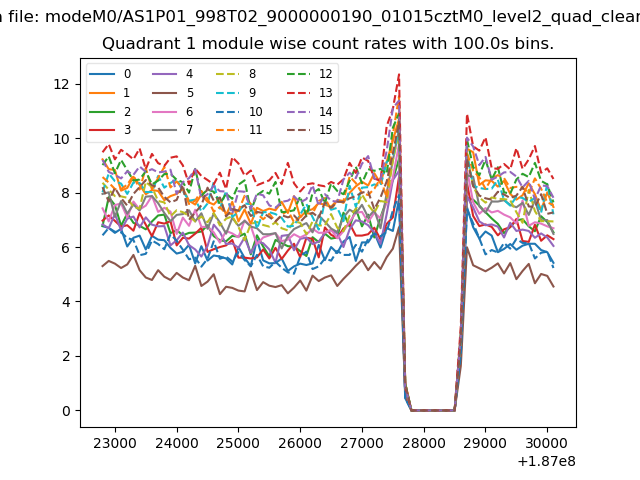
| Module-wise count rates for Quadrant A Data is divided into 100 sec bins |
 |
 |
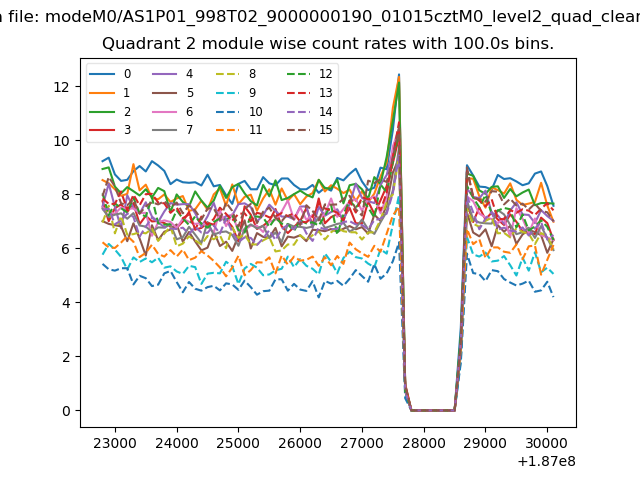
| Module-wise count rates for Quadrant B Data is divided into 100 sec bins |
 |
 |
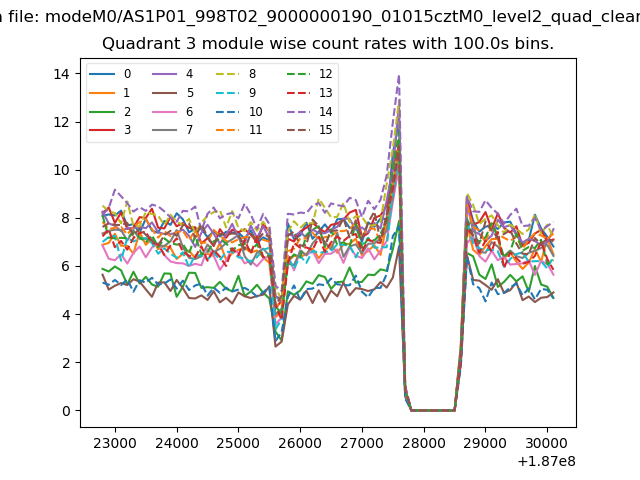
| Module-wise count rates for Quadrant C Data is divided into 100 sec bins |
 |
 |
| Module-wise count rates for Quadrant D Data is divided into 100 sec bins |
 |
 |
| Parameter | Plot |
|---|---|
| CZT HV Monitor | 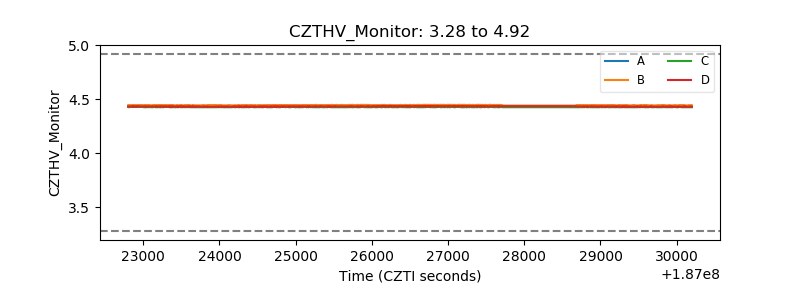 |
| D_VDD | 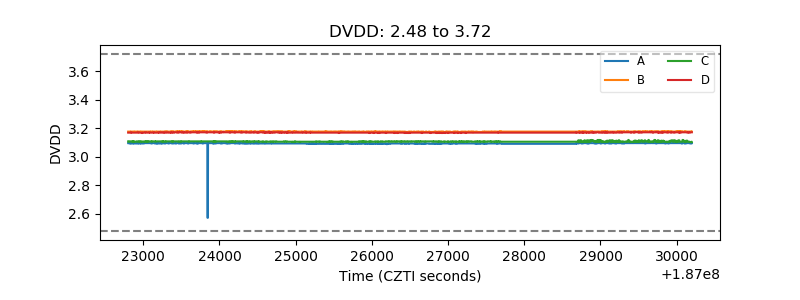 |
| Temperature 1 | 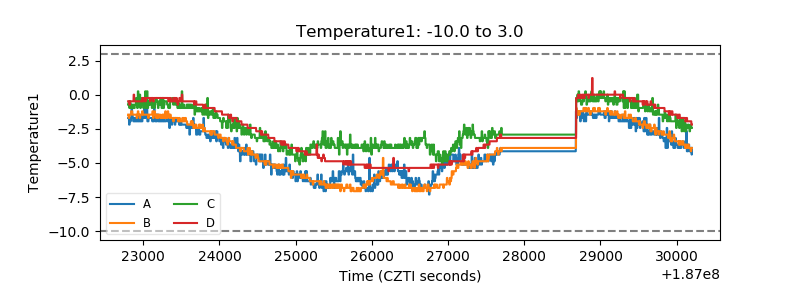 |
| Veto HV Monitor | 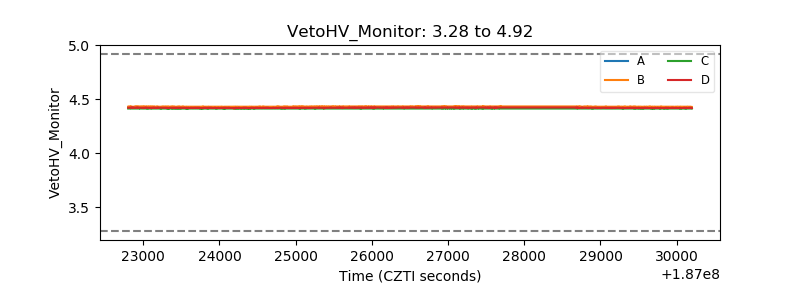 |
| Veto LLD | 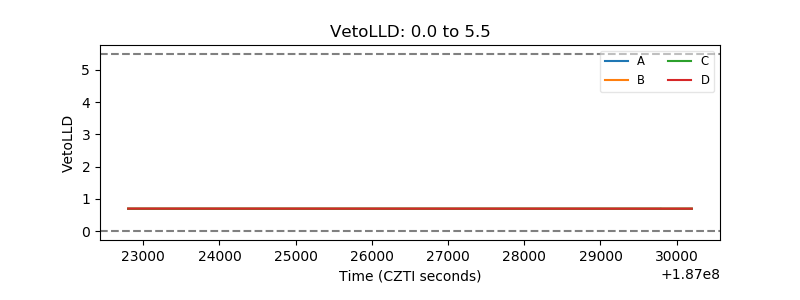 |
| Alpha Counter | 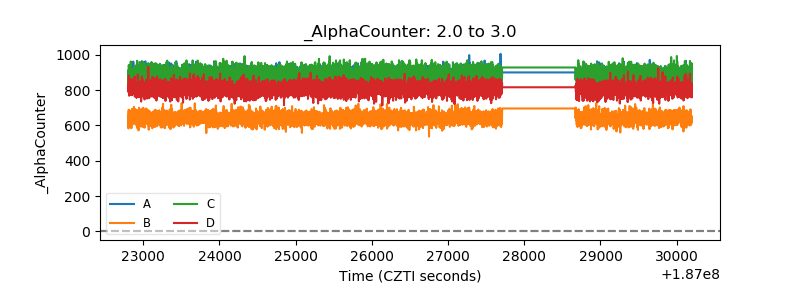 |
| _CPM_Rate | 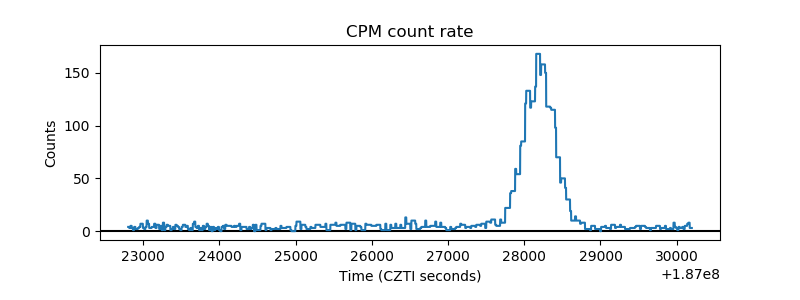 |
| CZT Counter | 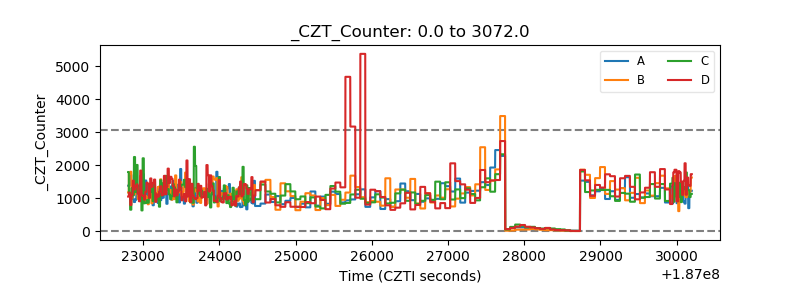 |
| +2.5 Volts monitor | 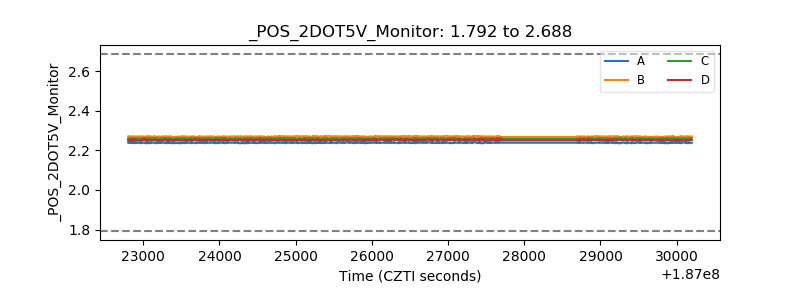 |
| +5 Volts monitor |  |
| _ROLL_ROT | 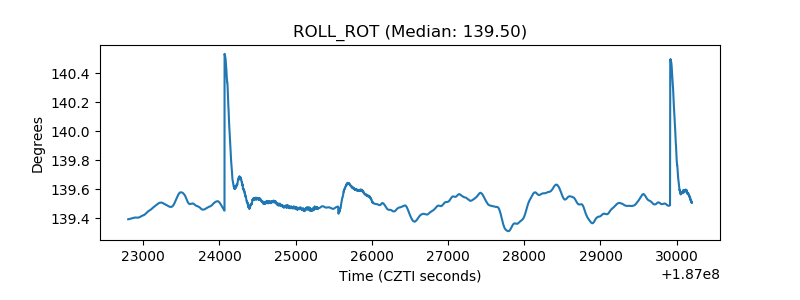 |
| _Roll_DEC | 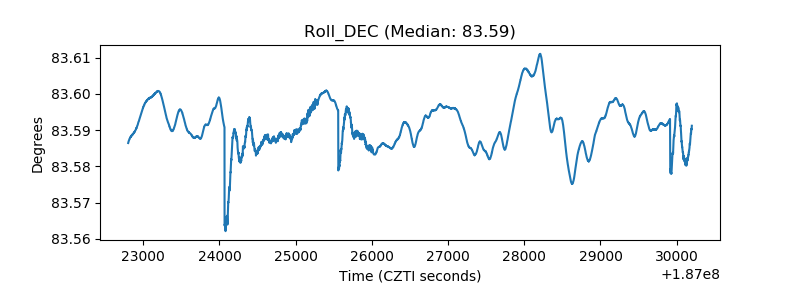 |
| _Roll_RA | 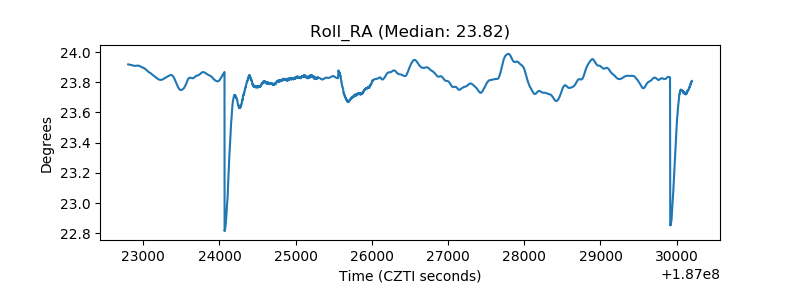 |
| Veto Counter | 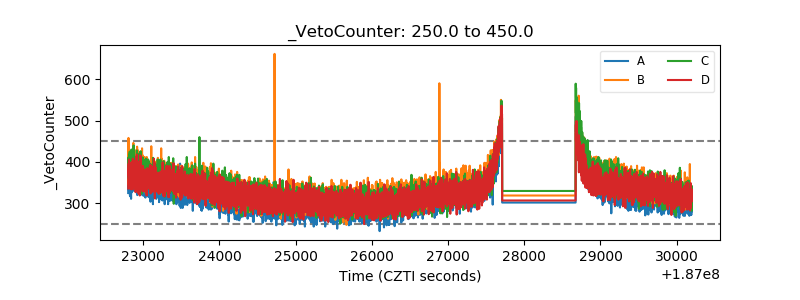 |