| Param | Original file | Final file |
|---|---|---|
| Filename | modeM0/AS1P01_998T02_9000000190_01017cztM0_level2.evt | modeM0/AS1P01_998T02_9000000190_01017cztM0_level2_quad_clean.evt |
| Size (bytes) | 1,212,842,880 | 127,952,640 |
| Size | 1.1 GB | 122.0 MB |
| Events in quadrant A | 8,981,571 | 850,605 |
| Events in quadrant B | 9,747,079 | 852,387 |
| Events in quadrant C | 9,204,677 | 830,006 |
| Events in quadrant D | 8,297,439 | 816,916 |
| Mode M0 | |||
|---|---|---|---|
| Quadrant | BADHDUFLAG | Total packets | Discarded packets |
| A | 0 | 32057 | 2 |
| B | 0 | 34375 | 2 |
| C | 0 | 32668 | 4 |
| D | 0 | 30059 | 2 |
| Mode SS | |||
|---|---|---|---|
| Quadrant | BADHDUFLAG | Total packets | Discarded packets |
| A | 0 | 154 | 0 |
| B | 0 | 154 | 0 |
| C | 0 | 154 | 0 |
| D | 0 | 154 | 0 |
| Mode M9 | |||
|---|---|---|---|
| Quadrant | BADHDUFLAG | Total packets | Discarded packets |
| A | 0 | 3 | 0 |
| B | 0 | 3 | 0 |
| C | 0 | 3 | 0 |
| D | 0 | 3 | 0 |
| Quadrant | Total seconds | Saturated seconds | Saturation percentage |
|---|---|---|---|
| A | 7559 | 5 | 0.066146% |
| B | 7559 | 31 | 0.410107% |
| C | 7558 | 22 | 0.291082% |
| D | 7558 | 29 | 0.383699% |
Noise dominated data is calculated using 1-second bins in cleaned event files. If a bin has >2000 counts, and if more than 50% of those come from <1% of pixels, then it is considered to be noise-dominated and hence unusable.
| Quadrant | # 1 sec bins | Bins with >0 counts | Bins with >2000 counts | High rate bins dominated by noise | Noise dominated (total time) | Noise dominated (detector-on time) | Marked lightcurve |
|---|---|---|---|---|---|---|---|
| A | 7794 | 7561 | 331 | 331 | 4.25% | 4.38% | 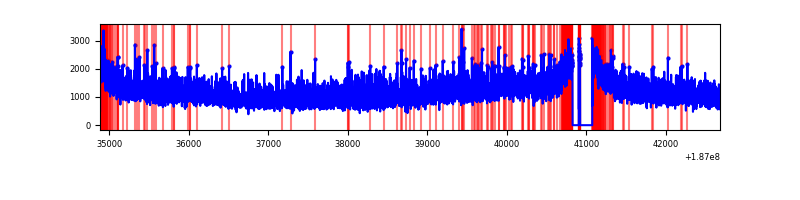 |
| B | 7794 | 7561 | 441 | 441 | 5.66% | 5.83% |  |
| C | 7793 | 7560 | 350 | 350 | 4.49% | 4.63% | 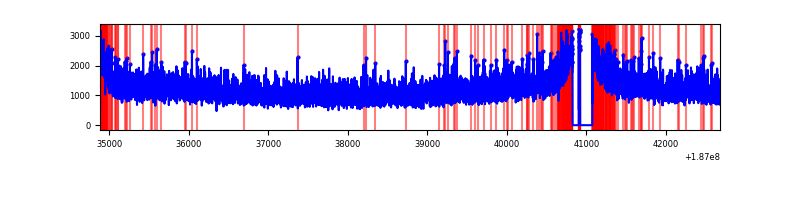 |
| D | 7793 | 7560 | 249 | 249 | 3.20% | 3.29% |  |
Top three noisy pixels from each quadrant. If the there are fewer than three noisy pixels in the level2.evt file, extra rows are filled as -1
| Pixel properties | Quadrant properties | ||||||
|---|---|---|---|---|---|---|---|
| Quadrant | DetID | PixID | Counts | Sigma | Mean | Median | Sigma |
| A | 0 | 231 | 17696 | 27.22 | 2331 | 2342 | 564.0 |
| A | 12 | 189 | 10386 | 14.26 | 2331 | 2342 | 564.0 |
| A | 11 | 79 | 10107 | 13.77 | 2331 | 2342 | 564.0 |
| B | 15 | 185 | 118509 | 201.59 | 2437 | 2444 | 575.8 |
| B | 8 | 234 | 85306 | 143.92 | 2437 | 2444 | 575.8 |
| B | 0 | 151 | 80268 | 135.17 | 2437 | 2444 | 575.8 |
| C | 15 | 241 | 387870 | 621.38 | 2238 | 2318 | 620.5 |
| C | 3 | 79 | 36734 | 55.47 | 2238 | 2318 | 620.5 |
| C | 3 | 111 | 34485 | 51.84 | 2238 | 2318 | 620.5 |
| D | 13 | 73 | 60278 | 86.84 | 2180 | 2255 | 668.2 |
| D | 9 | 49 | 31844 | 44.28 | 2180 | 2255 | 668.2 |
| D | 10 | 102 | 20828 | 27.8 | 2180 | 2255 | 668.2 |
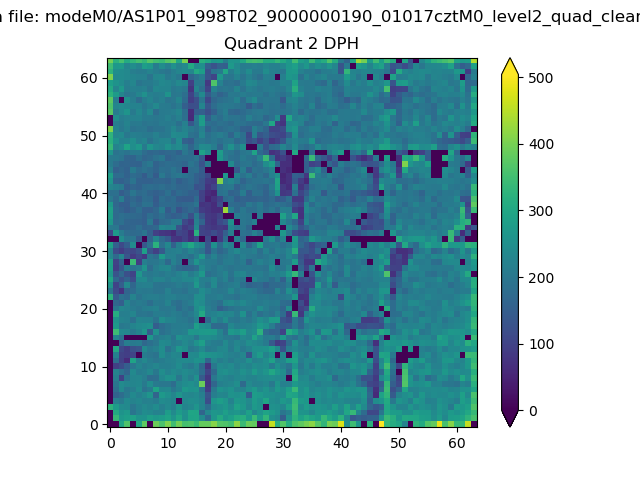
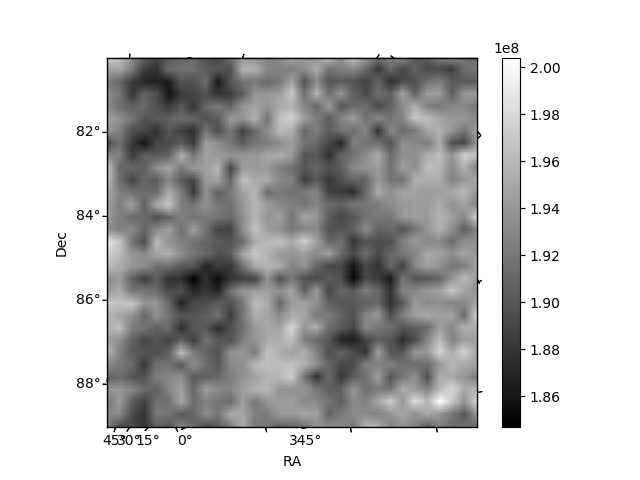
Histogram calculated using DETX and DETY for each event in the final _common_clean file
| Quadrant A | 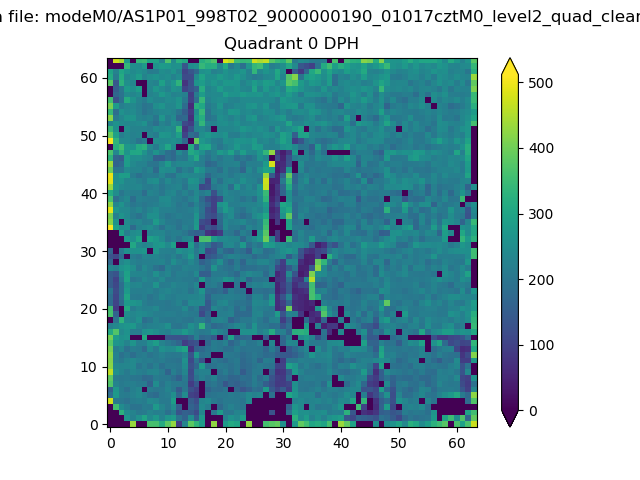 |
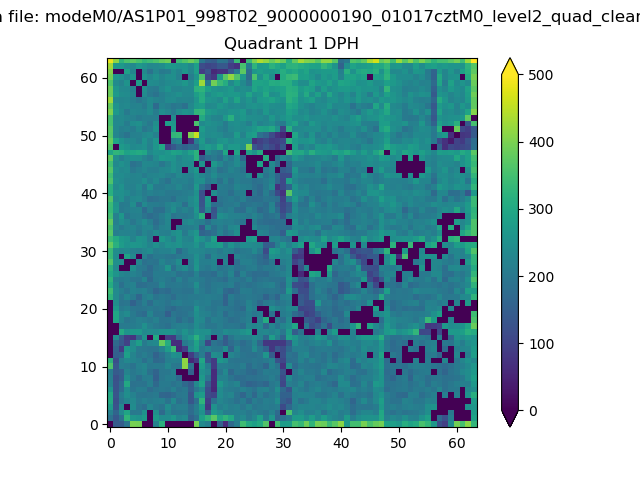 |
Quadrant B |
|---|---|---|---|
| Quadrant D | 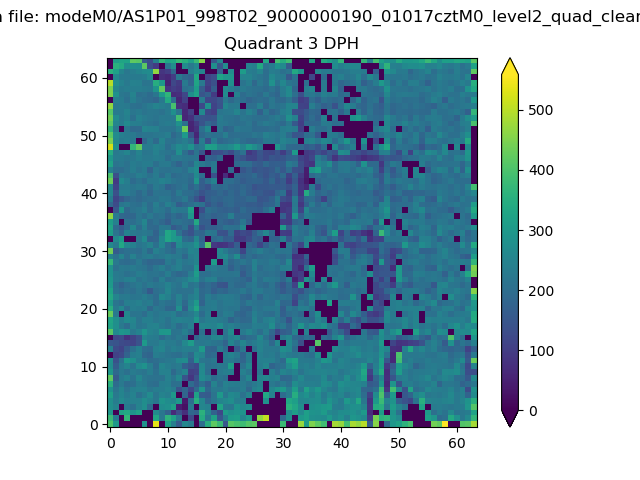 |
 |
Quadrant C |
| Plot type | Count rate plots | Images |
|---|---|---|
| Comparison with Poisson distribution Blue bars denote a histogram of data divided into 1 sec bins. Red curve is a Poisson curve with rate = median count rate of data. |
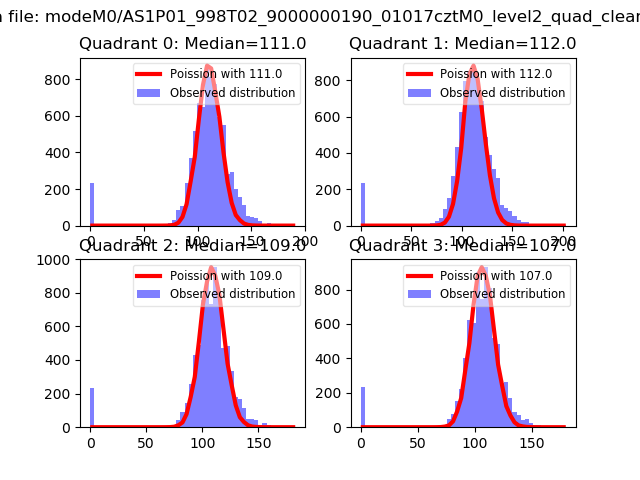 |
 |
| Quadrant-wise count rates Data is divided into 100 sec bins |
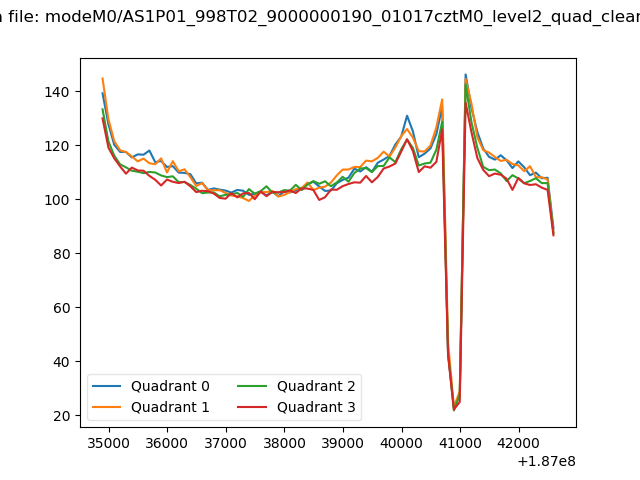 |
|
| Module-wise count rates for Quadrant A Data is divided into 100 sec bins |
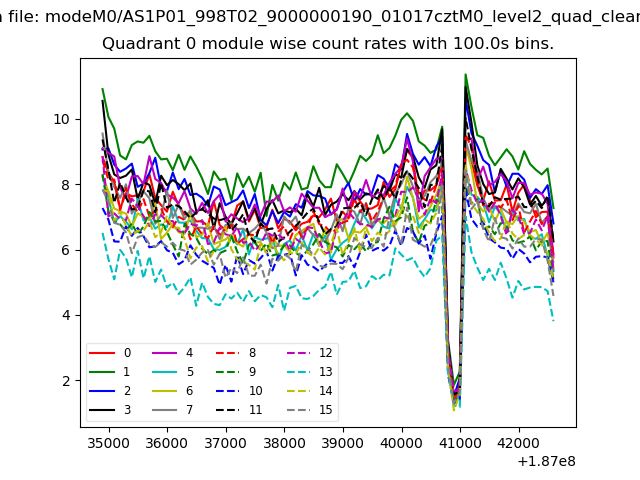 |
 |
| Module-wise count rates for Quadrant B Data is divided into 100 sec bins |
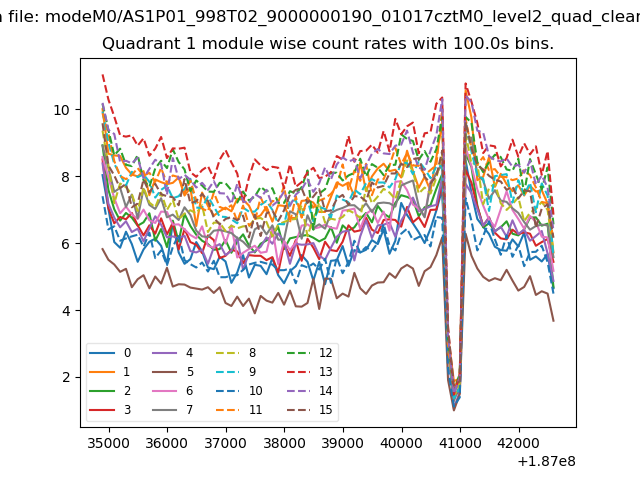 |
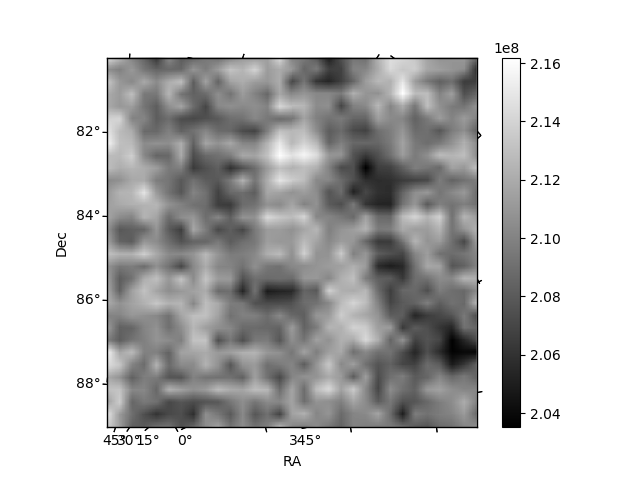 |
| Module-wise count rates for Quadrant C Data is divided into 100 sec bins |
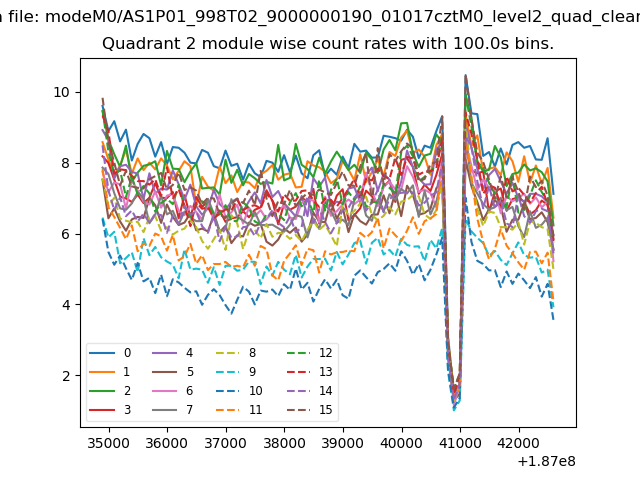 |
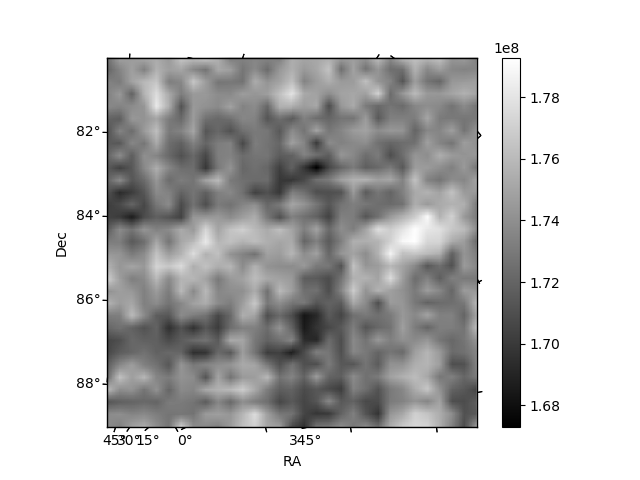 |
| Module-wise count rates for Quadrant D Data is divided into 100 sec bins |
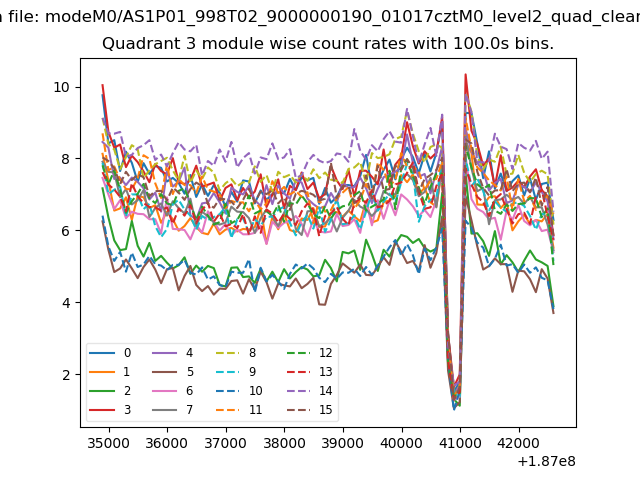 |
 |
| Parameter | Plot |
|---|---|
| CZT HV Monitor | 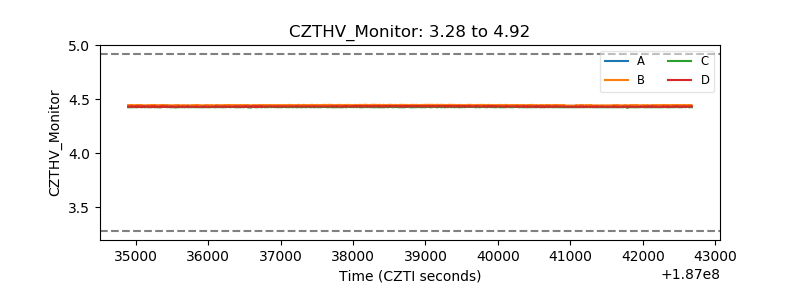 |
| D_VDD | 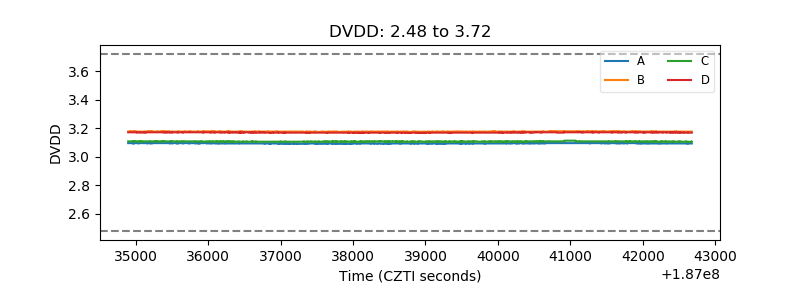 |
| Temperature 1 | 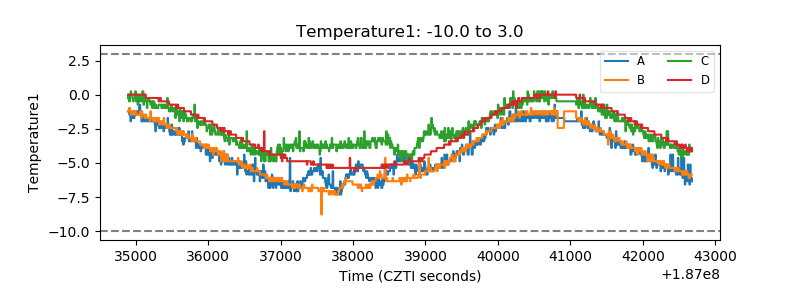 |
| Veto HV Monitor | 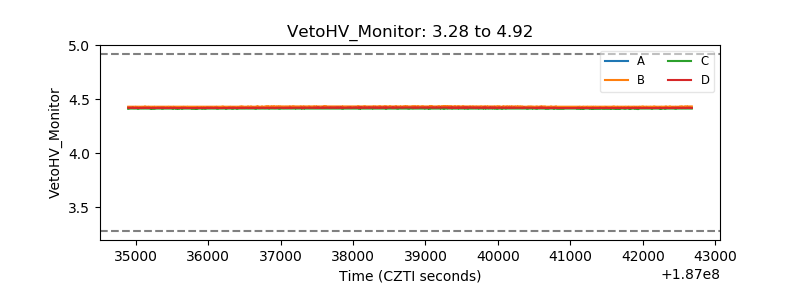 |
| Veto LLD | 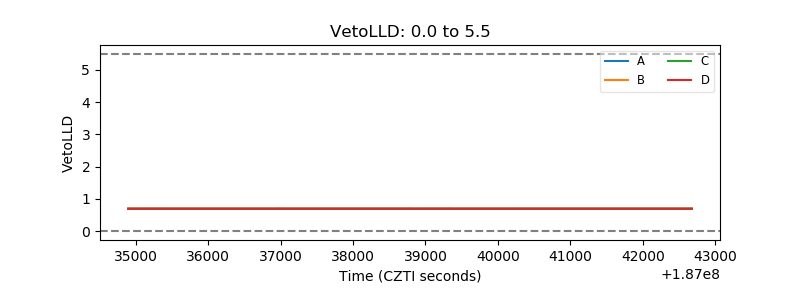 |
| Alpha Counter | 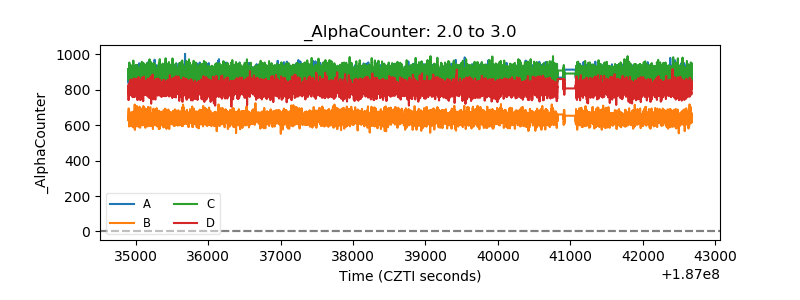 |
| _CPM_Rate | 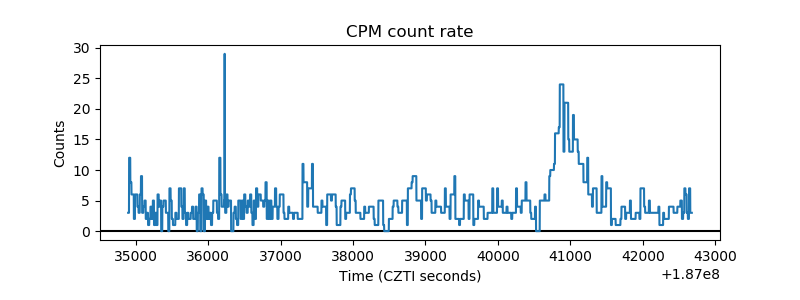 |
| CZT Counter | 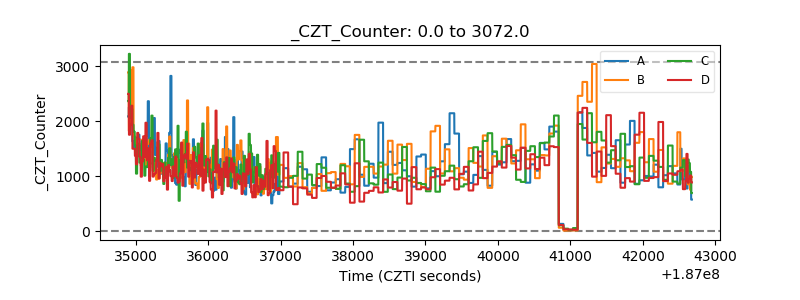 |
| +2.5 Volts monitor |  |
| +5 Volts monitor |  |
| _ROLL_ROT | 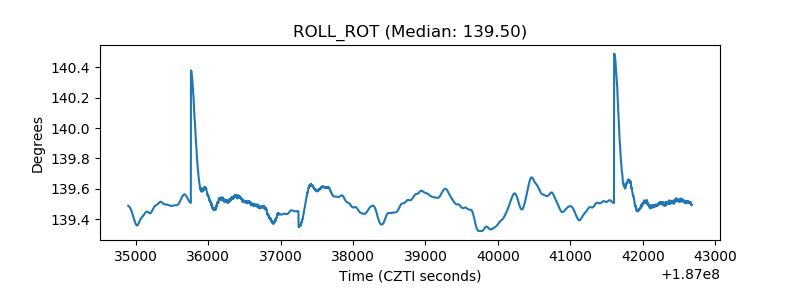 |
| _Roll_DEC | 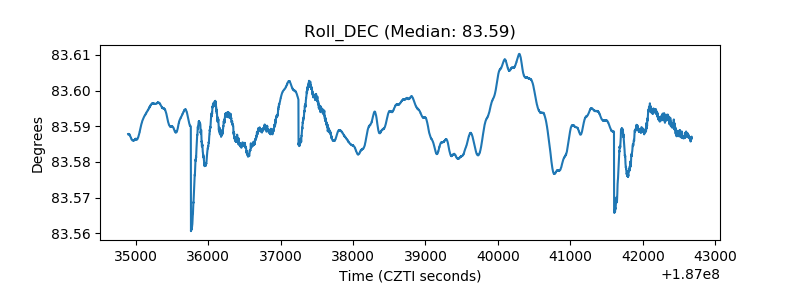 |
| _Roll_RA | 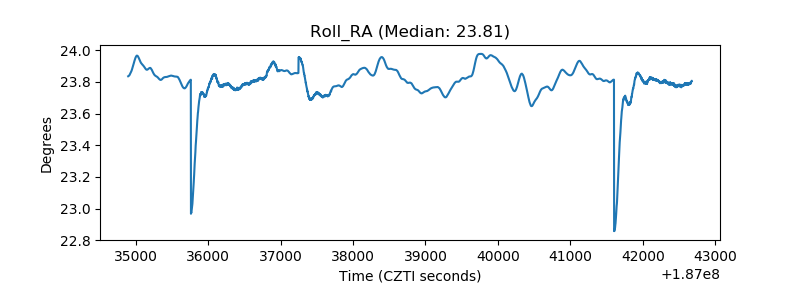 |
| Veto Counter | 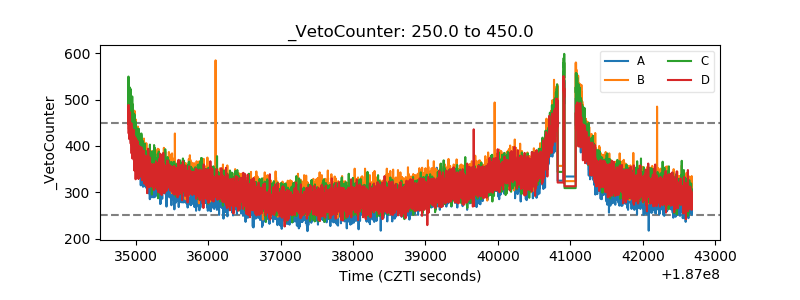 |