| Param | Original file | Final file |
|---|---|---|
| Filename | modeM0/AS1P01_998T02_9000000190_01018cztM0_level2.evt | modeM0/AS1P01_998T02_9000000190_01018cztM0_level2_quad_clean.evt |
| Size (bytes) | 1,291,533,120 | 132,897,600 |
| Size | 1.2 GB | 126.7 MB |
| Events in quadrant A | 9,428,324 | 884,140 |
| Events in quadrant B | 10,134,733 | 885,357 |
| Events in quadrant C | 9,838,130 | 861,735 |
| Events in quadrant D | 9,195,581 | 850,110 |
| Mode M0 | |||
|---|---|---|---|
| Quadrant | BADHDUFLAG | Total packets | Discarded packets |
| A | 0 | 33526 | 2 |
| B | 0 | 35666 | 2 |
| C | 0 | 34750 | 2 |
| D | 0 | 32903 | 2 |
| Mode SS | |||
|---|---|---|---|
| Quadrant | BADHDUFLAG | Total packets | Discarded packets |
| A | 0 | 164 | 0 |
| B | 0 | 164 | 0 |
| C | 0 | 164 | 0 |
| D | 0 | 164 | 0 |
| Mode M9 | |||
|---|---|---|---|
| Quadrant | BADHDUFLAG | Total packets | Discarded packets |
| A | 0 | 5 | 0 |
| B | 0 | 5 | 0 |
| C | 0 | 5 | 0 |
| D | 0 | 5 | 0 |
| Quadrant | Total seconds | Saturated seconds | Saturation percentage |
|---|---|---|---|
| A | 7825 | 6 | 0.076677% |
| B | 7826 | 35 | 0.447227% |
| C | 7826 | 29 | 0.370560% |
| D | 7826 | 90 | 1.150013% |
Noise dominated data is calculated using 1-second bins in cleaned event files. If a bin has >2000 counts, and if more than 50% of those come from <1% of pixels, then it is considered to be noise-dominated and hence unusable.
| Quadrant | # 1 sec bins | Bins with >0 counts | Bins with >2000 counts | High rate bins dominated by noise | Noise dominated (total time) | Noise dominated (detector-on time) | Marked lightcurve |
|---|---|---|---|---|---|---|---|
| A | 8260 | 7829 | 381 | 381 | 4.61% | 4.87% |  |
| B | 8261 | 7830 | 564 | 564 | 6.83% | 7.20% | 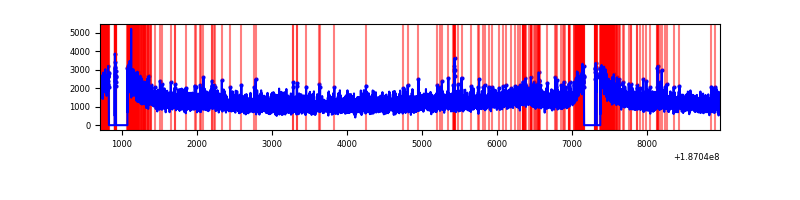 |
| C | 8261 | 7830 | 494 | 494 | 5.98% | 6.31% | 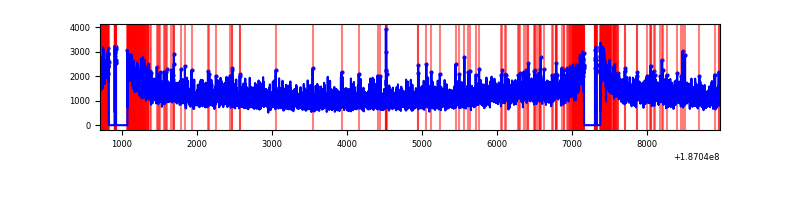 |
| D | 8261 | 7830 | 483 | 483 | 5.85% | 6.17% | 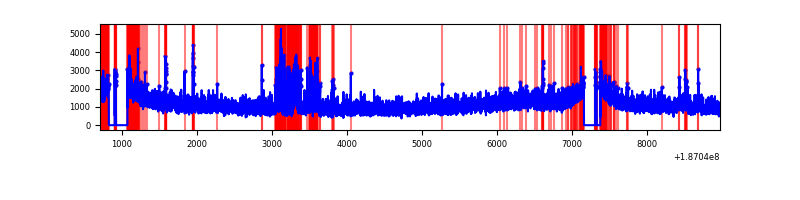 |
Top three noisy pixels from each quadrant. If the there are fewer than three noisy pixels in the level2.evt file, extra rows are filled as -1
| Pixel properties | Quadrant properties | ||||||
|---|---|---|---|---|---|---|---|
| Quadrant | DetID | PixID | Counts | Sigma | Mean | Median | Sigma |
| A | 0 | 231 | 40787 | 65.13 | 2441 | 2452 | 588.6 |
| A | 12 | 189 | 14303 | 20.13 | 2441 | 2452 | 588.6 |
| A | 11 | 79 | 11450 | 15.29 | 2441 | 2452 | 588.6 |
| B | 8 | 234 | 117276 | 189.14 | 2563 | 2568 | 606.5 |
| B | 15 | 22 | 66568 | 105.53 | 2563 | 2568 | 606.5 |
| B | 0 | 151 | 50734 | 79.42 | 2563 | 2568 | 606.5 |
| C | 15 | 241 | 402793 | 606.57 | 2368 | 2453 | 660.0 |
| C | 9 | 85 | 98817 | 146.01 | 2368 | 2453 | 660.0 |
| C | 3 | 79 | 37137 | 52.55 | 2368 | 2453 | 660.0 |
| D | 7 | 207 | 509588 | 724.71 | 2271 | 2349 | 699.9 |
| D | 13 | 73 | 69198 | 95.51 | 2271 | 2349 | 699.9 |
| D | 1 | 83 | 55304 | 75.66 | 2271 | 2349 | 699.9 |
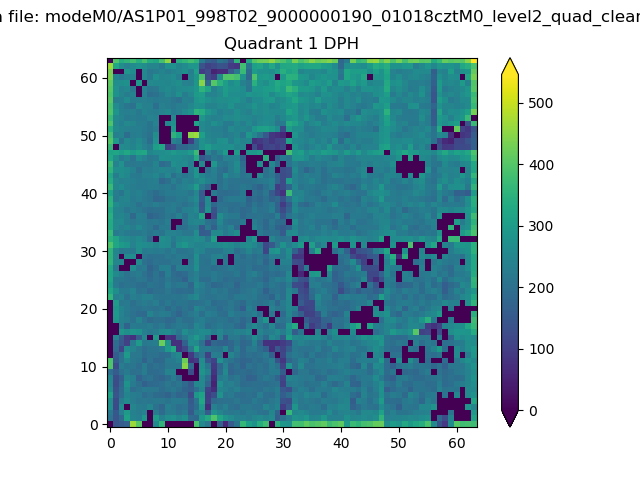
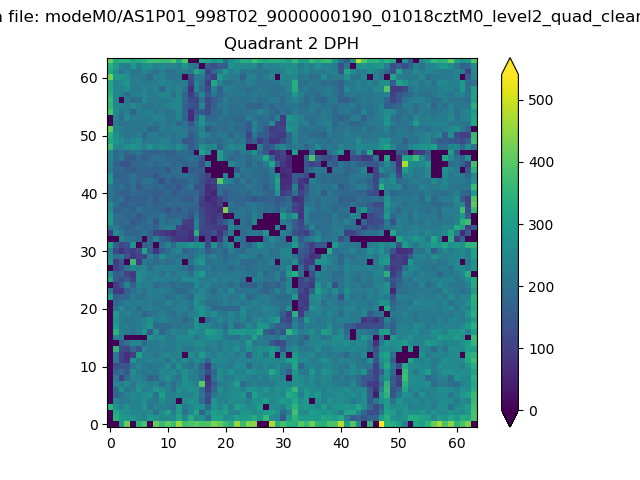
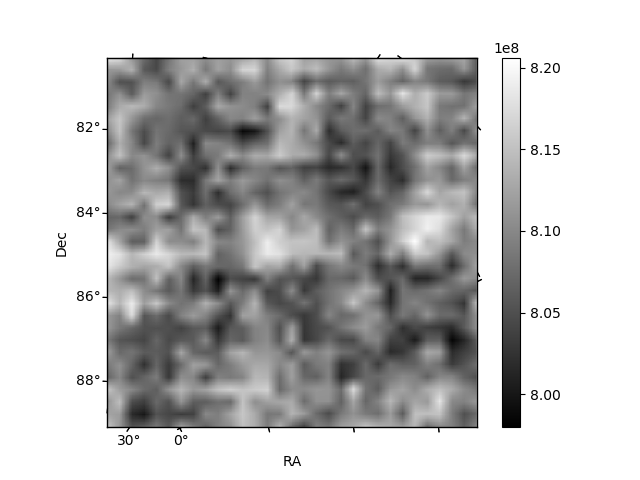
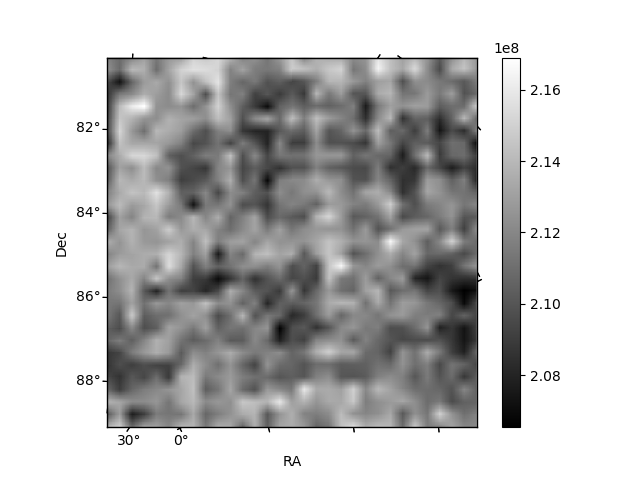
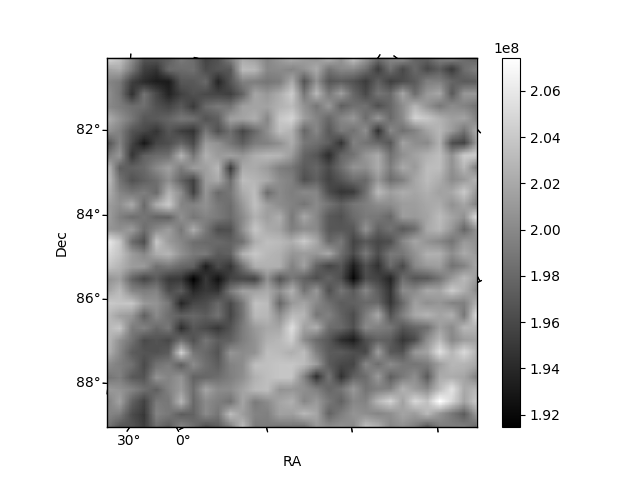
Histogram calculated using DETX and DETY for each event in the final _common_clean file
| Quadrant A | 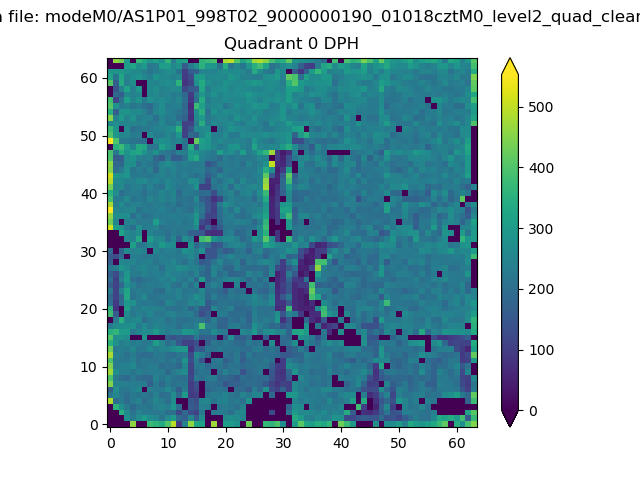 |
 |
Quadrant B |
|---|---|---|---|
| Quadrant D | 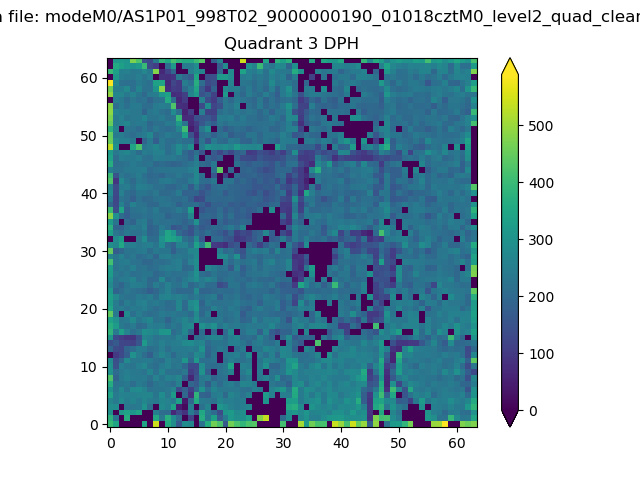 |
 |
Quadrant C |
| Plot type | Count rate plots | Images |
|---|---|---|
| Comparison with Poisson distribution Blue bars denote a histogram of data divided into 1 sec bins. Red curve is a Poisson curve with rate = median count rate of data. |
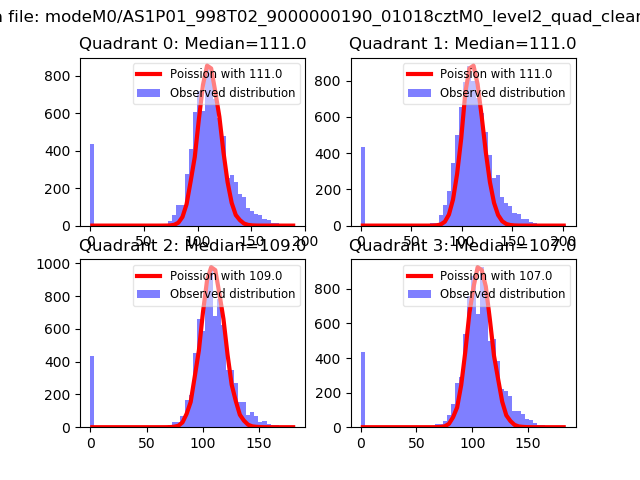 |
 |
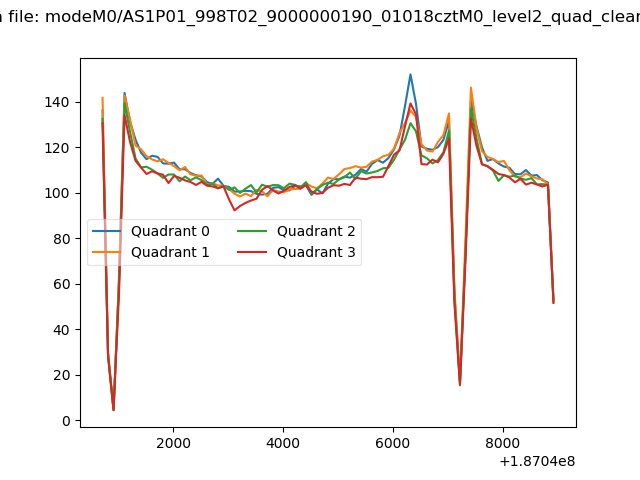
| Quadrant-wise count rates Data is divided into 100 sec bins |
 |
|
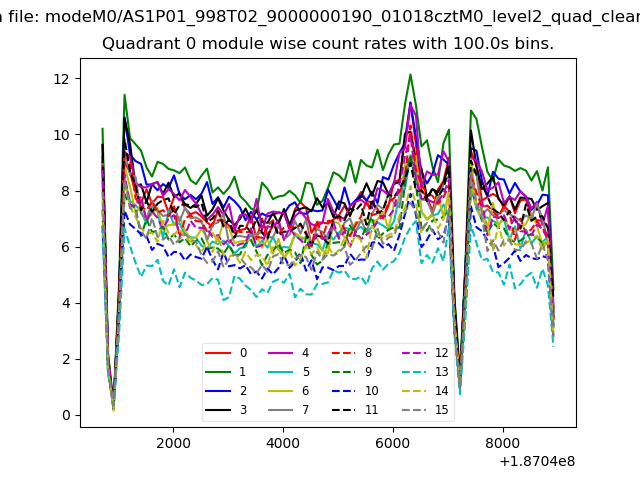
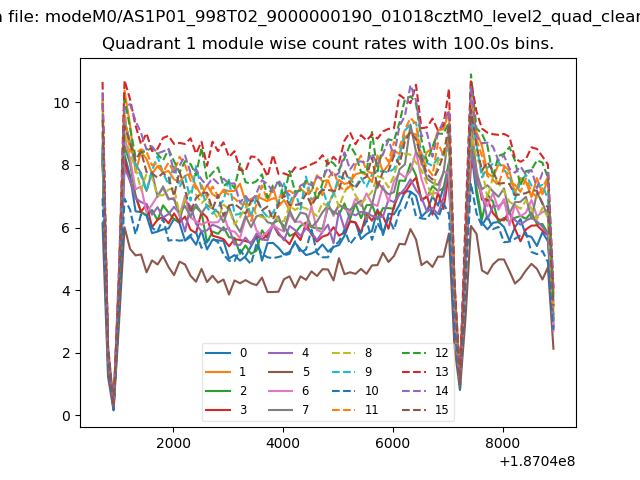
| Module-wise count rates for Quadrant A Data is divided into 100 sec bins |
 |
 |
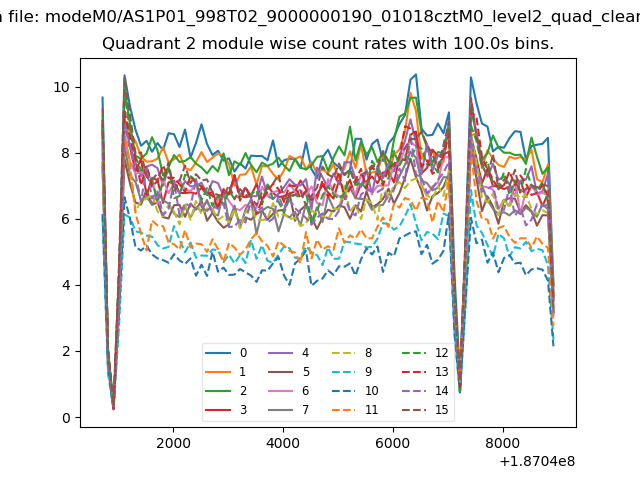
| Module-wise count rates for Quadrant B Data is divided into 100 sec bins |
 |
 |
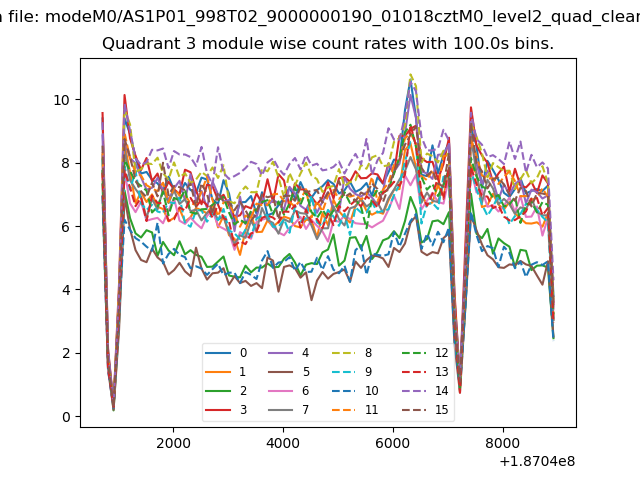
| Module-wise count rates for Quadrant C Data is divided into 100 sec bins |
 |
 |
| Module-wise count rates for Quadrant D Data is divided into 100 sec bins |
 |
 |
| Parameter | Plot |
|---|---|
| CZT HV Monitor | 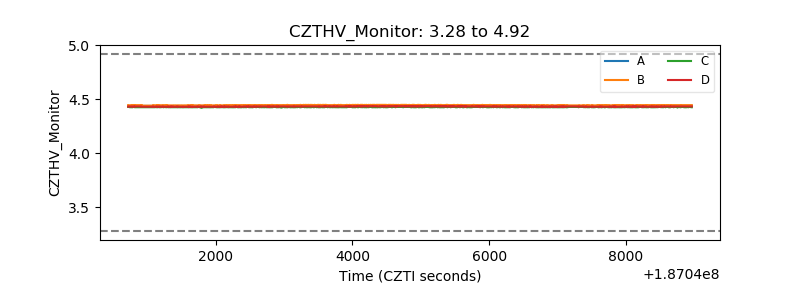 |
| D_VDD | 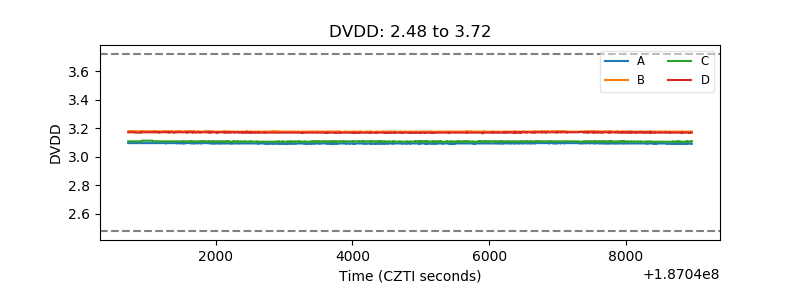 |
| Temperature 1 | 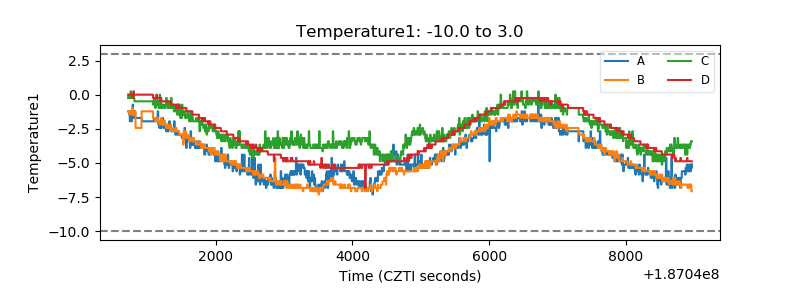 |
| Veto HV Monitor | 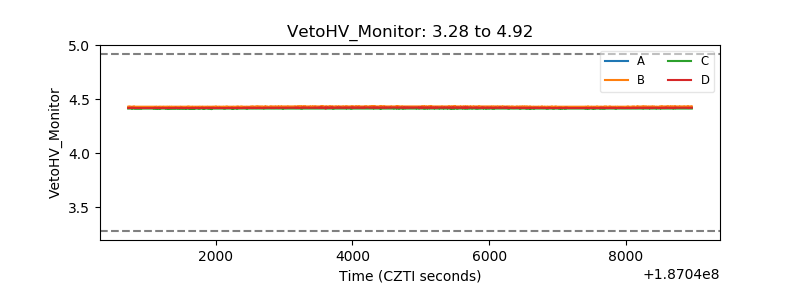 |
| Veto LLD | 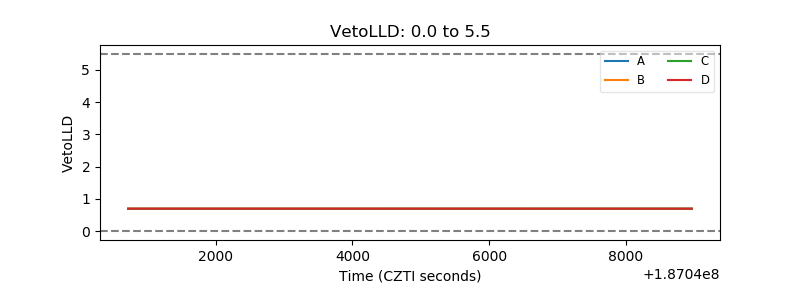 |
| Alpha Counter | 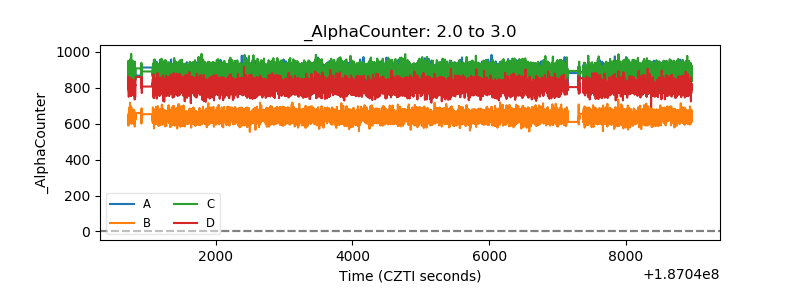 |
| _CPM_Rate | 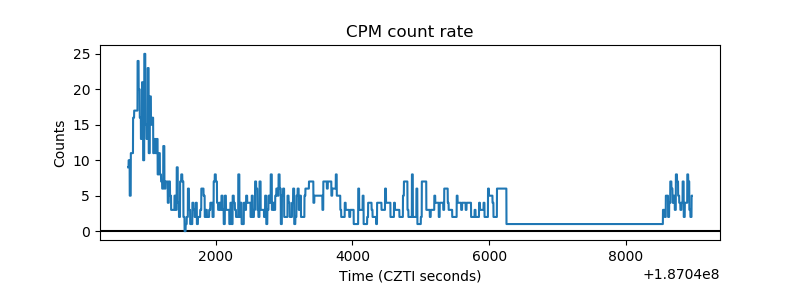 |
| CZT Counter | 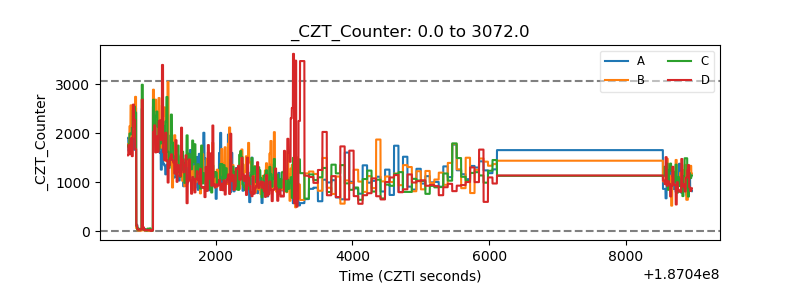 |
| +2.5 Volts monitor |  |
| +5 Volts monitor |  |
| _ROLL_ROT | 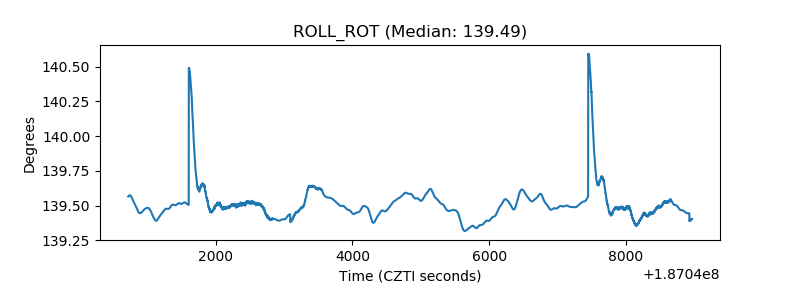 |
| _Roll_DEC | 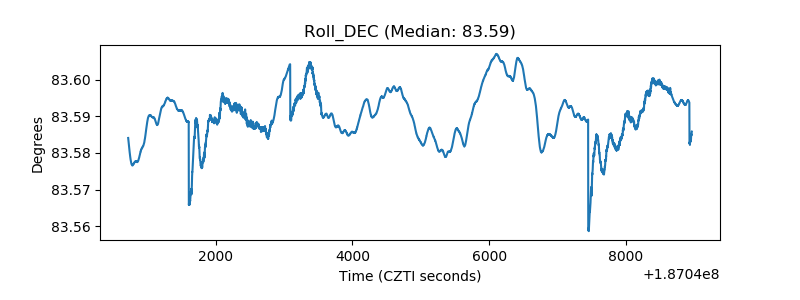 |
| _Roll_RA | 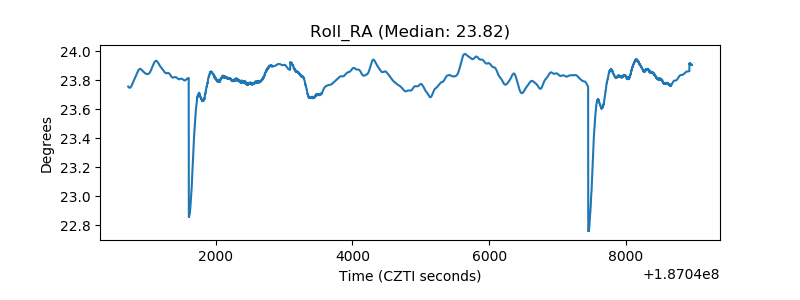 |
| Veto Counter | 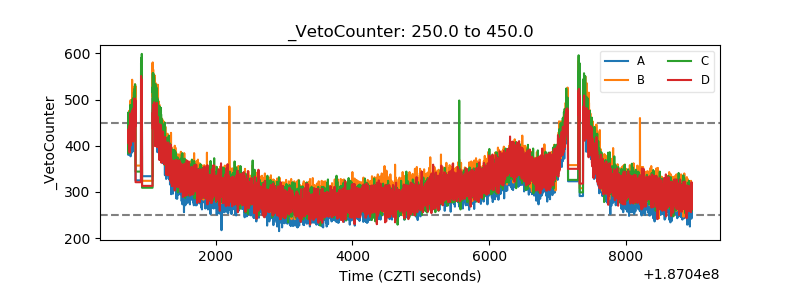 |