| Param | Original file | Final file |
|---|---|---|
| Filename | modeM0/AS1P01_998T02_9000000190_01019cztM0_level2.evt | modeM0/AS1P01_998T02_9000000190_01019cztM0_level2_quad_clean.evt |
| Size (bytes) | 1,169,530,560 | 123,966,720 |
| Size | 1.1 GB | 118.2 MB |
| Events in quadrant A | 8,563,779 | 818,349 |
| Events in quadrant B | 9,193,353 | 821,096 |
| Events in quadrant C | 9,251,533 | 801,828 |
| Events in quadrant D | 7,918,327 | 796,622 |
| Mode M0 | |||
|---|---|---|---|
| Quadrant | BADHDUFLAG | Total packets | Discarded packets |
| A | 0 | 30739 | 1 |
| B | 0 | 32575 | 1 |
| C | 0 | 32723 | 2 |
| D | 0 | 28821 | 1 |
| Mode SS | |||
|---|---|---|---|
| Quadrant | BADHDUFLAG | Total packets | Discarded packets |
| A | 0 | 150 | 0 |
| B | 0 | 150 | 0 |
| C | 0 | 150 | 0 |
| D | 0 | 150 | 0 |
| Mode M9 | |||
|---|---|---|---|
| Quadrant | BADHDUFLAG | Total packets | Discarded packets |
| A | 0 | 4 | 0 |
| B | 0 | 4 | 0 |
| C | 0 | 4 | 0 |
| D | 0 | 4 | 0 |
| Quadrant | Total seconds | Saturated seconds | Saturation percentage |
|---|---|---|---|
| A | 7430 | 2 | 0.026918% |
| B | 7430 | 14 | 0.188425% |
| C | 7429 | 6 | 0.080765% |
| D | 7429 | 34 | 0.457666% |
Noise dominated data is calculated using 1-second bins in cleaned event files. If a bin has >2000 counts, and if more than 50% of those come from <1% of pixels, then it is considered to be noise-dominated and hence unusable.
| Quadrant | # 1 sec bins | Bins with >0 counts | Bins with >2000 counts | High rate bins dominated by noise | Noise dominated (total time) | Noise dominated (detector-on time) | Marked lightcurve |
|---|---|---|---|---|---|---|---|
| A | 7820 | 7431 | 155 | 155 | 1.98% | 2.09% | 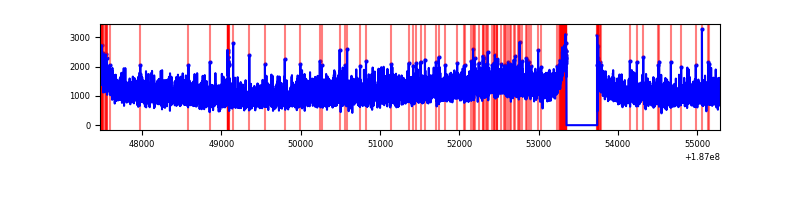 |
| B | 7820 | 7431 | 264 | 264 | 3.38% | 3.55% | 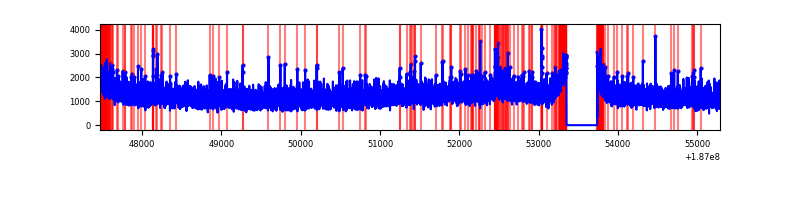 |
| C | 7819 | 7430 | 277 | 277 | 3.54% | 3.73% | 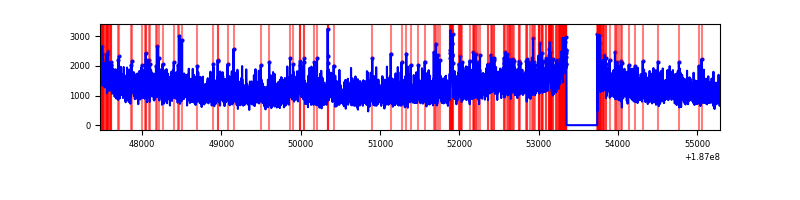 |
| D | 7819 | 7430 | 148 | 148 | 1.89% | 1.99% | 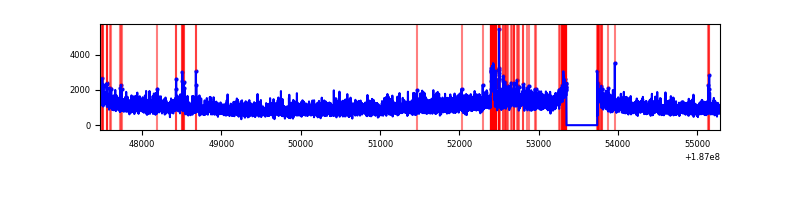 |
Top three noisy pixels from each quadrant. If the there are fewer than three noisy pixels in the level2.evt file, extra rows are filled as -1
| Pixel properties | Quadrant properties | ||||||
|---|---|---|---|---|---|---|---|
| Quadrant | DetID | PixID | Counts | Sigma | Mean | Median | Sigma |
| A | 0 | 231 | 38507 | 67.83 | 2217 | 2231 | 534.8 |
| A | 11 | 79 | 11745 | 17.79 | 2217 | 2231 | 534.8 |
| A | 12 | 189 | 10574 | 15.6 | 2217 | 2231 | 534.8 |
| B | 0 | 220 | 145179 | 258.21 | 2333 | 2337 | 553.2 |
| B | 15 | 22 | 59875 | 104.01 | 2333 | 2337 | 553.2 |
| B | 8 | 234 | 46193 | 79.28 | 2333 | 2337 | 553.2 |
| C | 9 | 85 | 427992 | 710.38 | 2148 | 2226 | 599.3 |
| C | 15 | 241 | 375166 | 622.24 | 2148 | 2226 | 599.3 |
| C | 3 | 111 | 30376 | 46.97 | 2148 | 2226 | 599.3 |
| D | 1 | 83 | 185053 | 287.38 | 2045 | 2112 | 636.6 |
| D | 9 | 64 | 46070 | 69.05 | 2045 | 2112 | 636.6 |
| D | 9 | 49 | 24443 | 35.08 | 2045 | 2112 | 636.6 |
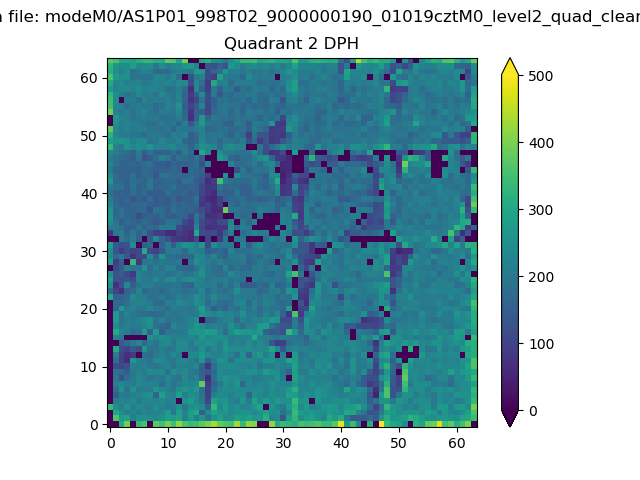
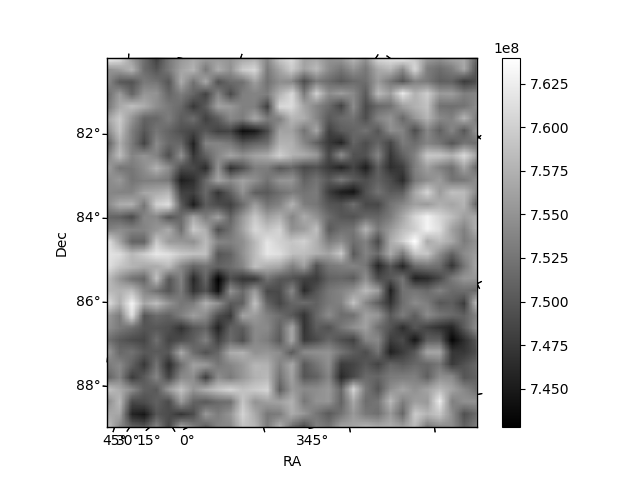
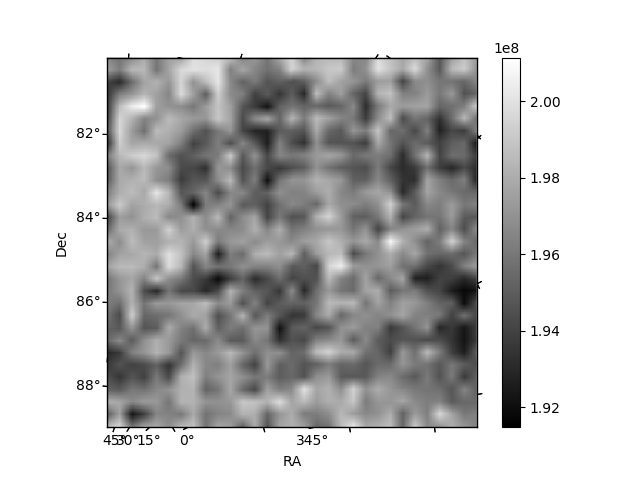
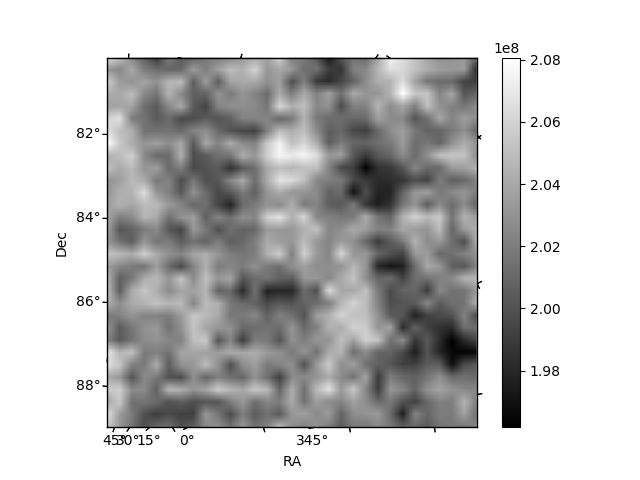
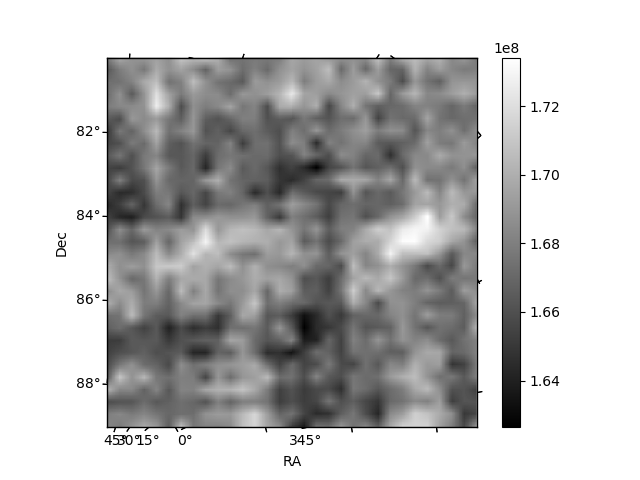
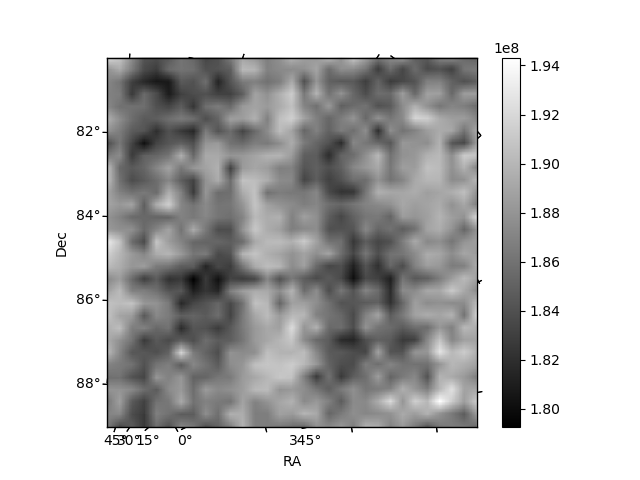
Histogram calculated using DETX and DETY for each event in the final _common_clean file
| Quadrant A | 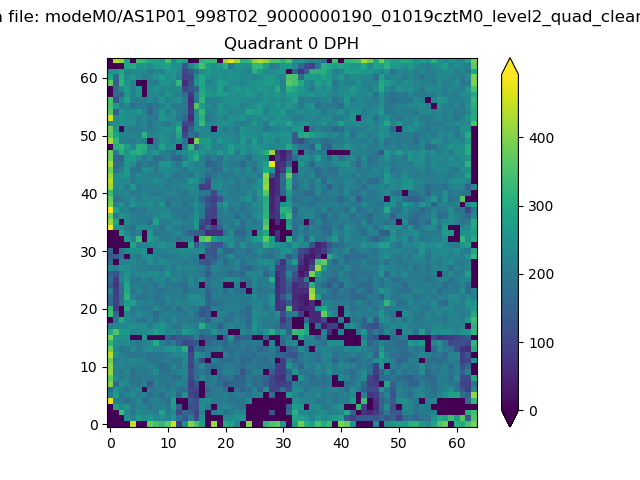 |
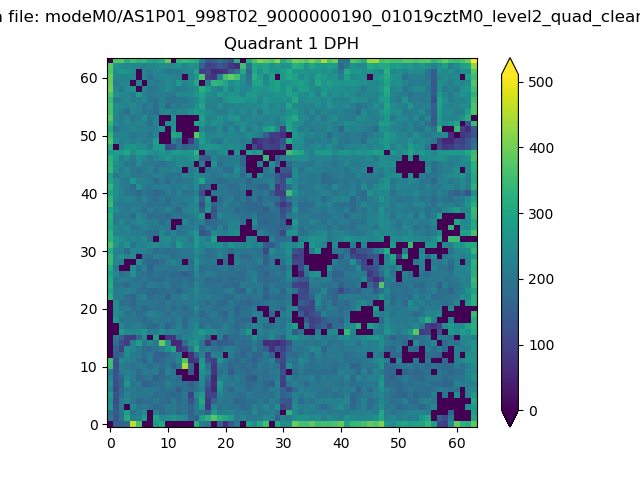 |
Quadrant B |
|---|---|---|---|
| Quadrant D | 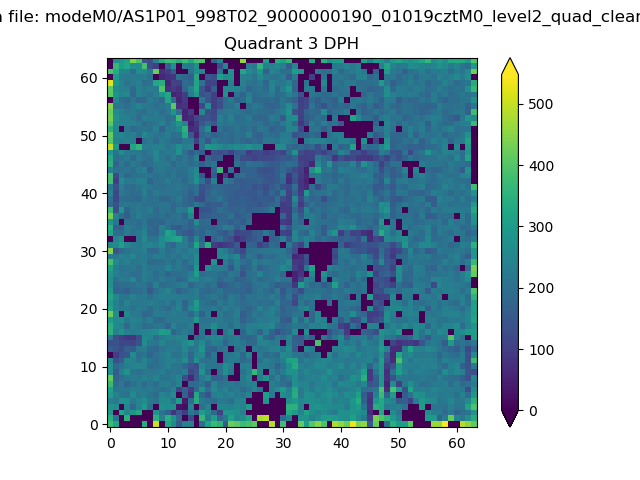 |
 |
Quadrant C |
| Plot type | Count rate plots | Images |
|---|---|---|
| Comparison with Poisson distribution Blue bars denote a histogram of data divided into 1 sec bins. Red curve is a Poisson curve with rate = median count rate of data. |
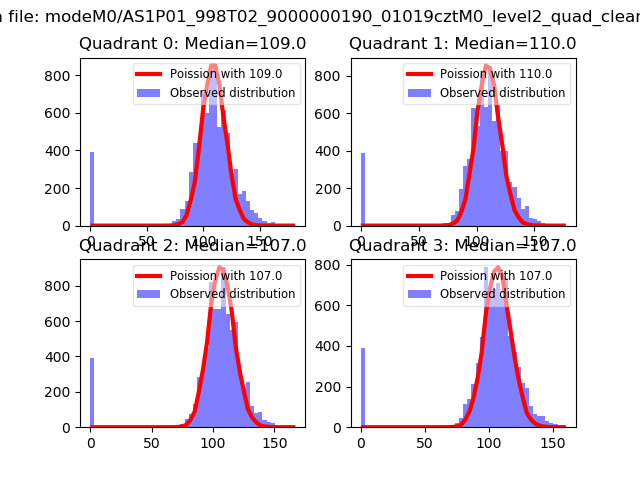 |
 |
| Quadrant-wise count rates Data is divided into 100 sec bins |
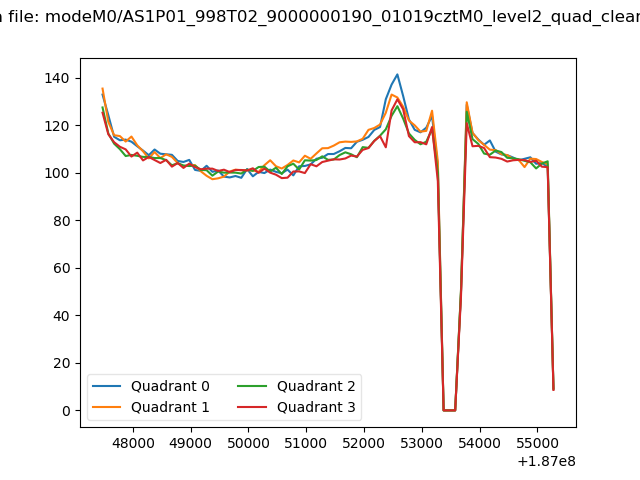 |
|
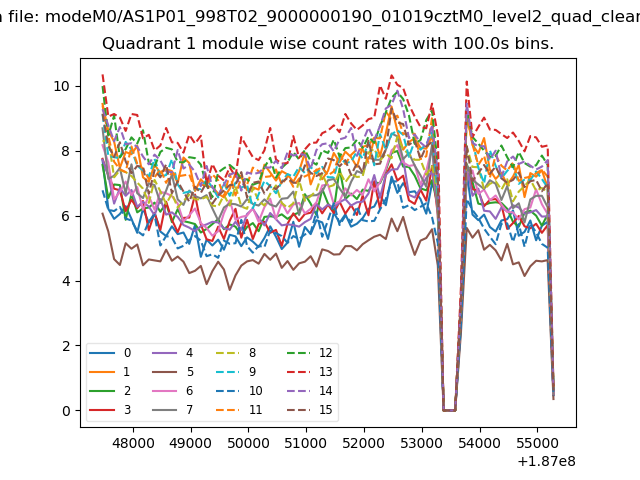
| Module-wise count rates for Quadrant A Data is divided into 100 sec bins |
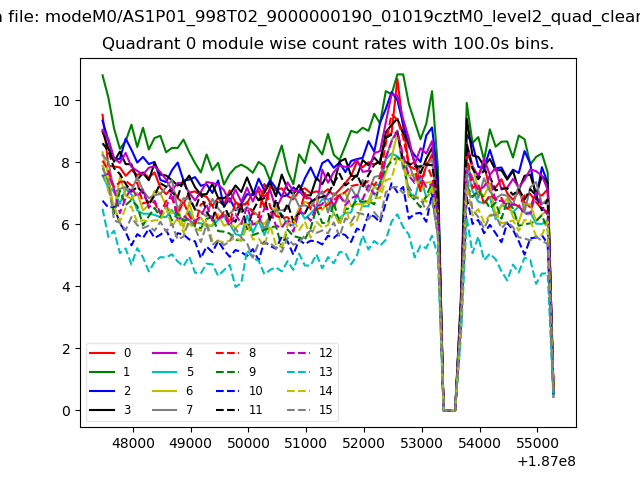 |
 |
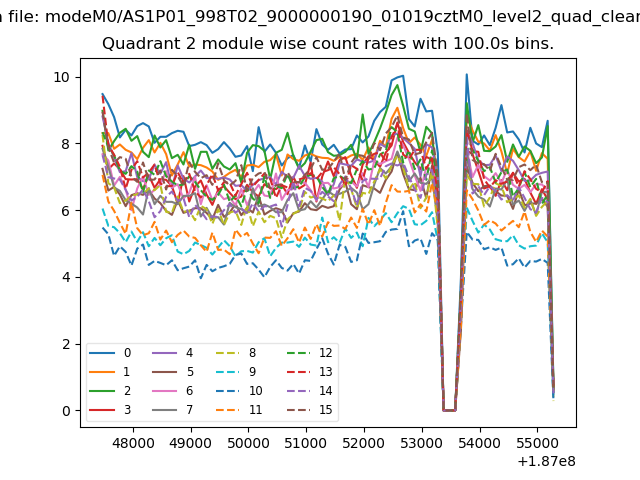
| Module-wise count rates for Quadrant B Data is divided into 100 sec bins |
 |
 |
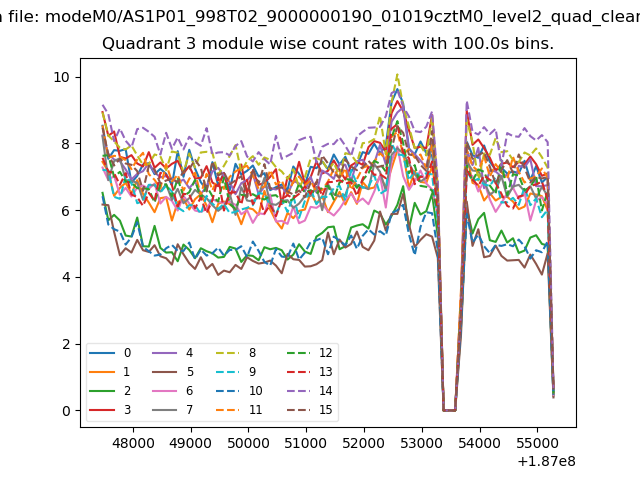
| Module-wise count rates for Quadrant C Data is divided into 100 sec bins |
 |
 |
| Module-wise count rates for Quadrant D Data is divided into 100 sec bins |
 |
 |
| Parameter | Plot |
|---|---|
| CZT HV Monitor | 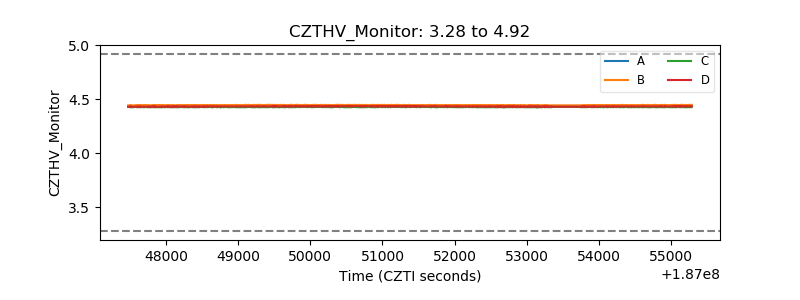 |
| D_VDD | 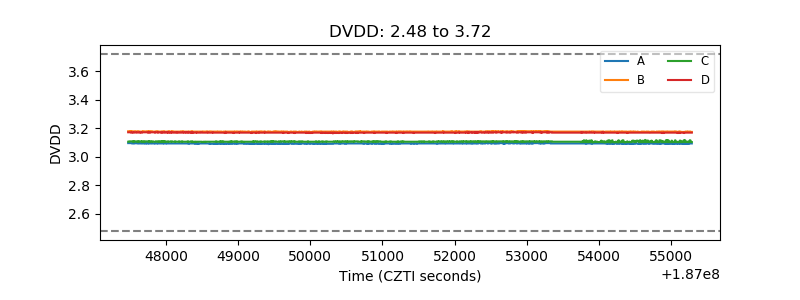 |
| Temperature 1 | 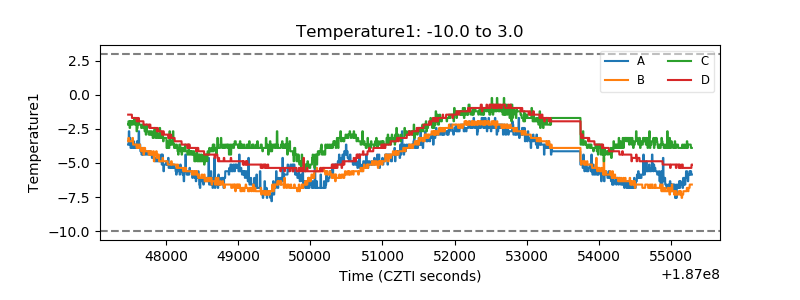 |
| Veto HV Monitor | 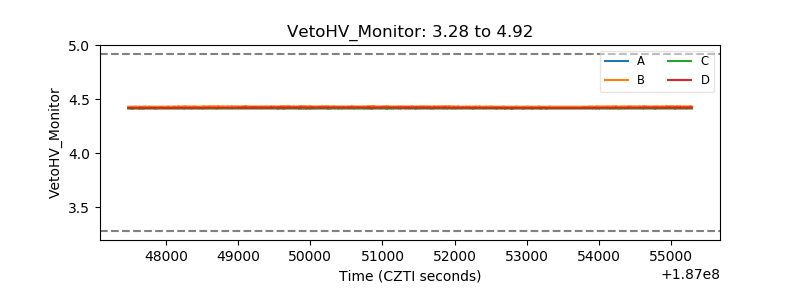 |
| Veto LLD | 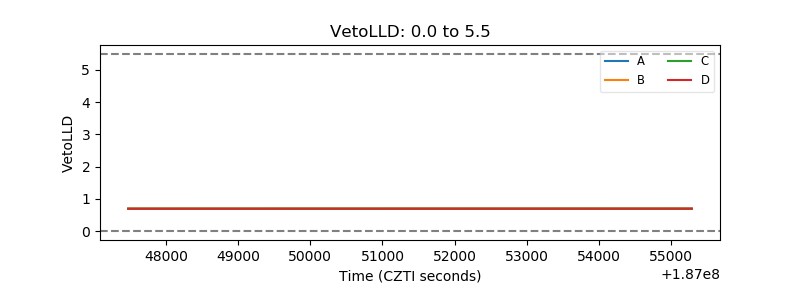 |
| Alpha Counter | 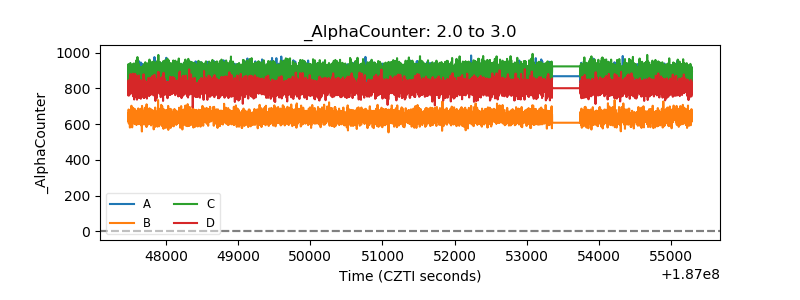 |
| _CPM_Rate | 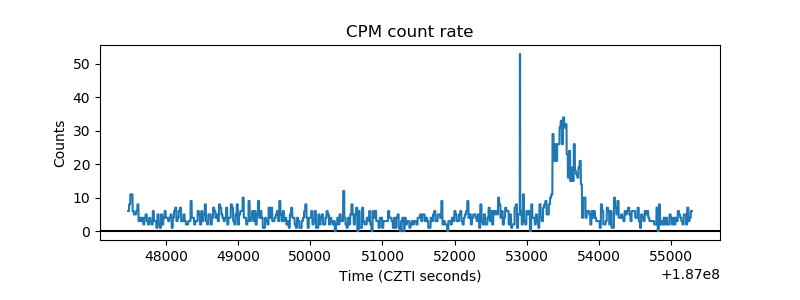 |
| CZT Counter | 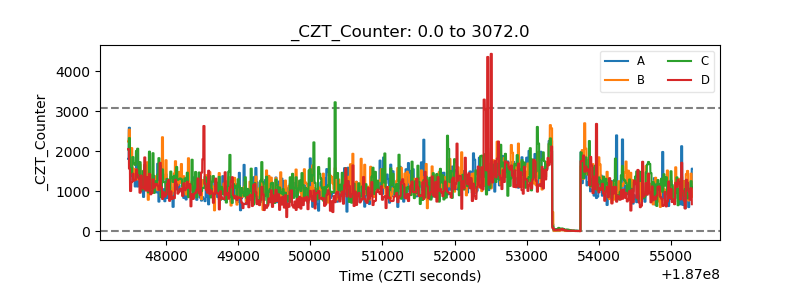 |
| +2.5 Volts monitor |  |
| +5 Volts monitor |  |
| _ROLL_ROT | 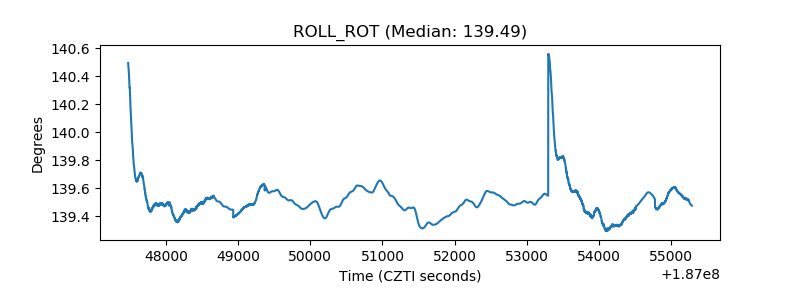 |
| _Roll_DEC | 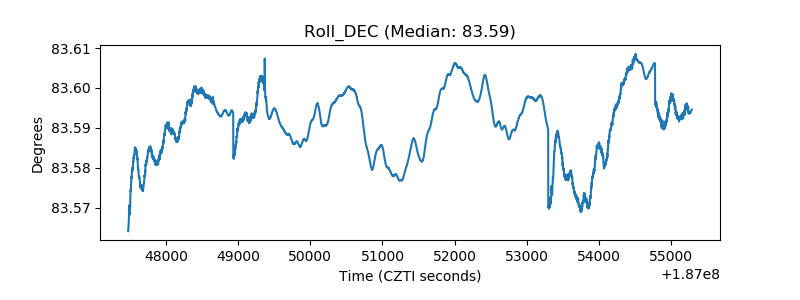 |
| _Roll_RA | 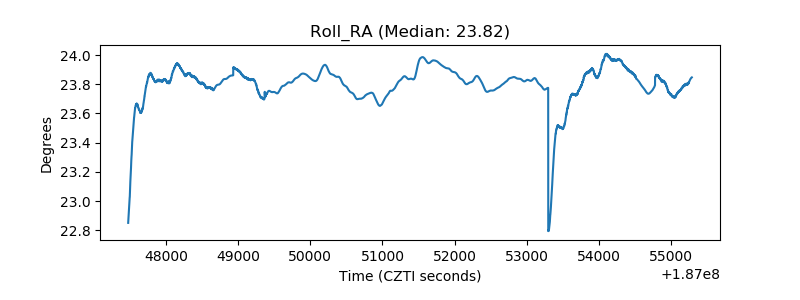 |
| Veto Counter | 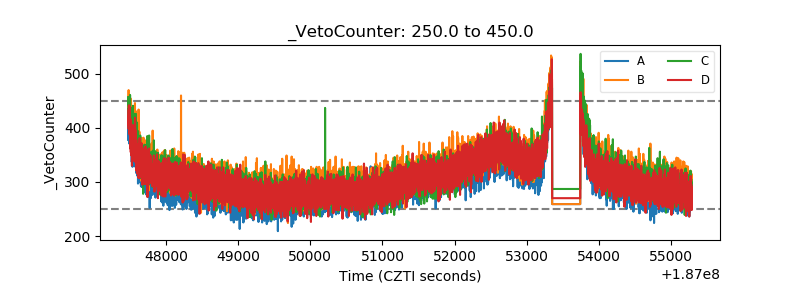 |