| Param | Original file | Final file |
|---|---|---|
| Filename | modeM0/AS1P01_998T02_9000000190_01020cztM0_level2.evt | modeM0/AS1P01_998T02_9000000190_01020cztM0_level2_quad_clean.evt |
| Size (bytes) | 1,177,502,400 | 125,536,320 |
| Size | 1.1 GB | 119.7 MB |
| Events in quadrant A | 8,703,050 | 826,116 |
| Events in quadrant B | 9,329,806 | 830,610 |
| Events in quadrant C | 8,967,919 | 817,989 |
| Events in quadrant D | 8,159,022 | 802,072 |
| Mode M0 | |||
|---|---|---|---|
| Quadrant | BADHDUFLAG | Total packets | Discarded packets |
| A | 0 | 31233 | 2 |
| B | 0 | 33079 | 2 |
| C | 0 | 31981 | 2 |
| D | 0 | 29661 | 2 |
| Mode SS | |||
|---|---|---|---|
| Quadrant | BADHDUFLAG | Total packets | Discarded packets |
| A | 0 | 156 | 0 |
| B | 0 | 156 | 0 |
| C | 0 | 156 | 0 |
| D | 0 | 156 | 0 |
| Mode M9 | |||
|---|---|---|---|
| Quadrant | BADHDUFLAG | Total packets | Discarded packets |
| A | 0 | 9 | 0 |
| B | 0 | 9 | 0 |
| C | 0 | 9 | 0 |
| D | 0 | 9 | 0 |
| Quadrant | Total seconds | Saturated seconds | Saturation percentage |
|---|---|---|---|
| A | 7550 | 7 | 0.092715% |
| B | 7550 | 28 | 0.370861% |
| C | 7550 | 5 | 0.066225% |
| D | 7550 | 80 | 1.059603% |
Noise dominated data is calculated using 1-second bins in cleaned event files. If a bin has >2000 counts, and if more than 50% of those come from <1% of pixels, then it is considered to be noise-dominated and hence unusable.
| Quadrant | # 1 sec bins | Bins with >0 counts | Bins with >2000 counts | High rate bins dominated by noise | Noise dominated (total time) | Noise dominated (detector-on time) | Marked lightcurve |
|---|---|---|---|---|---|---|---|
| A | 8495 | 7551 | 178 | 178 | 2.10% | 2.36% | 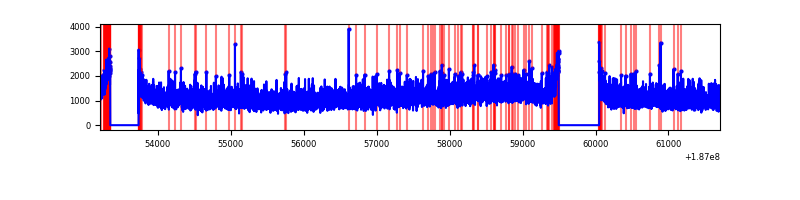 |
| B | 8495 | 7551 | 287 | 287 | 3.38% | 3.80% | 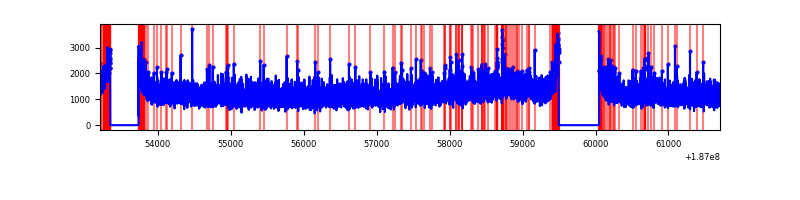 |
| C | 8495 | 7551 | 231 | 231 | 2.72% | 3.06% | 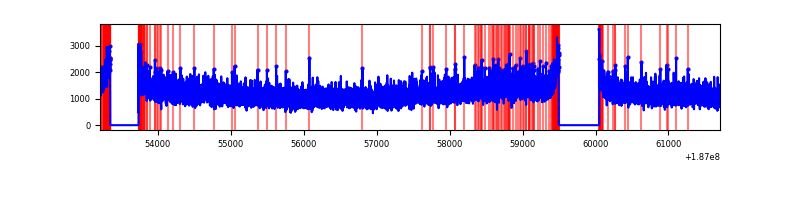 |
| D | 8495 | 7551 | 240 | 240 | 2.83% | 3.18% | 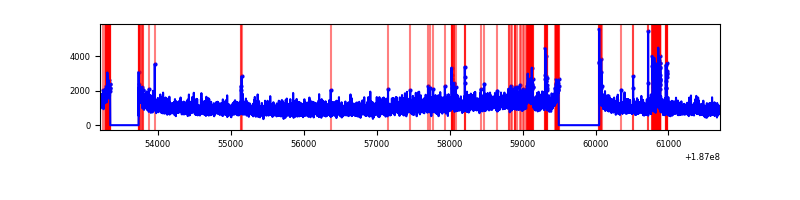 |
Top three noisy pixels from each quadrant. If the there are fewer than three noisy pixels in the level2.evt file, extra rows are filled as -1
| Pixel properties | Quadrant properties | ||||||
|---|---|---|---|---|---|---|---|
| Quadrant | DetID | PixID | Counts | Sigma | Mean | Median | Sigma |
| A | 12 | 189 | 24128 | 40.33 | 2254 | 2272 | 541.9 |
| A | 4 | 32 | 14027 | 21.69 | 2254 | 2272 | 541.9 |
| A | 11 | 79 | 10336 | 14.88 | 2254 | 2272 | 541.9 |
| B | 0 | 220 | 104936 | 183.82 | 2382 | 2391 | 557.9 |
| B | 5 | 249 | 70600 | 122.27 | 2382 | 2391 | 557.9 |
| B | 15 | 22 | 55660 | 95.49 | 2382 | 2391 | 557.9 |
| C | 15 | 241 | 386587 | 633.61 | 2170 | 2249 | 606.6 |
| C | 3 | 111 | 34816 | 53.69 | 2170 | 2249 | 606.6 |
| C | 3 | 79 | 31242 | 47.8 | 2170 | 2249 | 606.6 |
| D | 1 | 83 | 334304 | 522.65 | 2058 | 2129 | 635.6 |
| D | 9 | 64 | 75122 | 114.85 | 2058 | 2129 | 635.6 |
| D | 9 | 49 | 36640 | 54.3 | 2058 | 2129 | 635.6 |
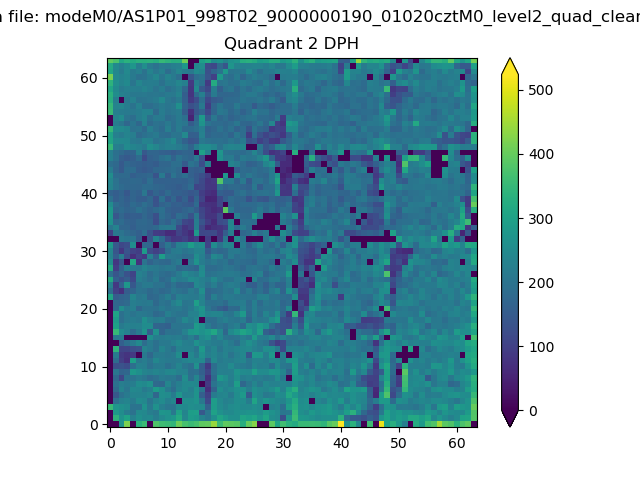
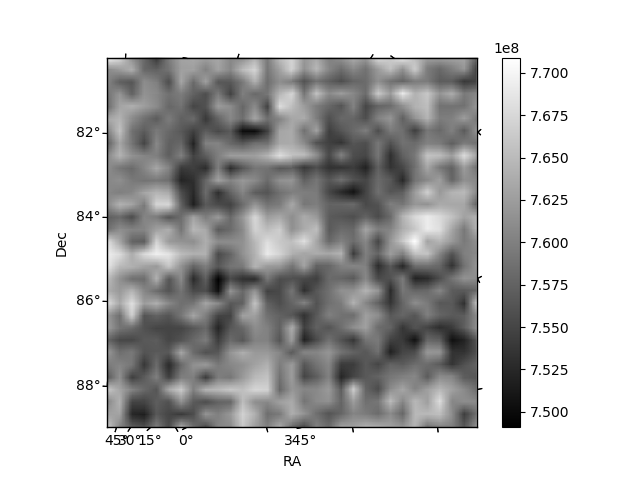
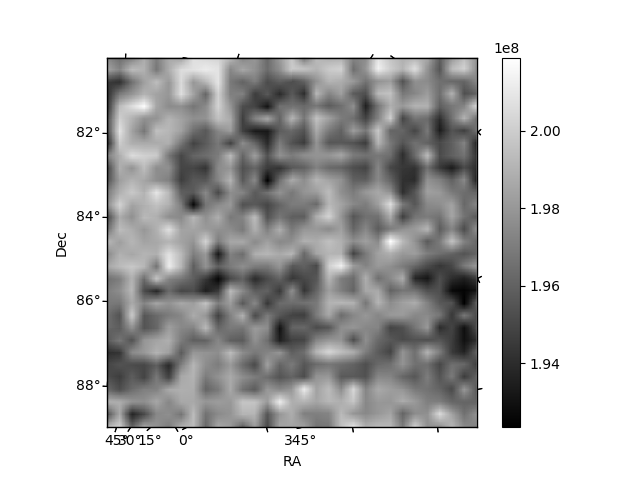
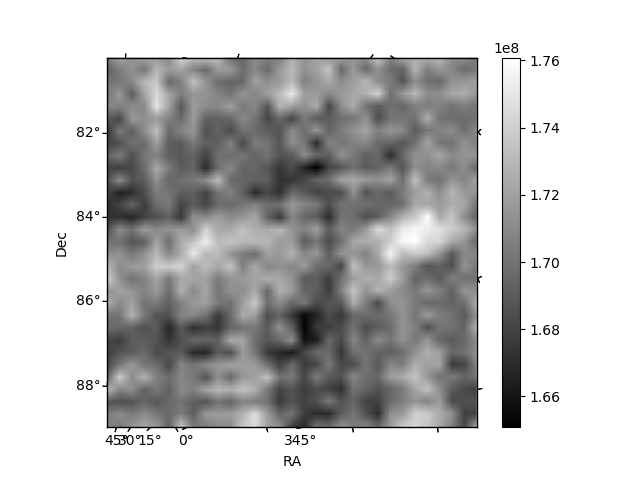
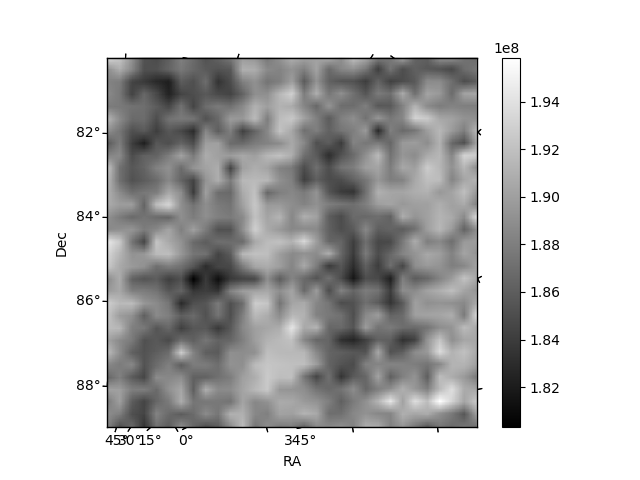
Histogram calculated using DETX and DETY for each event in the final _common_clean file
| Quadrant A | 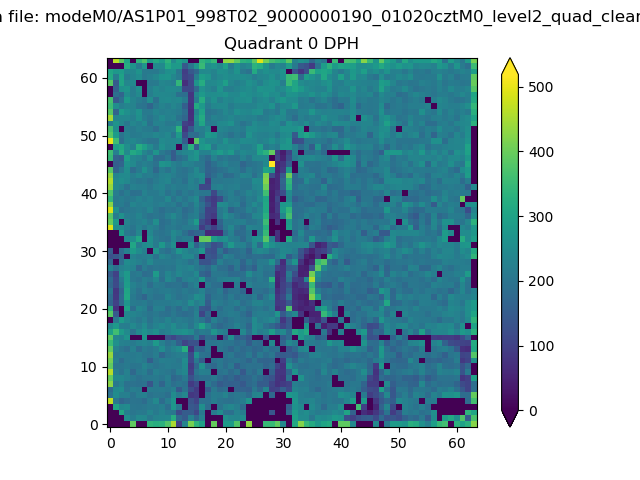 |
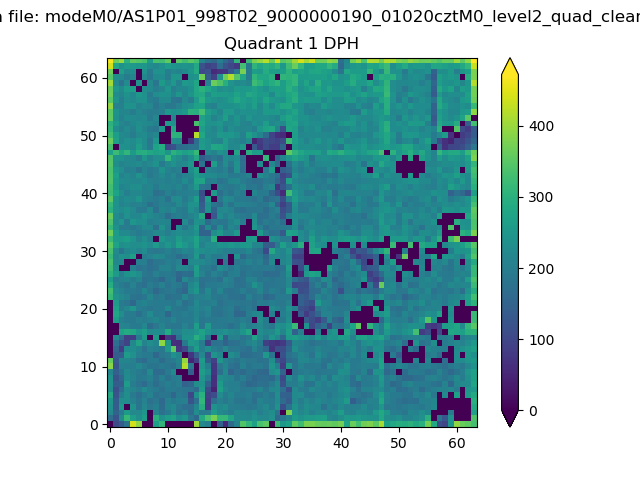 |
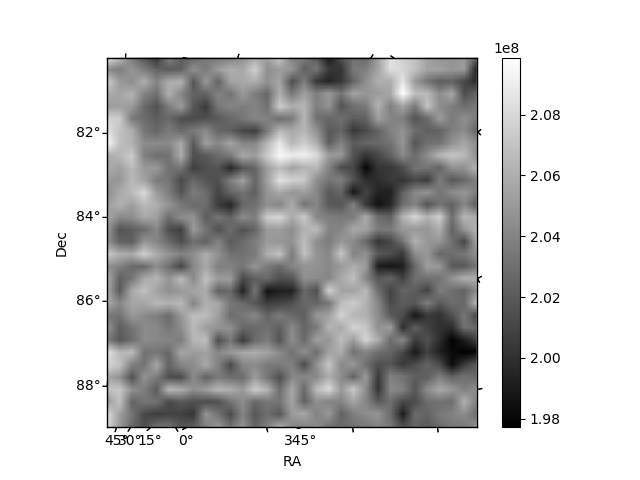
Quadrant B |
|---|---|---|---|
| Quadrant D | 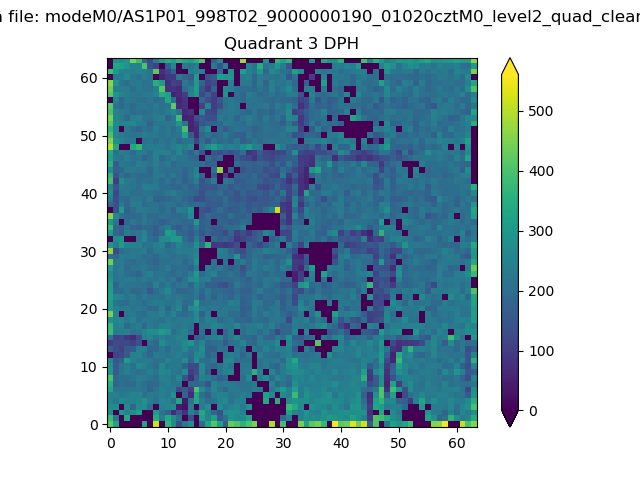 |
 |
Quadrant C |
| Plot type | Count rate plots | Images |
|---|---|---|
| Comparison with Poisson distribution Blue bars denote a histogram of data divided into 1 sec bins. Red curve is a Poisson curve with rate = median count rate of data. |
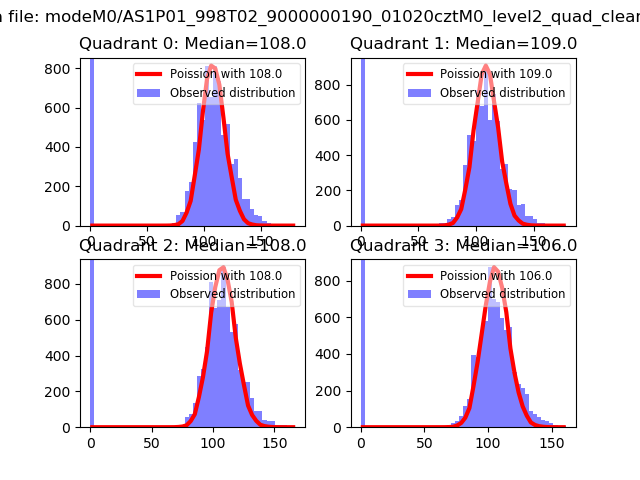 |
 |
| Quadrant-wise count rates Data is divided into 100 sec bins |
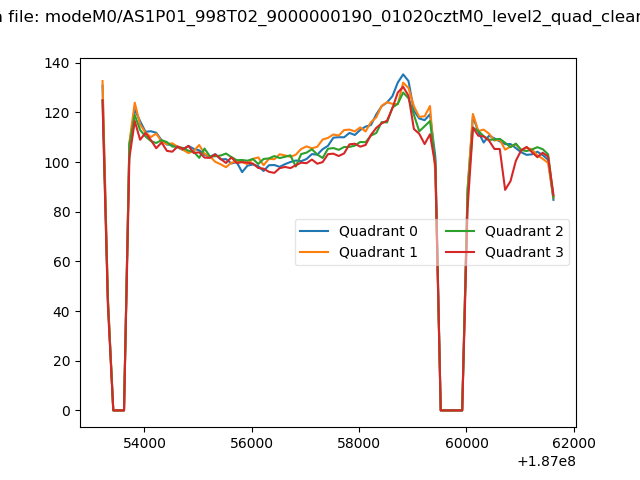 |
|
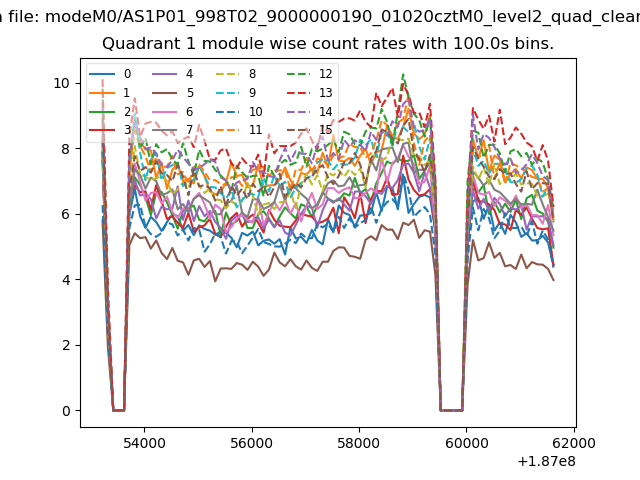
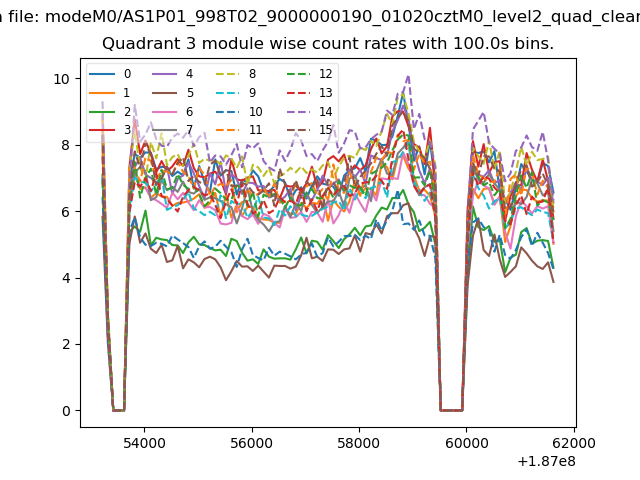
| Module-wise count rates for Quadrant A Data is divided into 100 sec bins |
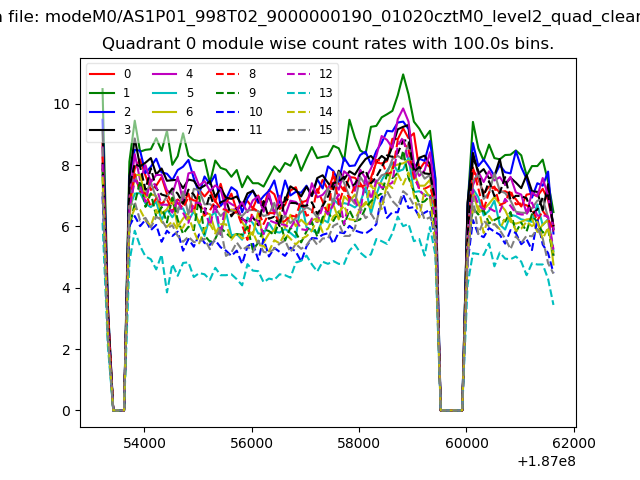 |
 |
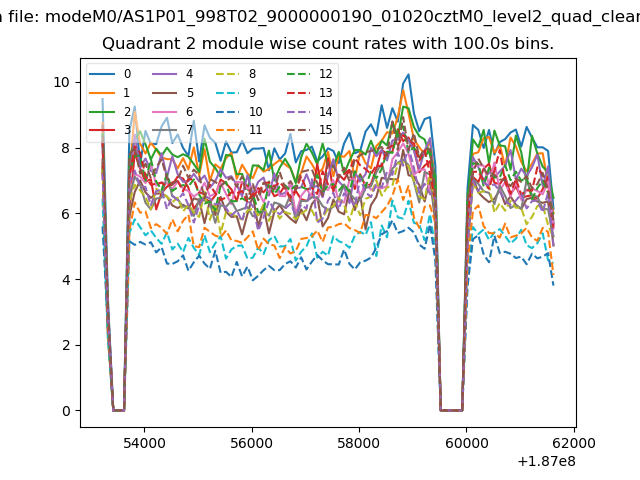
| Module-wise count rates for Quadrant B Data is divided into 100 sec bins |
 |
 |
| Module-wise count rates for Quadrant C Data is divided into 100 sec bins |
 |
 |
| Module-wise count rates for Quadrant D Data is divided into 100 sec bins |
 |
 |
| Parameter | Plot |
|---|---|
| CZT HV Monitor | 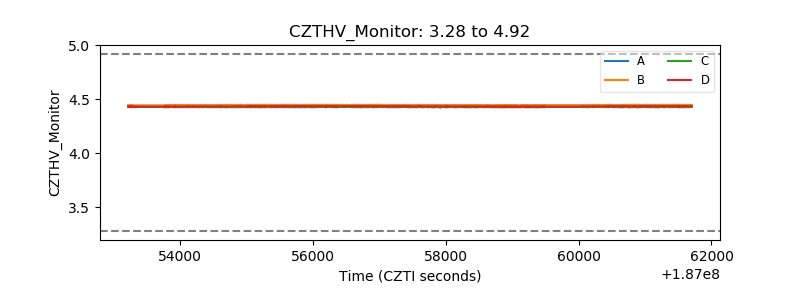 |
| D_VDD | 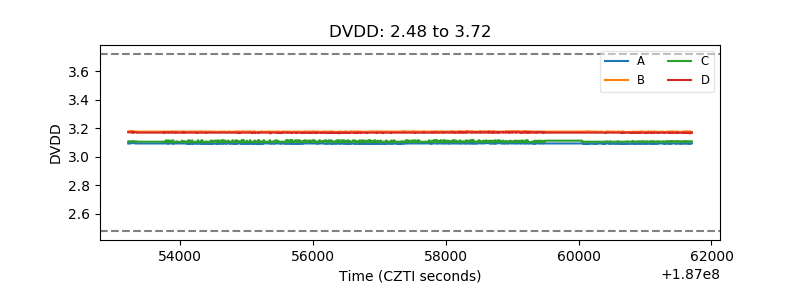 |
| Temperature 1 | 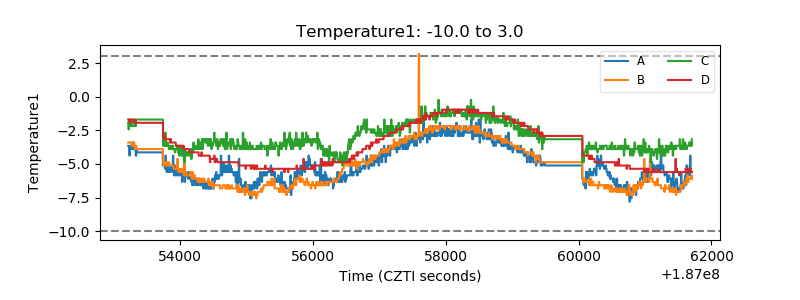 |
| Veto HV Monitor | 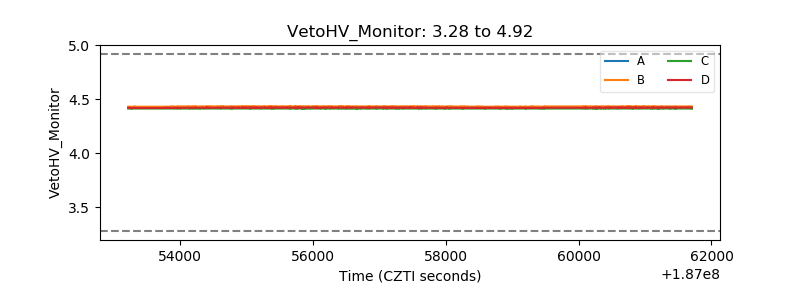 |
| Veto LLD | 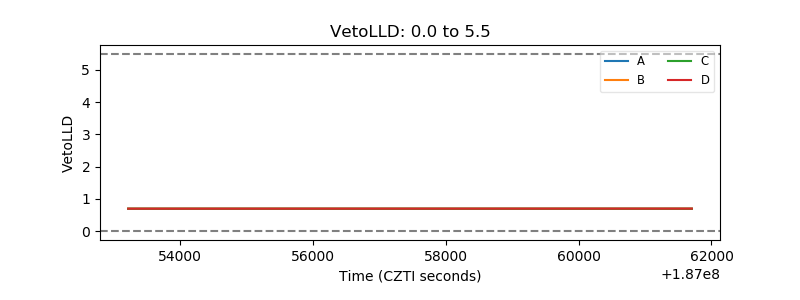 |
| Alpha Counter |  |
| _CPM_Rate | 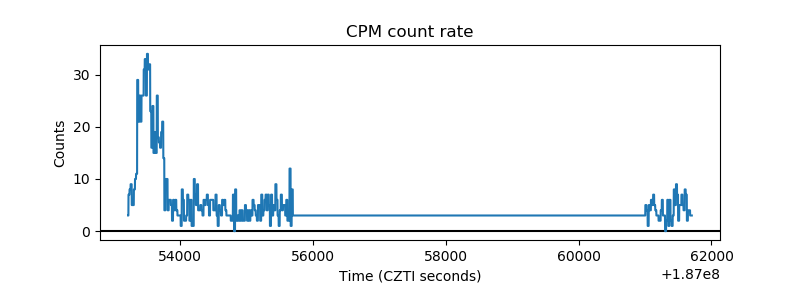 |
| CZT Counter | 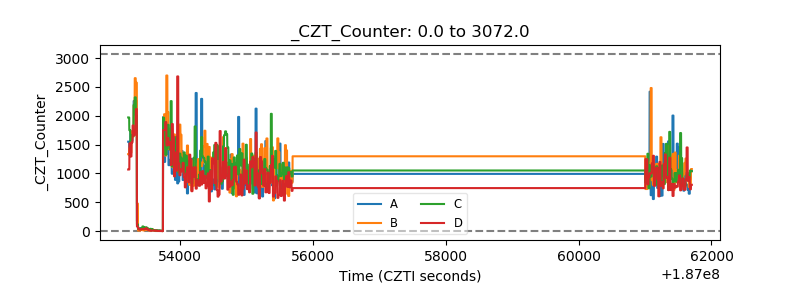 |
| +2.5 Volts monitor | 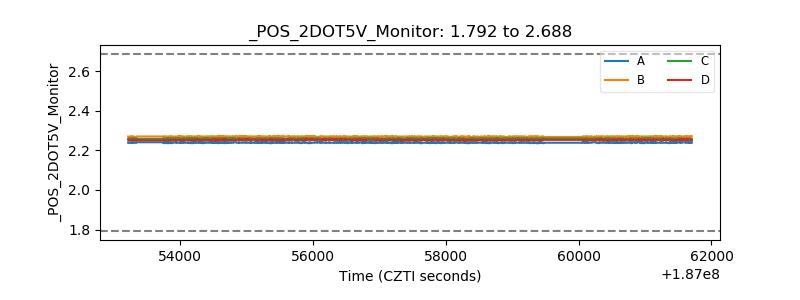 |
| +5 Volts monitor |  |
| _ROLL_ROT | 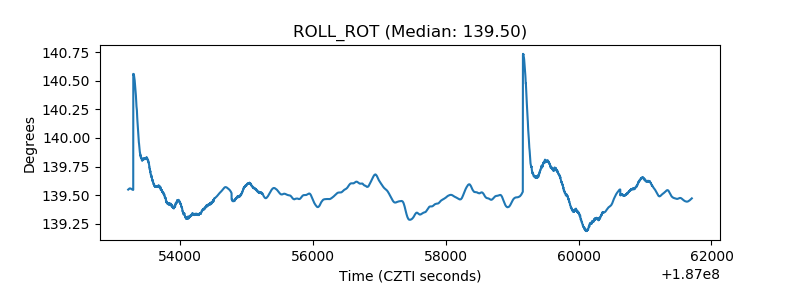 |
| _Roll_DEC | 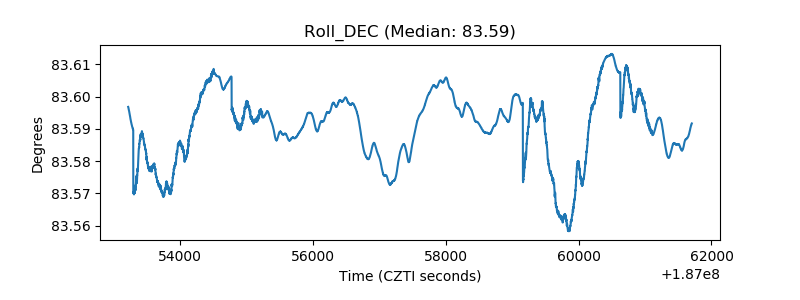 |
| _Roll_RA | 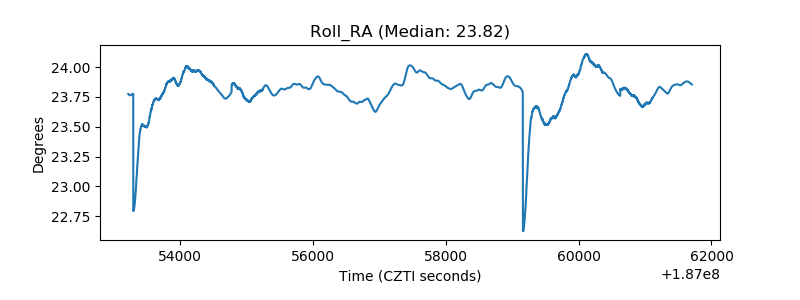 |
| Veto Counter | 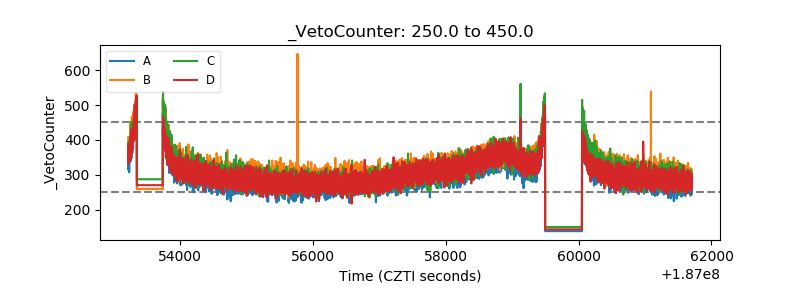 |