| Param | Original file | Final file |
|---|---|---|
| Filename | modeM0/AS1P01_998T02_9000000190_01022cztM0_level2.evt | modeM0/AS1P01_998T02_9000000190_01022cztM0_level2_quad_clean.evt |
| Size (bytes) | 947,206,080 | 103,510,080 |
| Size | 903.3 MB | 98.7 MB |
| Events in quadrant A | 7,157,740 | 680,007 |
| Events in quadrant B | 7,509,381 | 691,189 |
| Events in quadrant C | 7,136,169 | 670,575 |
| Events in quadrant D | 6,468,960 | 658,520 |
| Mode M0 | |||
|---|---|---|---|
| Quadrant | BADHDUFLAG | Total packets | Discarded packets |
| A | 0 | 25685 | 1 |
| B | 0 | 26700 | 1 |
| C | 0 | 25635 | 1 |
| D | 0 | 23691 | 1 |
| Mode SS | |||
|---|---|---|---|
| Quadrant | BADHDUFLAG | Total packets | Discarded packets |
| A | 0 | 126 | 0 |
| B | 0 | 126 | 0 |
| C | 0 | 126 | 0 |
| D | 0 | 128 | 0 |
| Mode M9 | |||
|---|---|---|---|
| Quadrant | BADHDUFLAG | Total packets | Discarded packets |
| A | 0 | 8 | 0 |
| B | 0 | 8 | 0 |
| C | 0 | 8 | 0 |
| D | 0 | 8 | 0 |
| Quadrant | Total seconds | Saturated seconds | Saturation percentage |
|---|---|---|---|
| A | 6228 | 3 | 0.048170% |
| B | 6228 | 12 | 0.192678% |
| C | 6228 | 1 | 0.016057% |
| D | 6228 | 15 | 0.240848% |
Noise dominated data is calculated using 1-second bins in cleaned event files. If a bin has >2000 counts, and if more than 50% of those come from <1% of pixels, then it is considered to be noise-dominated and hence unusable.
| Quadrant | # 1 sec bins | Bins with >0 counts | Bins with >2000 counts | High rate bins dominated by noise | Noise dominated (total time) | Noise dominated (detector-on time) | Marked lightcurve |
|---|---|---|---|---|---|---|---|
| A | 7098 | 6229 | 105 | 105 | 1.48% | 1.69% | 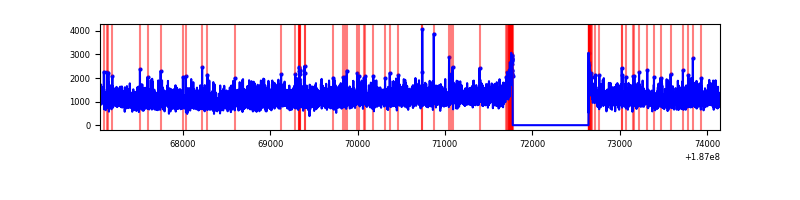 |
| B | 7098 | 6229 | 160 | 160 | 2.25% | 2.57% | 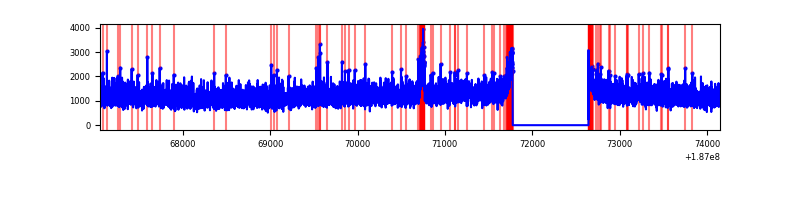 |
| C | 7098 | 6229 | 92 | 92 | 1.30% | 1.48% | 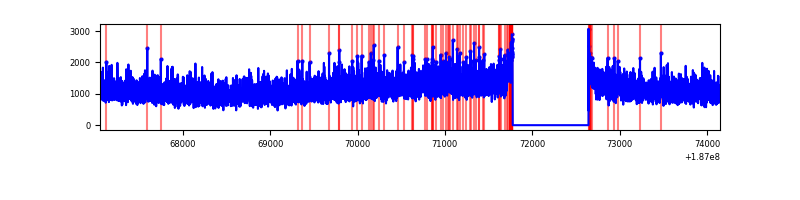 |
| D | 7098 | 6229 | 108 | 108 | 1.52% | 1.73% | 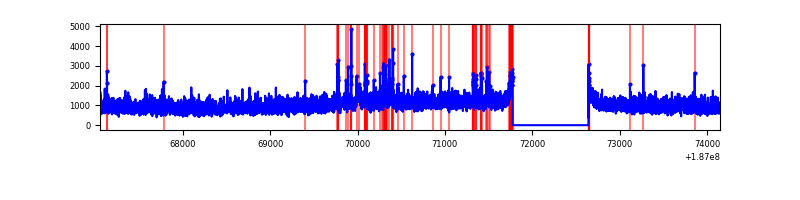 |
Top three noisy pixels from each quadrant. If the there are fewer than three noisy pixels in the level2.evt file, extra rows are filled as -1
| Pixel properties | Quadrant properties | ||||||
|---|---|---|---|---|---|---|---|
| Quadrant | DetID | PixID | Counts | Sigma | Mean | Median | Sigma |
| A | 4 | 32 | 37179 | 79.66 | 1847 | 1860 | 443.3 |
| A | 12 | 243 | 18017 | 36.44 | 1847 | 1860 | 443.3 |
| A | 12 | 189 | 14547 | 28.62 | 1847 | 1860 | 443.3 |
| B | 0 | 191 | 61488 | 129.79 | 1937 | 1945 | 458.8 |
| B | 15 | 22 | 22898 | 45.67 | 1937 | 1945 | 458.8 |
| B | 5 | 249 | 21602 | 42.85 | 1937 | 1945 | 458.8 |
| C | 15 | 241 | 311044 | 640.61 | 1732 | 1794 | 482.7 |
| C | 3 | 111 | 27280 | 52.79 | 1732 | 1794 | 482.7 |
| C | 3 | 79 | 23212 | 44.37 | 1732 | 1794 | 482.7 |
| D | 1 | 83 | 173979 | 334.84 | 1669 | 1732 | 514.4 |
| D | 9 | 64 | 17190 | 30.05 | 1669 | 1732 | 514.4 |
| D | 2 | 253 | 15270 | 26.32 | 1669 | 1732 | 514.4 |
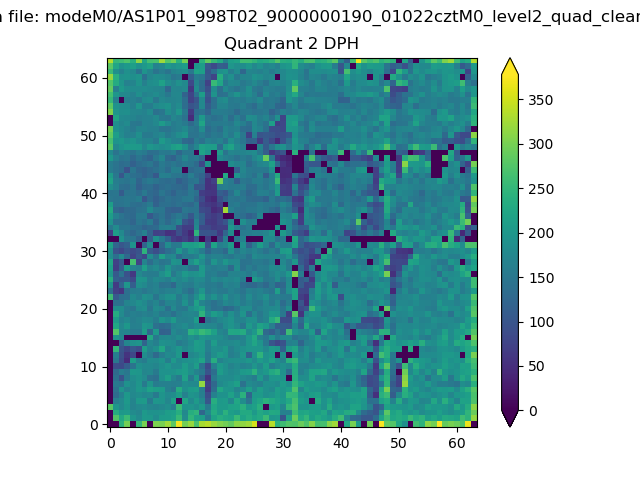
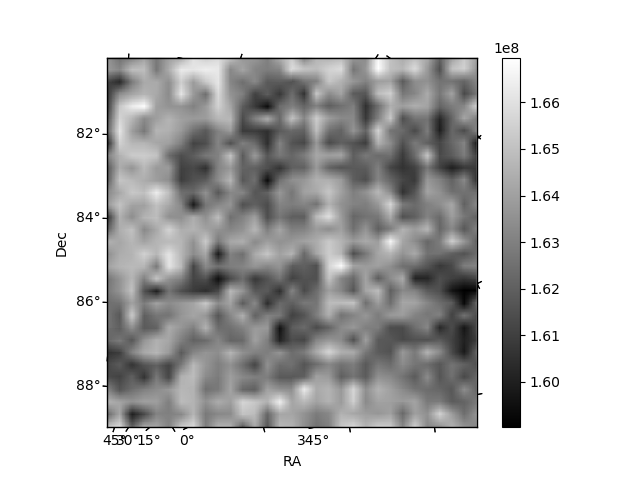
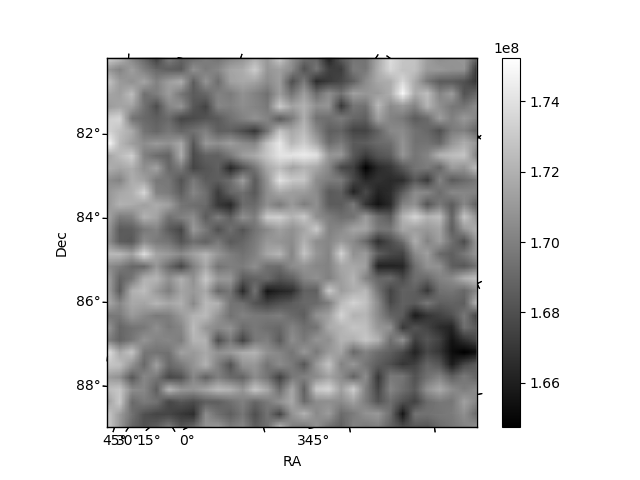
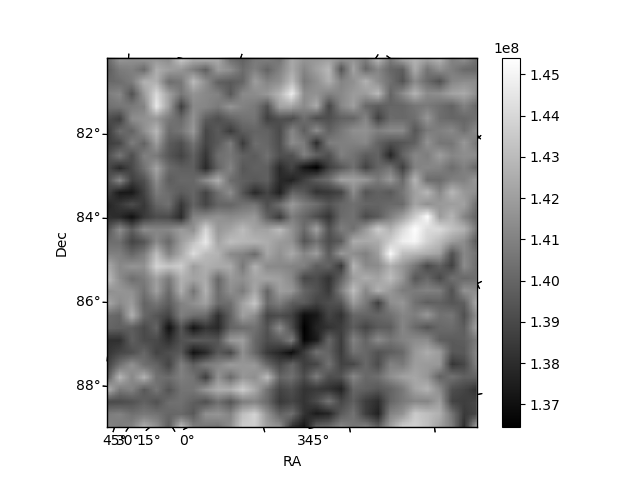
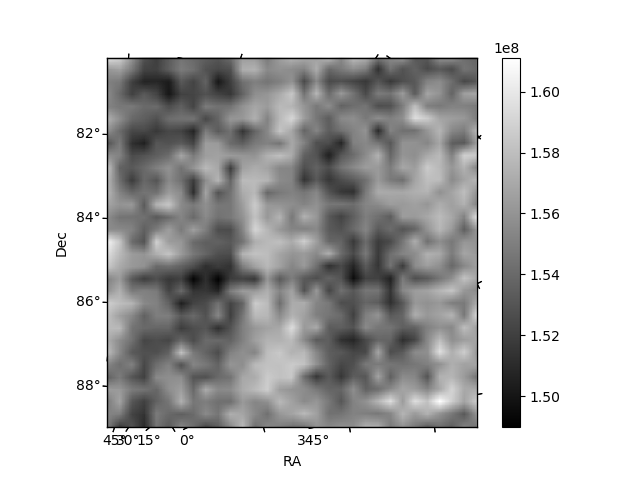
Histogram calculated using DETX and DETY for each event in the final _common_clean file
| Quadrant A |  |
 |
Quadrant B |
|---|---|---|---|
| Quadrant D | 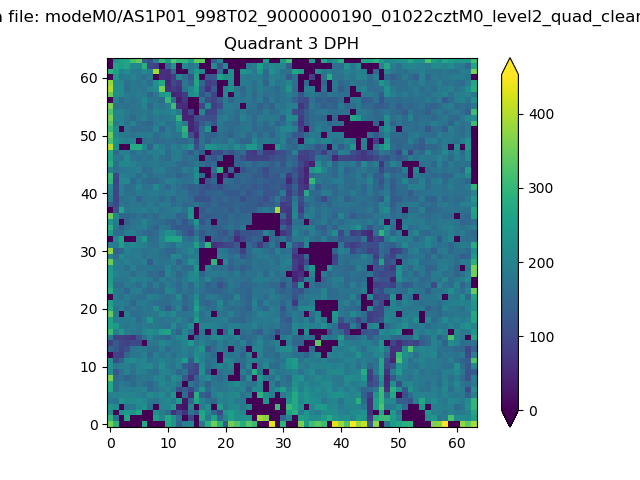 |
 |
Quadrant C |
| Plot type | Count rate plots | Images |
|---|---|---|
| Comparison with Poisson distribution Blue bars denote a histogram of data divided into 1 sec bins. Red curve is a Poisson curve with rate = median count rate of data. |
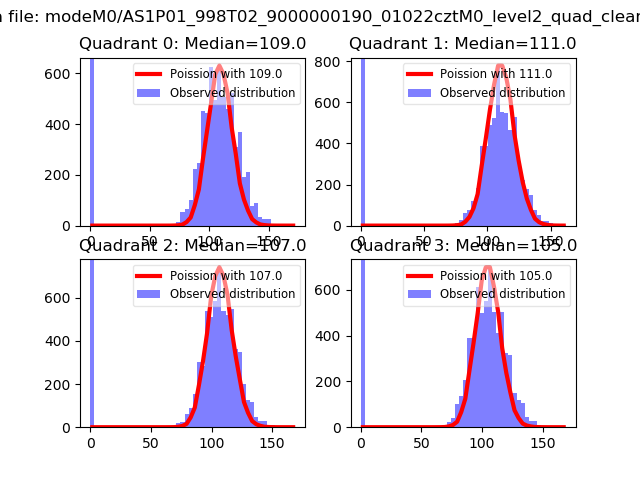 |
 |
| Quadrant-wise count rates Data is divided into 100 sec bins |
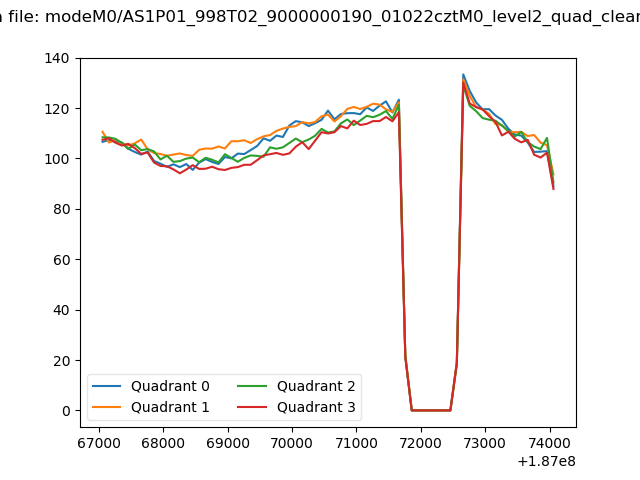 |
|
| Module-wise count rates for Quadrant A Data is divided into 100 sec bins |
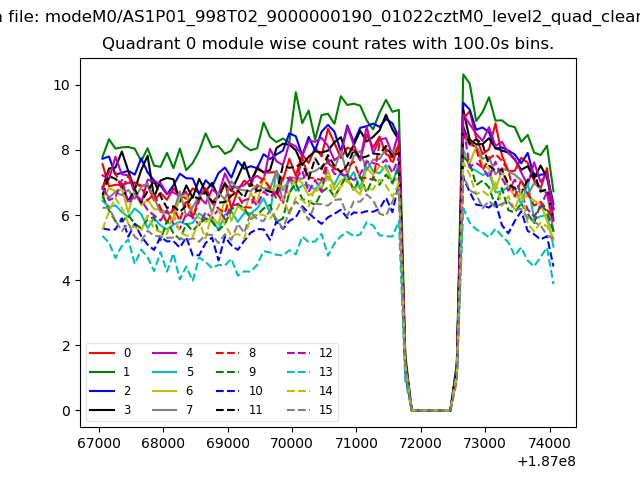 |
 |
| Module-wise count rates for Quadrant B Data is divided into 100 sec bins |
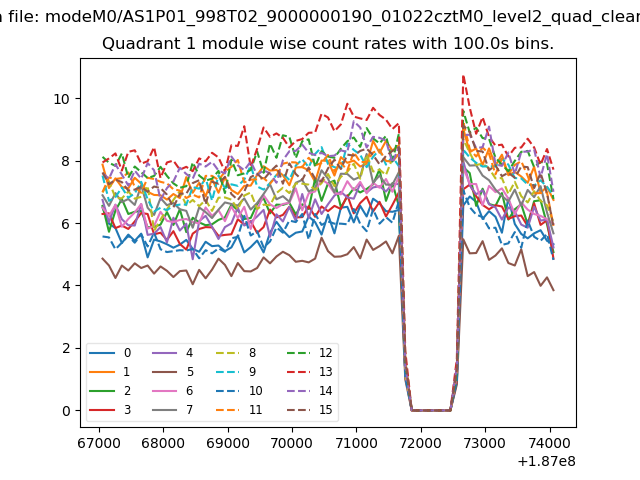 |
 |
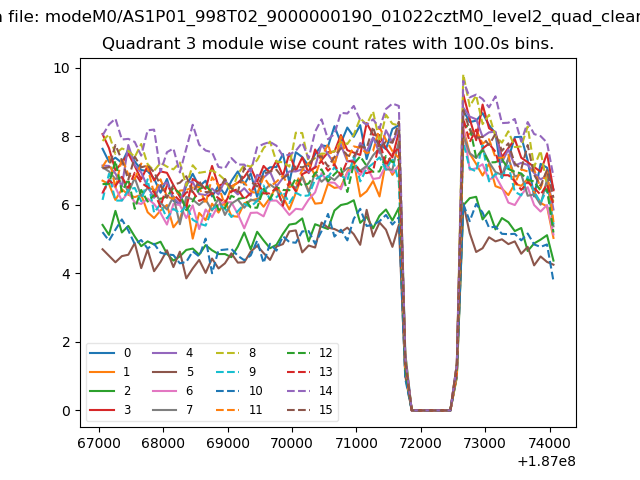
| Module-wise count rates for Quadrant C Data is divided into 100 sec bins |
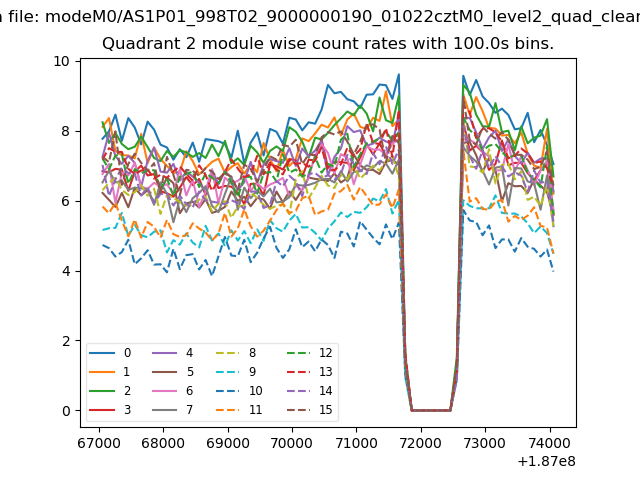 |
 |
| Module-wise count rates for Quadrant D Data is divided into 100 sec bins |
 |
 |
| Parameter | Plot |
|---|---|
| CZT HV Monitor | 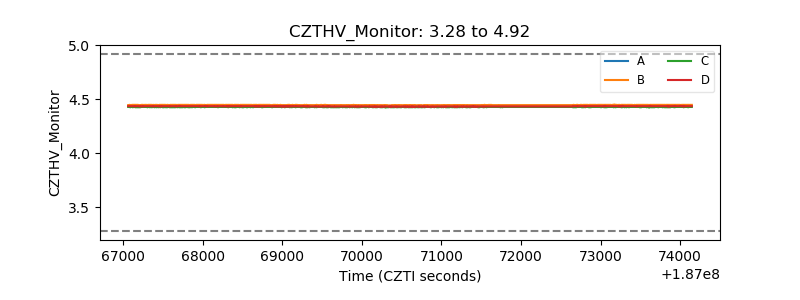 |
| D_VDD | 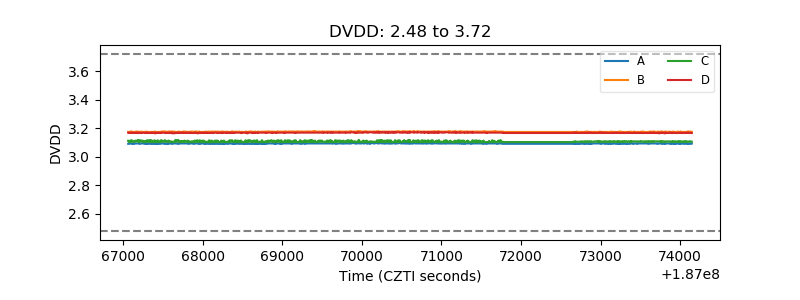 |
| Temperature 1 | 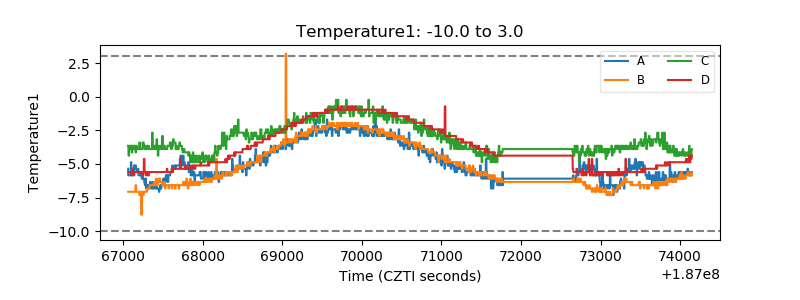 |
| Veto HV Monitor | 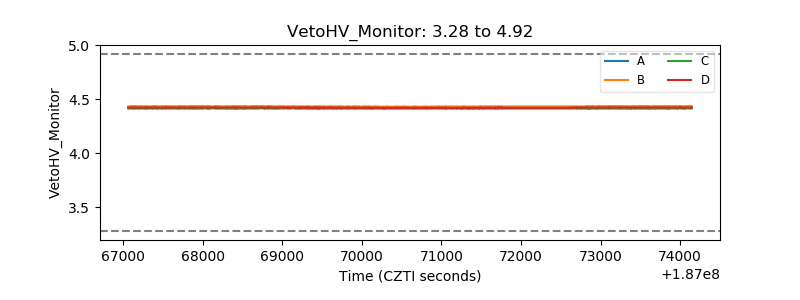 |
| Veto LLD | 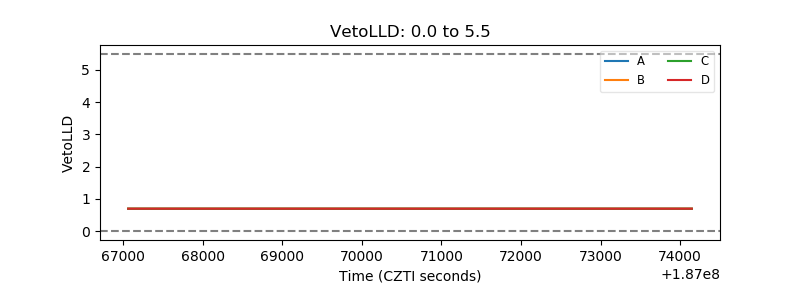 |
| Alpha Counter | 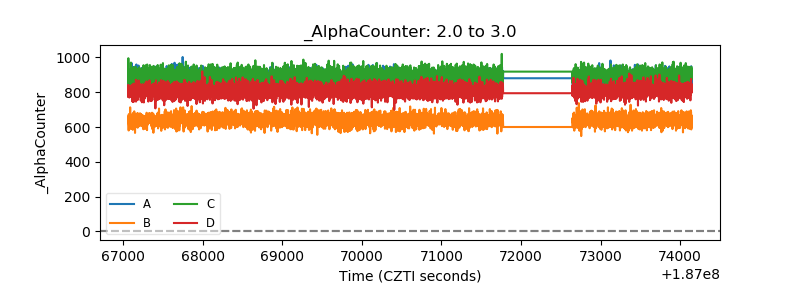 |
| _CPM_Rate | 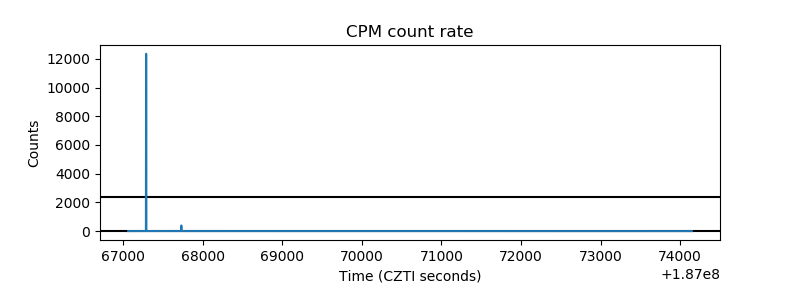 |
| CZT Counter | 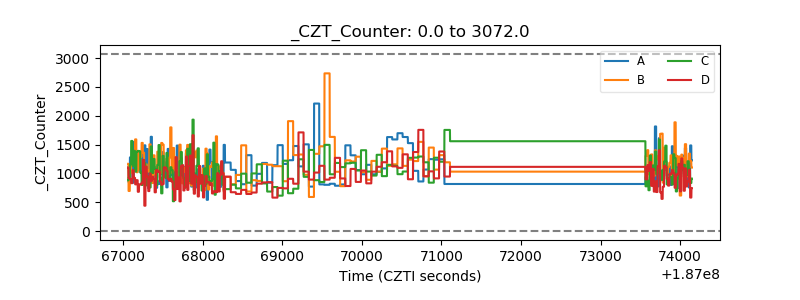 |
| +2.5 Volts monitor | 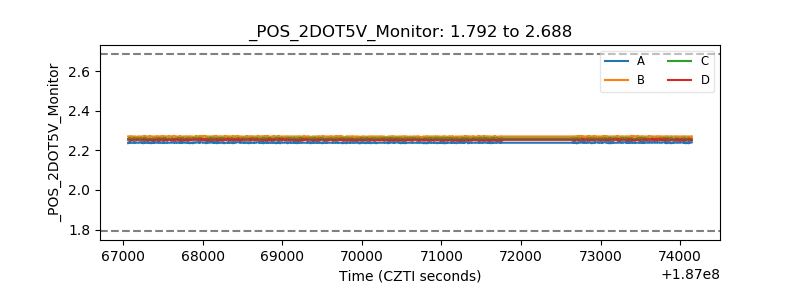 |
| +5 Volts monitor |  |
| _ROLL_ROT | 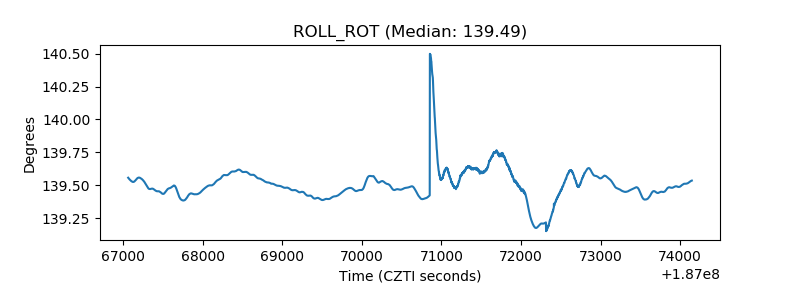 |
| _Roll_DEC | 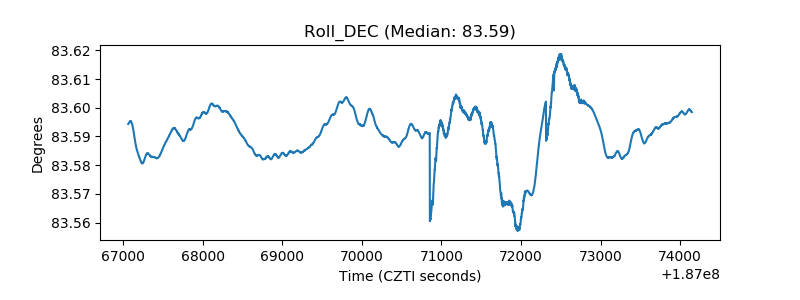 |
| _Roll_RA | 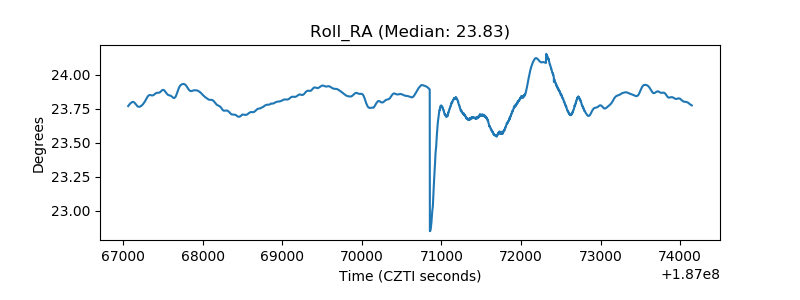 |
| Veto Counter | 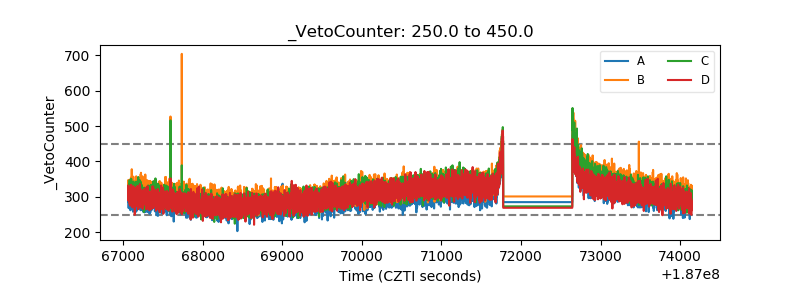 |