| Param | Original file | Final file |
|---|---|---|
| Filename | modeM0/AS1P01_998T02_9000000190_01023cztM0_level2.evt | modeM0/AS1P01_998T02_9000000190_01023cztM0_level2_quad_clean.evt |
| Size (bytes) | 1,107,768,960 | 97,992,000 |
| Size | 1.0 GB | 93.5 MB |
| Events in quadrant A | 7,209,390 | 694,263 |
| Events in quadrant B | 7,464,461 | 703,426 |
| Events in quadrant C | 7,099,920 | 677,328 |
| Events in quadrant D | 11,365,315 | 460,311 |
| Mode M0 | |||
|---|---|---|---|
| Quadrant | BADHDUFLAG | Total packets | Discarded packets |
| A | 0 | 25813 | 3 |
| B | 0 | 26580 | 1 |
| C | 0 | 25477 | 1 |
| D | 0 | 38495 | 1 |
| Mode SS | |||
|---|---|---|---|
| Quadrant | BADHDUFLAG | Total packets | Discarded packets |
| A | 0 | 124 | 0 |
| B | 0 | 124 | 0 |
| C | 0 | 124 | 0 |
| D | 0 | 124 | 0 |
| Mode M9 | |||
|---|---|---|---|
| Quadrant | BADHDUFLAG | Total packets | Discarded packets |
| A | 0 | 10 | 0 |
| B | 0 | 10 | 0 |
| C | 0 | 10 | 0 |
| D | 0 | 10 | 0 |
| Quadrant | Total seconds | Saturated seconds | Saturation percentage |
|---|---|---|---|
| A | 6182 | 19 | 0.307344% |
| B | 6182 | 23 | 0.372048% |
| C | 6182 | 10 | 0.161760% |
| D | 6183 | 2168 | 35.063885% |
Noise dominated data is calculated using 1-second bins in cleaned event files. If a bin has >2000 counts, and if more than 50% of those come from <1% of pixels, then it is considered to be noise-dominated and hence unusable.
| Quadrant | # 1 sec bins | Bins with >0 counts | Bins with >2000 counts | High rate bins dominated by noise | Noise dominated (total time) | Noise dominated (detector-on time) | Marked lightcurve |
|---|---|---|---|---|---|---|---|
| A | 7183 | 6184 | 130 | 130 | 1.81% | 2.10% | 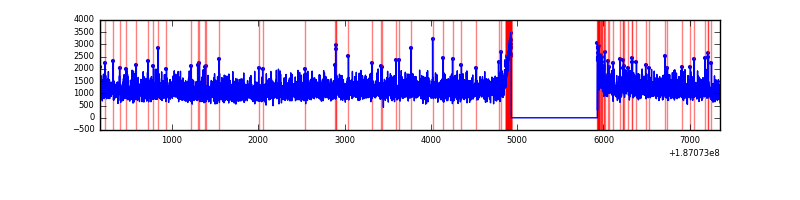 |
| B | 7183 | 6184 | 155 | 155 | 2.16% | 2.51% | 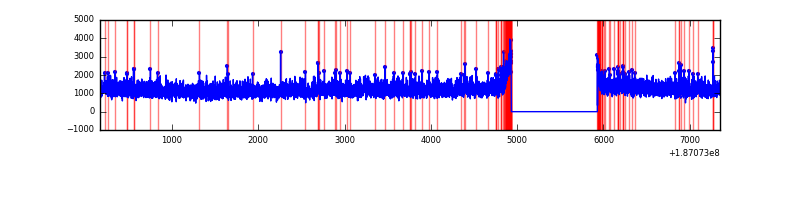 |
| C | 7183 | 6184 | 97 | 97 | 1.35% | 1.57% | 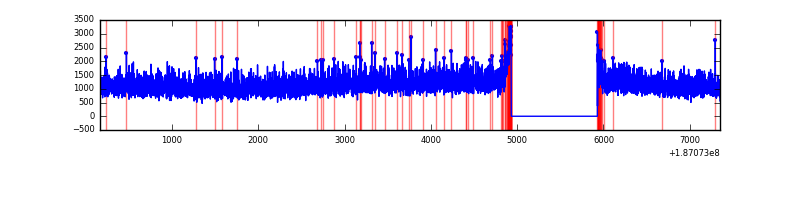 |
| D | 7184 | 6184 | 2312 | 2312 | 32.18% | 37.39% | 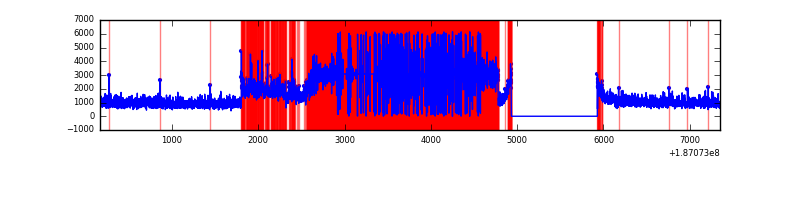 |
Top three noisy pixels from each quadrant. If the there are fewer than three noisy pixels in the level2.evt file, extra rows are filled as -1
| Pixel properties | Quadrant properties | ||||||
|---|---|---|---|---|---|---|---|
| Quadrant | DetID | PixID | Counts | Sigma | Mean | Median | Sigma |
| A | 13 | 34 | 15335 | 30.14 | 1867 | 1887 | 446.2 |
| A | 12 | 189 | 12665 | 24.15 | 1867 | 1887 | 446.2 |
| A | 4 | 32 | 11356 | 21.22 | 1867 | 1887 | 446.2 |
| B | 5 | 249 | 26625 | 53.85 | 1934 | 1946 | 458.3 |
| B | 15 | 22 | 25980 | 52.45 | 1934 | 1946 | 458.3 |
| B | 15 | 85 | 14359 | 27.09 | 1934 | 1946 | 458.3 |
| C | 15 | 241 | 307826 | 632.02 | 1726 | 1782 | 484.2 |
| C | 3 | 111 | 24471 | 46.86 | 1726 | 1782 | 484.2 |
| C | 3 | 79 | 23962 | 45.8 | 1726 | 1782 | 484.2 |
| D | 12 | 22 | 6763260 | 17954.85 | 1215 | 1258 | 376.6 |
| D | 1 | 83 | 43963 | 113.39 | 1215 | 1258 | 376.6 |
| D | 2 | 63 | 6727 | 14.52 | 1215 | 1258 | 376.6 |
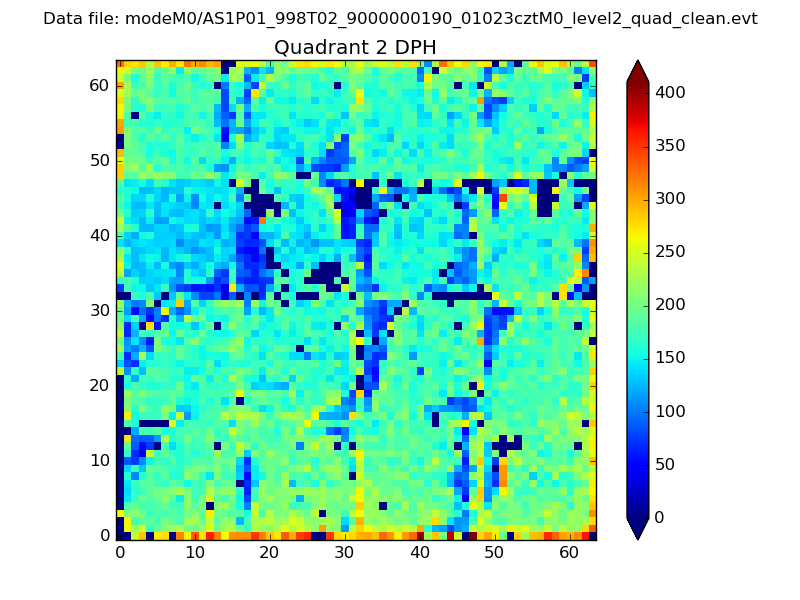
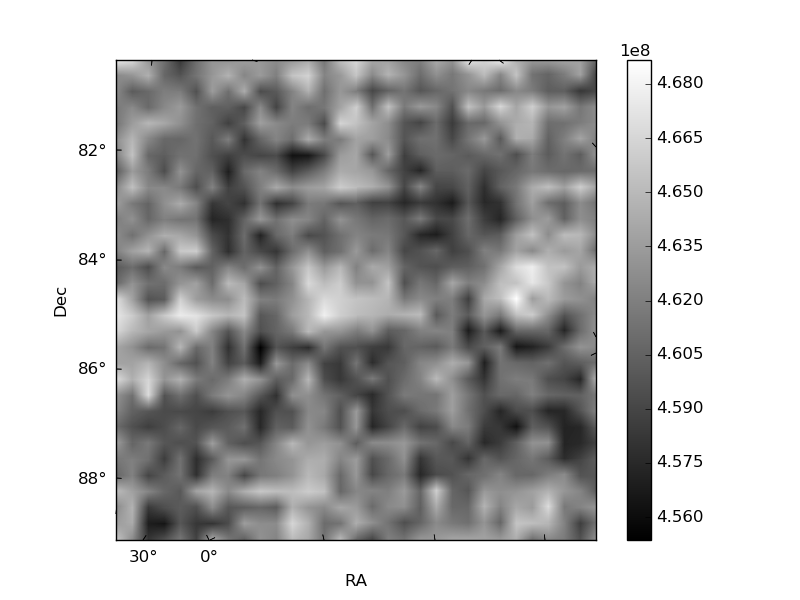
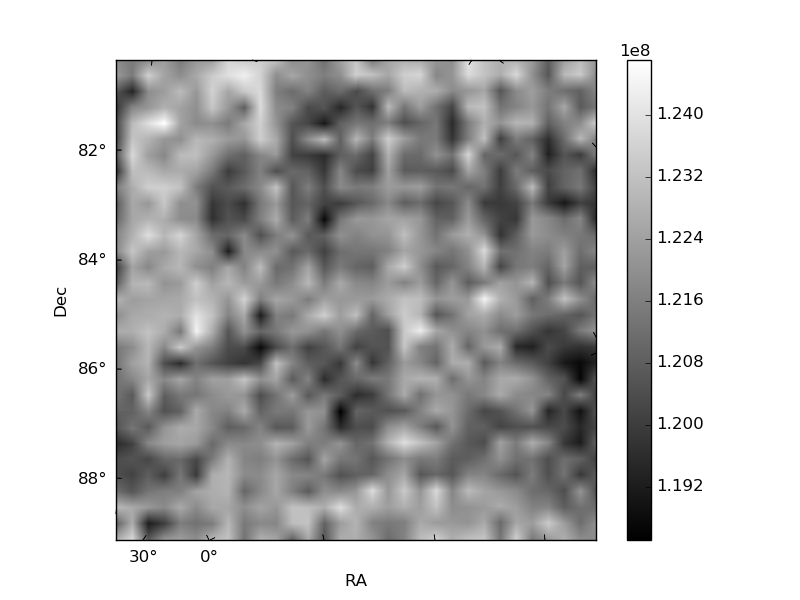
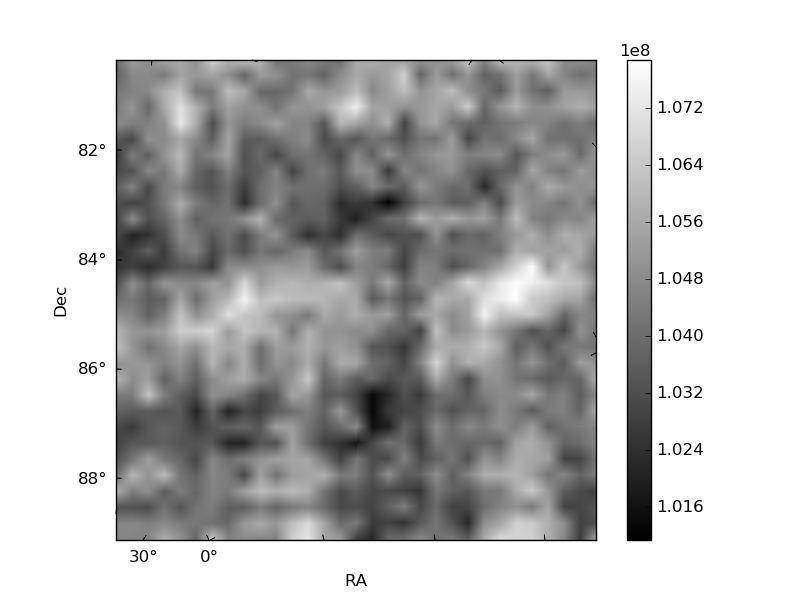
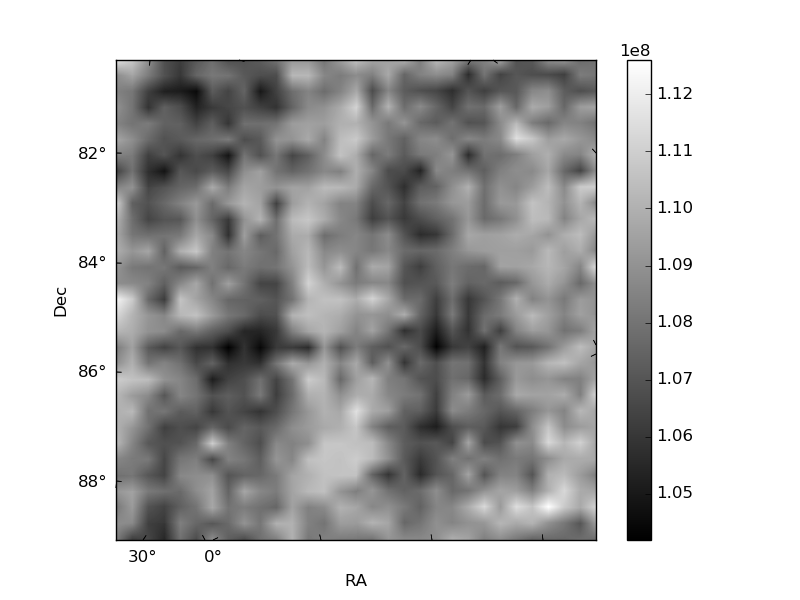
Histogram calculated using DETX and DETY for each event in the final _common_clean file
| Quadrant A | 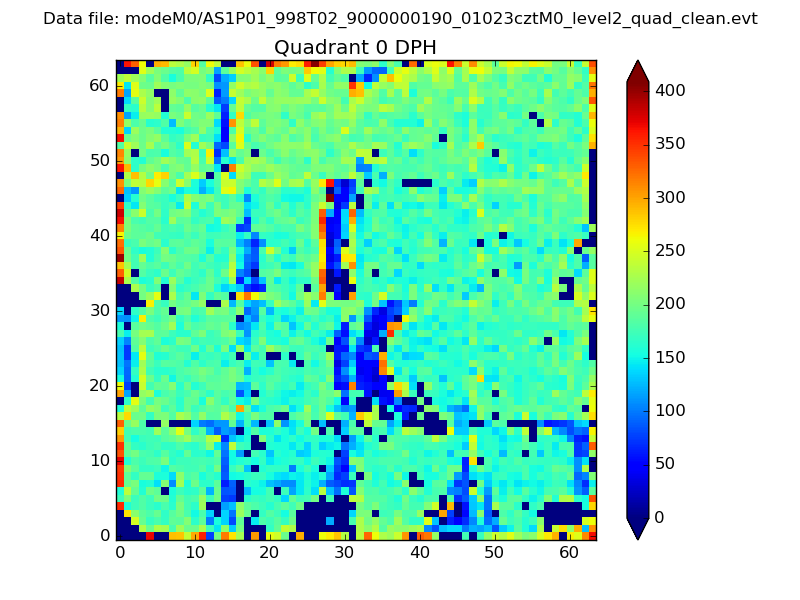 |
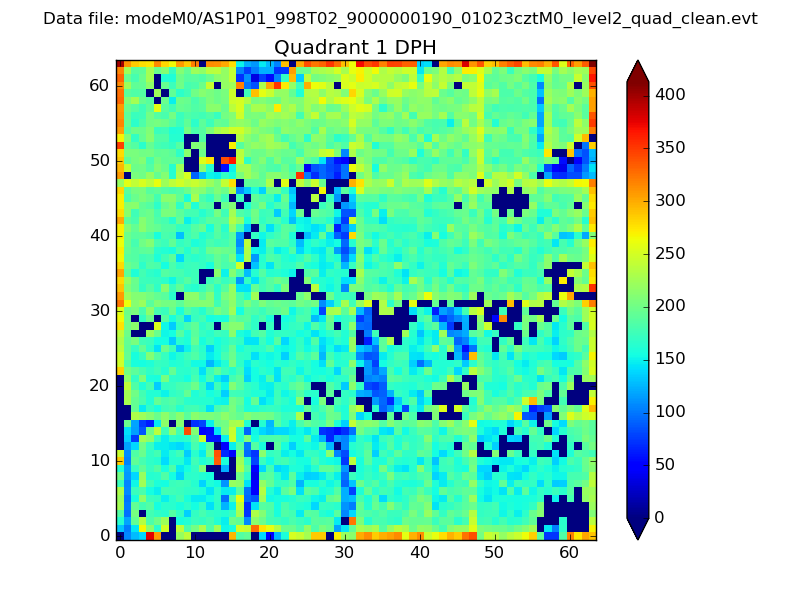 |
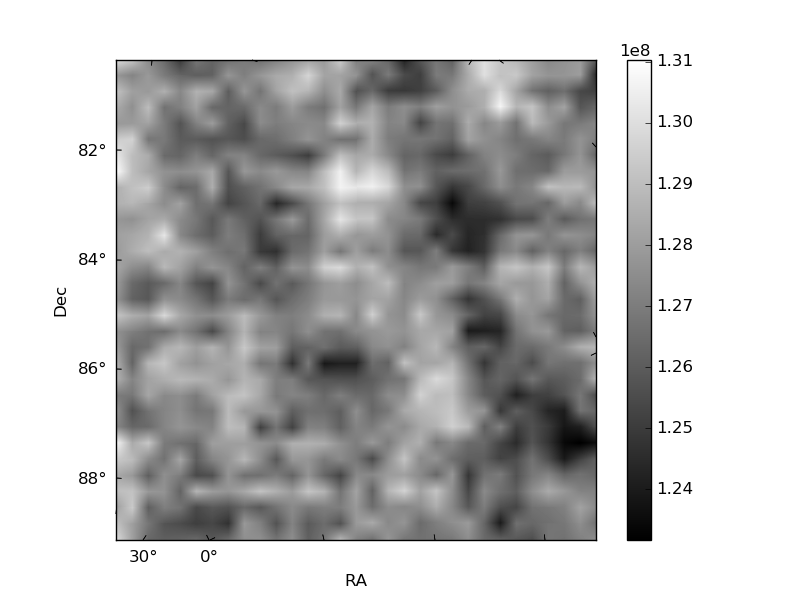
Quadrant B |
|---|---|---|---|
| Quadrant D | 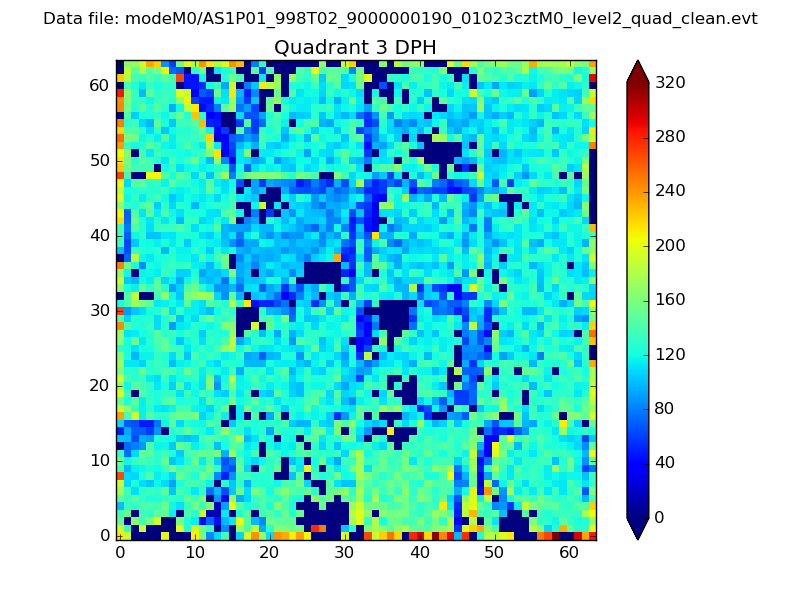 |
 |
Quadrant C |
| Plot type | Count rate plots | Images |
|---|---|---|
| Comparison with Poisson distribution Blue bars denote a histogram of data divided into 1 sec bins. Red curve is a Poisson curve with rate = median count rate of data. |
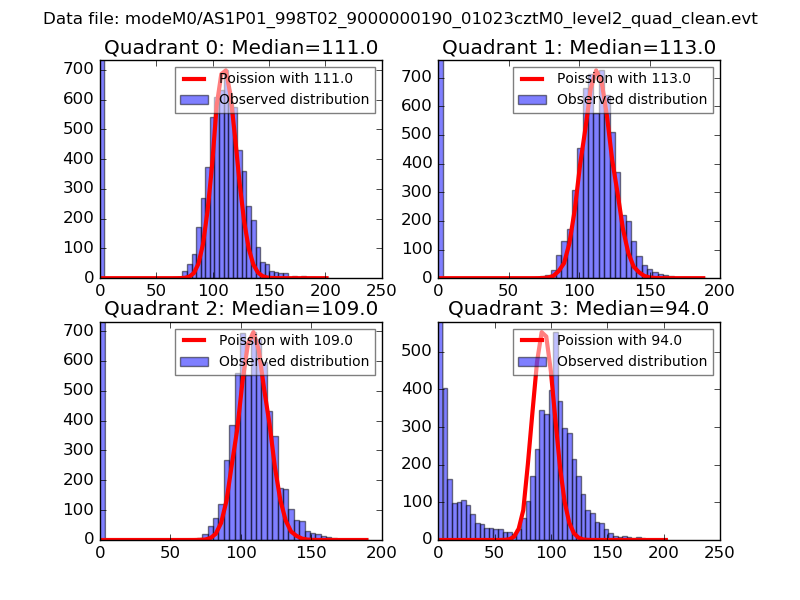 |
 |
| Quadrant-wise count rates Data is divided into 100 sec bins |
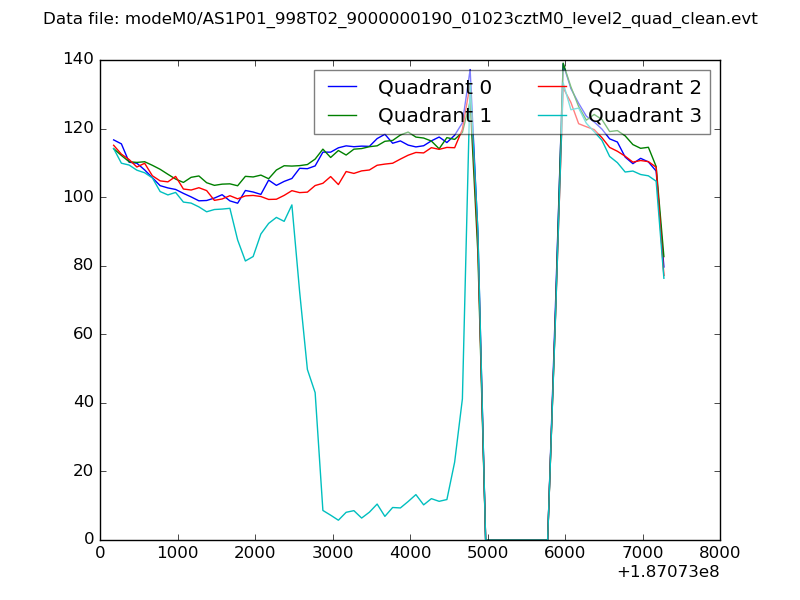 |
|
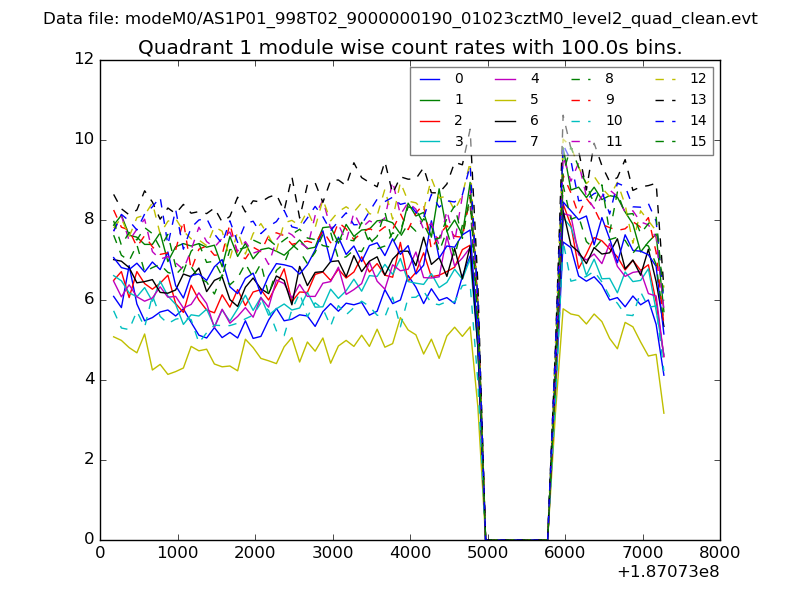
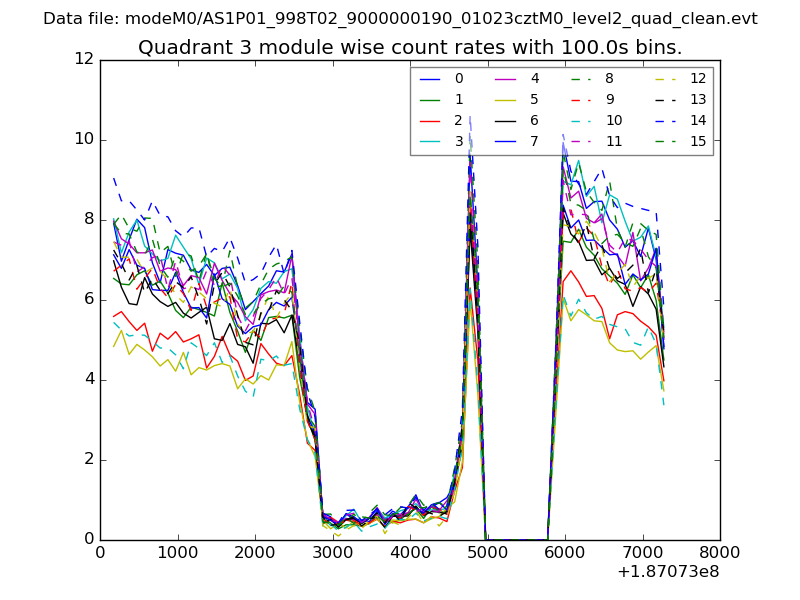
| Module-wise count rates for Quadrant A Data is divided into 100 sec bins |
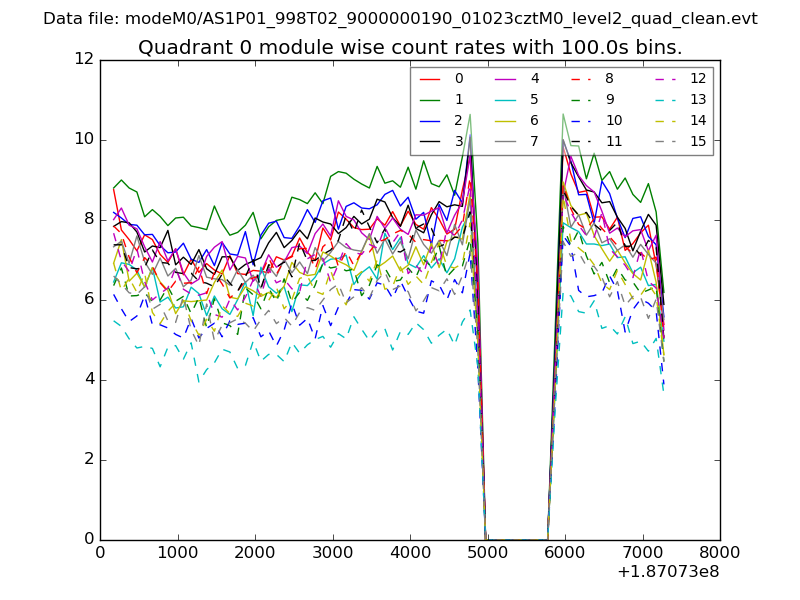 |
 |
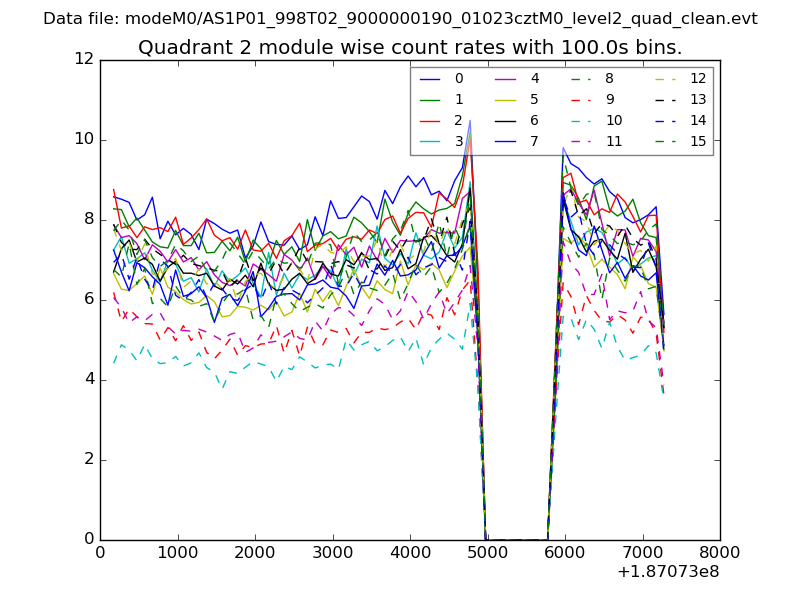
| Module-wise count rates for Quadrant B Data is divided into 100 sec bins |
 |
 |
| Module-wise count rates for Quadrant C Data is divided into 100 sec bins |
 |
 |
| Module-wise count rates for Quadrant D Data is divided into 100 sec bins |
 |
 |
| Parameter | Plot |
|---|---|
| CZT HV Monitor | 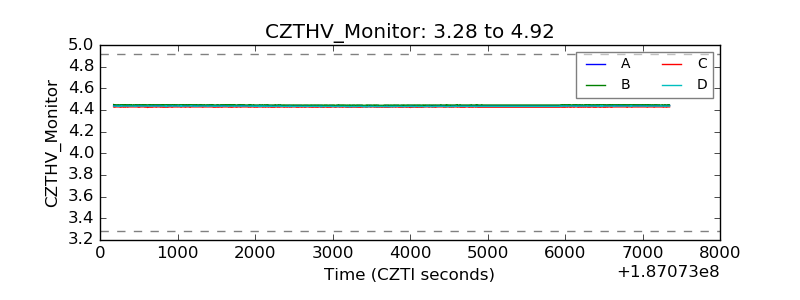 |
| D_VDD | 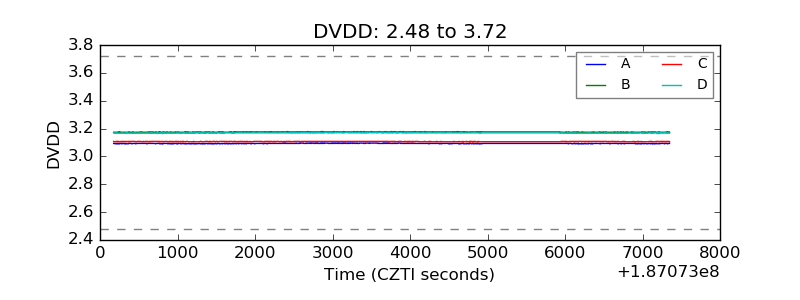 |
| Temperature 1 | 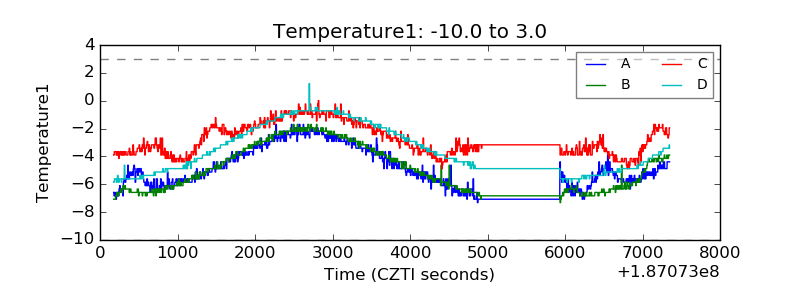 |
| Veto HV Monitor | 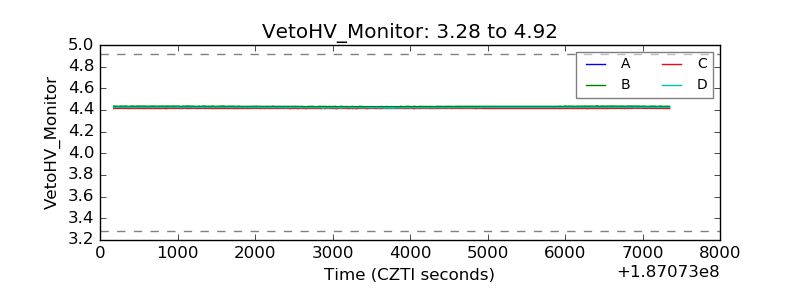 |
| Veto LLD | 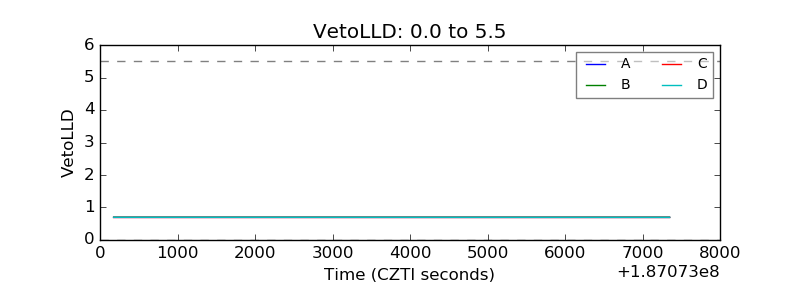 |
| Alpha Counter | 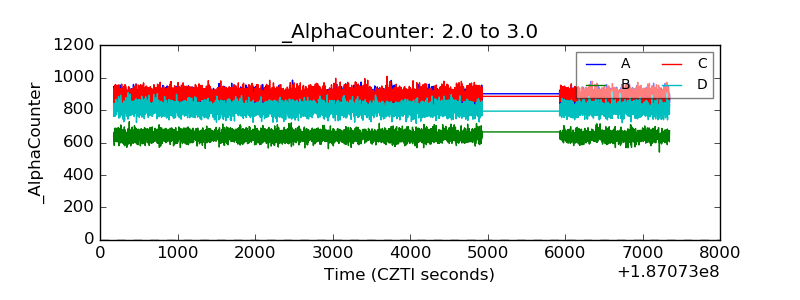 |
| _CPM_Rate | 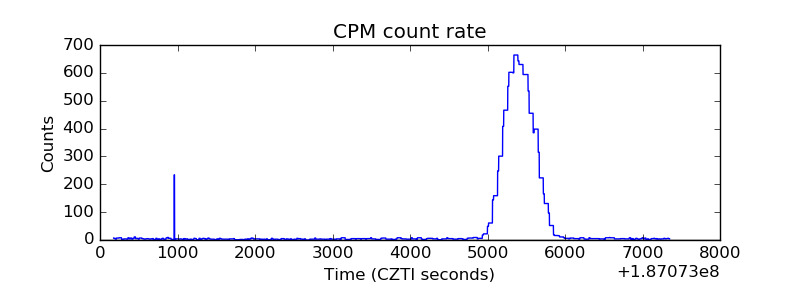 |
| CZT Counter | 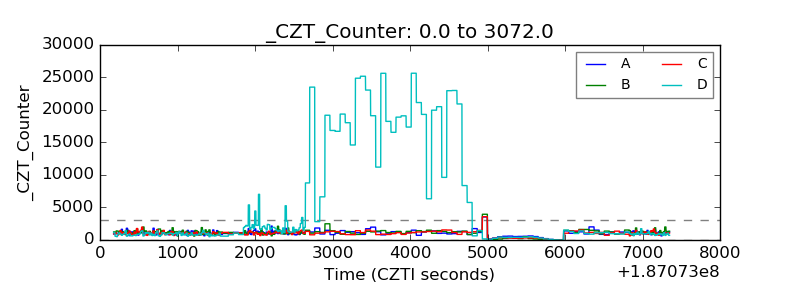 |
| +2.5 Volts monitor |  |
| +5 Volts monitor |  |
| _ROLL_ROT | 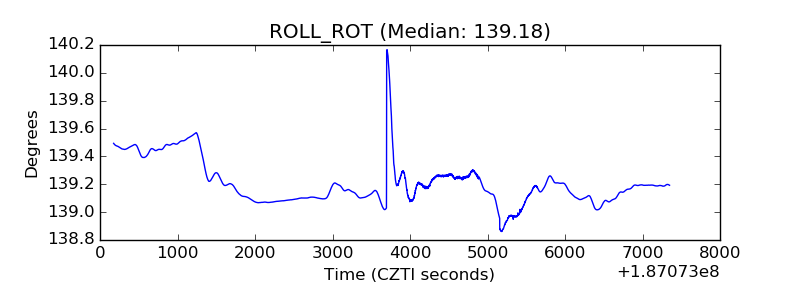 |
| _Roll_DEC | 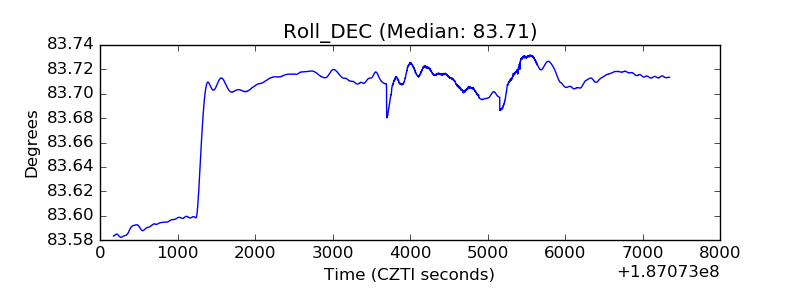 |
| _Roll_RA | 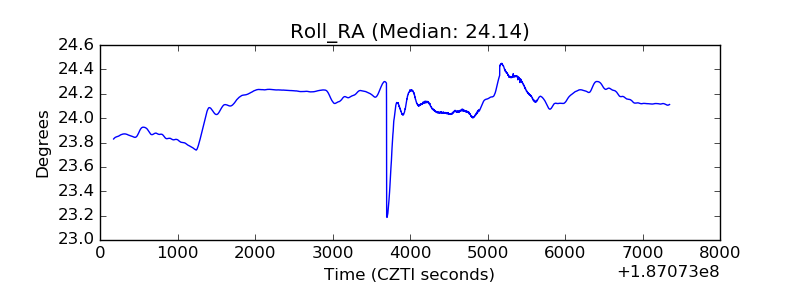 |
| Veto Counter | 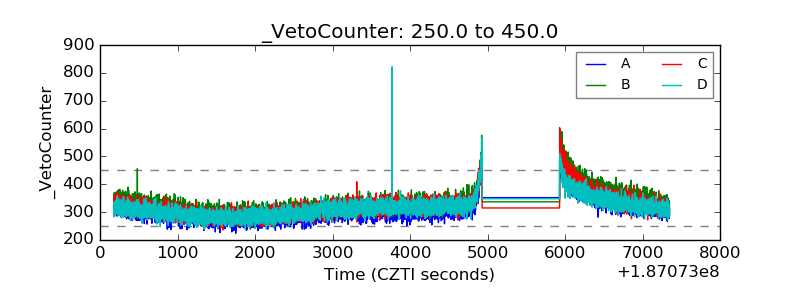 |