| Param | Original file | Final file |
|---|---|---|
| Filename | modeM0/AS1P01_998T02_9000000190_01026cztM0_level2.evt | modeM0/AS1P01_998T02_9000000190_01026cztM0_level2_quad_clean.evt |
| Size (bytes) | 972,599,040 | 109,290,240 |
| Size | 927.5 MB | 104.2 MB |
| Events in quadrant A | 7,294,320 | 738,690 |
| Events in quadrant B | 7,577,212 | 745,052 |
| Events in quadrant C | 7,321,648 | 706,696 |
| Events in quadrant D | 6,855,225 | 691,663 |
| Mode M0 | |||
|---|---|---|---|
| Quadrant | BADHDUFLAG | Total packets | Discarded packets |
| A | 0 | 25984 | 1 |
| B | 0 | 26846 | 1 |
| C | 0 | 26085 | 1 |
| D | 0 | 24728 | 1 |
| Mode SS | |||
|---|---|---|---|
| Quadrant | BADHDUFLAG | Total packets | Discarded packets |
| A | 0 | 126 | 0 |
| B | 0 | 126 | 0 |
| C | 0 | 126 | 0 |
| D | 0 | 126 | 0 |
| Mode M9 | |||
|---|---|---|---|
| Quadrant | BADHDUFLAG | Total packets | Discarded packets |
| A | 0 | 11 | 0 |
| B | 0 | 11 | 0 |
| C | 0 | 11 | 0 |
| D | 0 | 11 | 0 |
| Quadrant | Total seconds | Saturated seconds | Saturation percentage |
|---|---|---|---|
| A | 6124 | 24 | 0.391901% |
| B | 6124 | 44 | 0.718485% |
| C | 6125 | 24 | 0.391837% |
| D | 6125 | 102 | 1.665306% |
Noise dominated data is calculated using 1-second bins in cleaned event files. If a bin has >2000 counts, and if more than 50% of those come from <1% of pixels, then it is considered to be noise-dominated and hence unusable.
| Quadrant | # 1 sec bins | Bins with >0 counts | Bins with >2000 counts | High rate bins dominated by noise | Noise dominated (total time) | Noise dominated (detector-on time) | Marked lightcurve |
|---|---|---|---|---|---|---|---|
| A | 7299 | 6125 | 174 | 174 | 2.38% | 2.84% | 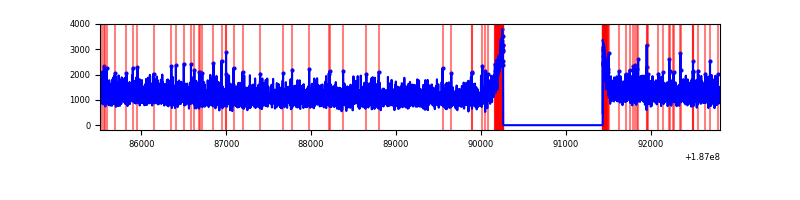 |
| B | 7299 | 6125 | 206 | 206 | 2.82% | 3.36% | 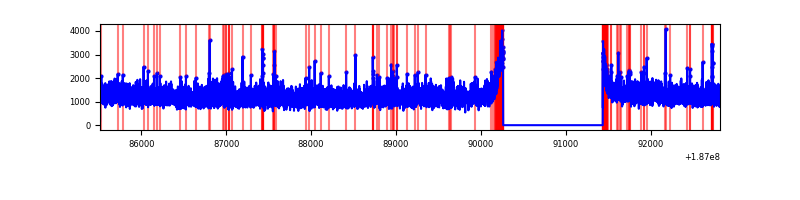 |
| C | 7300 | 6126 | 172 | 172 | 2.36% | 2.81% | 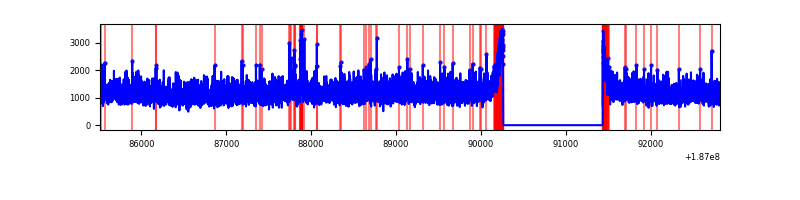 |
| D | 7300 | 6126 | 175 | 175 | 2.40% | 2.86% | 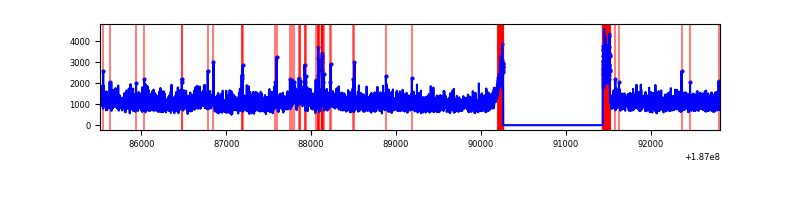 |
Top three noisy pixels from each quadrant. If the there are fewer than three noisy pixels in the level2.evt file, extra rows are filled as -1
| Pixel properties | Quadrant properties | ||||||
|---|---|---|---|---|---|---|---|
| Quadrant | DetID | PixID | Counts | Sigma | Mean | Median | Sigma |
| A | 11 | 242 | 13444 | 25.72 | 1892 | 1900 | 448.9 |
| A | 4 | 32 | 12691 | 24.04 | 1892 | 1900 | 448.9 |
| A | 0 | 253 | 12632 | 23.91 | 1892 | 1900 | 448.9 |
| B | 5 | 249 | 57319 | 120.54 | 1941 | 1950 | 459.3 |
| B | 15 | 85 | 29460 | 59.89 | 1941 | 1950 | 459.3 |
| B | 8 | 234 | 25826 | 51.98 | 1941 | 1950 | 459.3 |
| C | 15 | 241 | 286171 | 583.29 | 1753 | 1814 | 487.5 |
| C | 8 | 208 | 127185 | 257.17 | 1753 | 1814 | 487.5 |
| C | 3 | 111 | 22152 | 41.72 | 1753 | 1814 | 487.5 |
| D | 12 | 22 | 295470 | 563.51 | 1696 | 1754 | 521.2 |
| D | 10 | 85 | 181515 | 344.88 | 1696 | 1754 | 521.2 |
| D | 9 | 64 | 27396 | 49.2 | 1696 | 1754 | 521.2 |
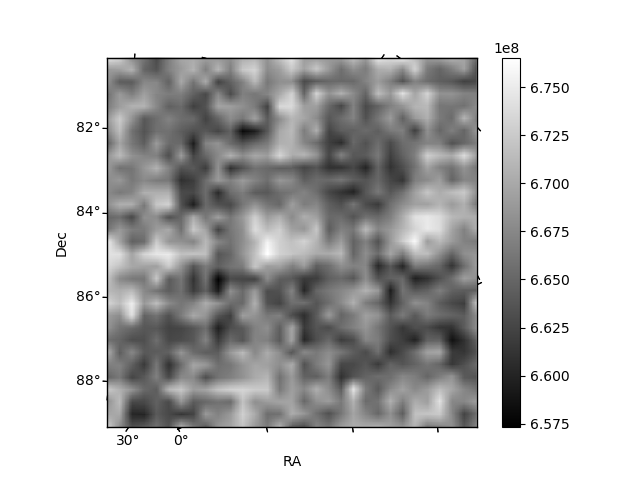
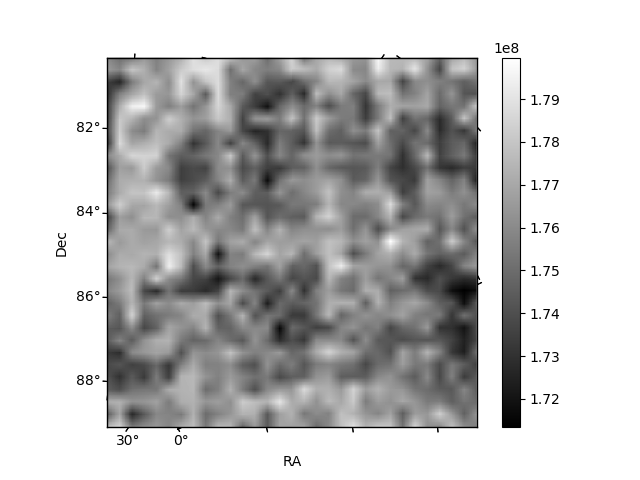
Histogram calculated using DETX and DETY for each event in the final _common_clean file
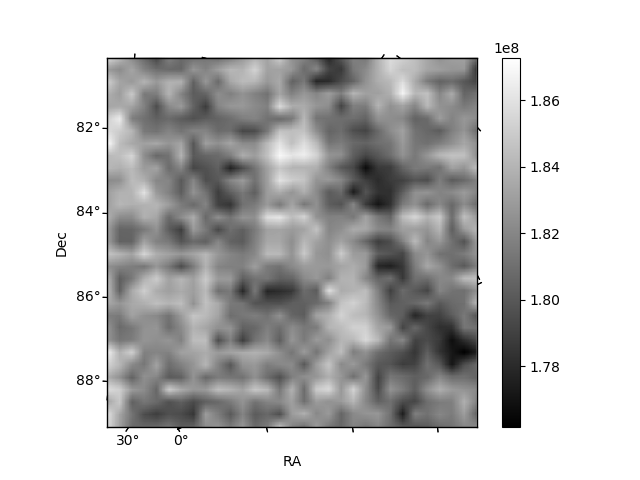
| Quadrant A | 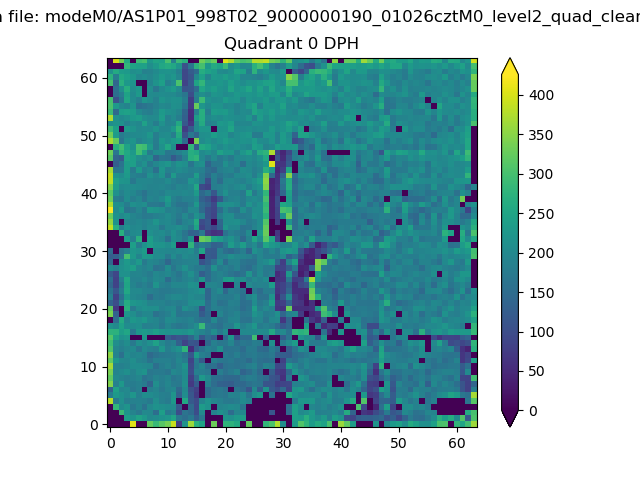 |
 |
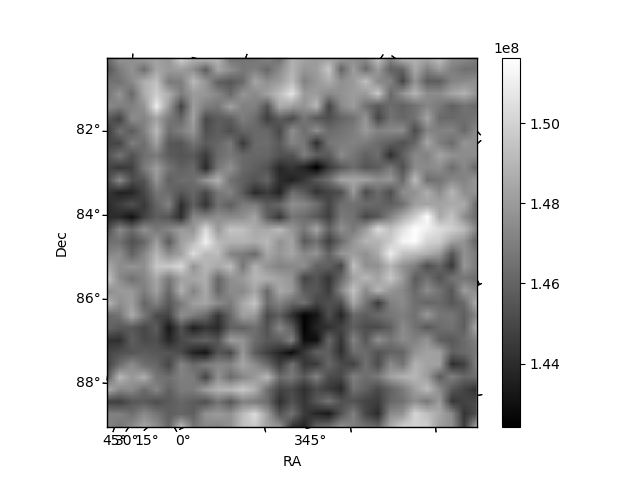
Quadrant B |
|---|---|---|---|
| Quadrant D | 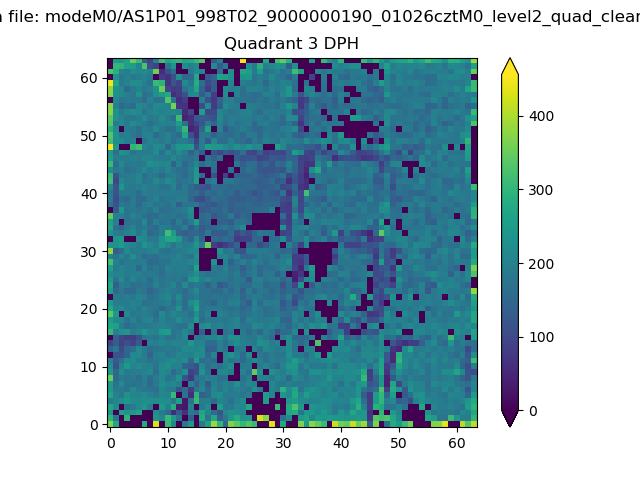 |
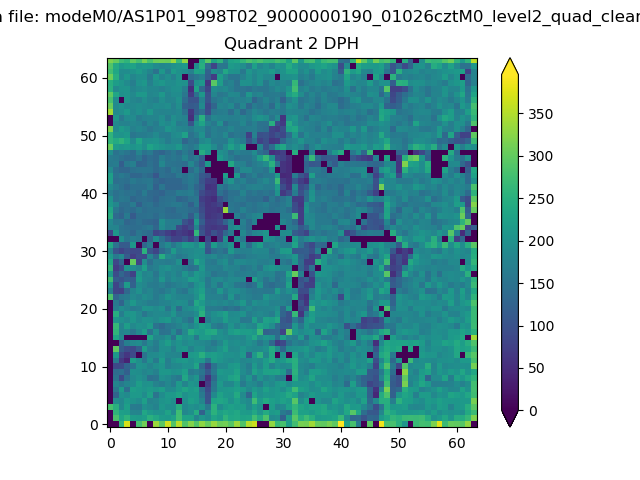 |
Quadrant C |
| Plot type | Count rate plots | Images |
|---|---|---|
| Comparison with Poisson distribution Blue bars denote a histogram of data divided into 1 sec bins. Red curve is a Poisson curve with rate = median count rate of data. |
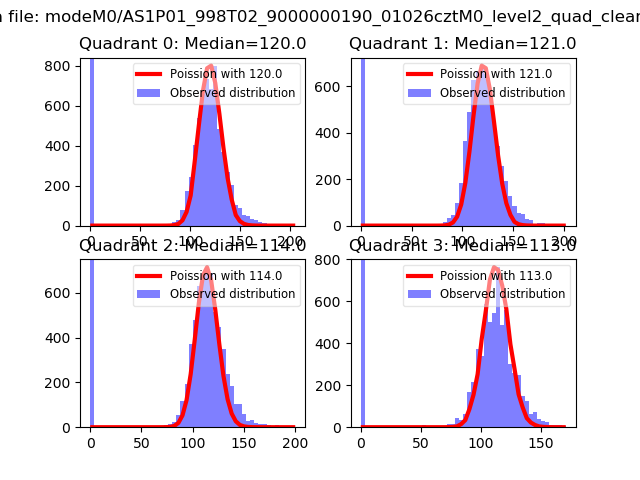 |
 |
| Quadrant-wise count rates Data is divided into 100 sec bins |
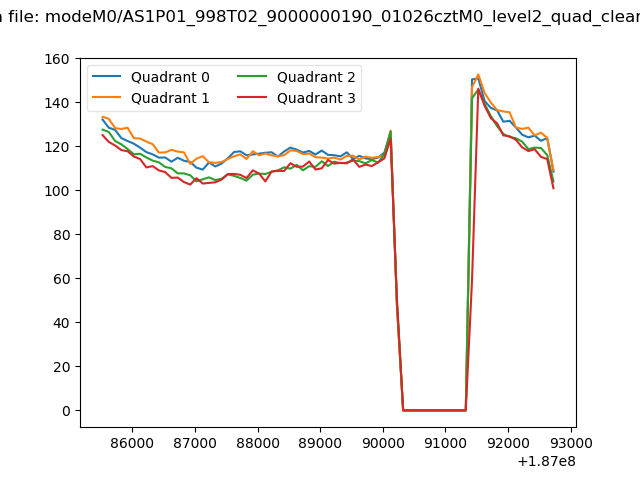 |
|
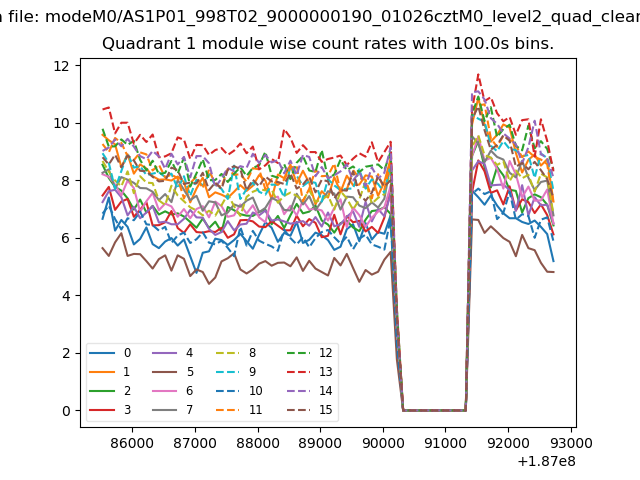
| Module-wise count rates for Quadrant A Data is divided into 100 sec bins |
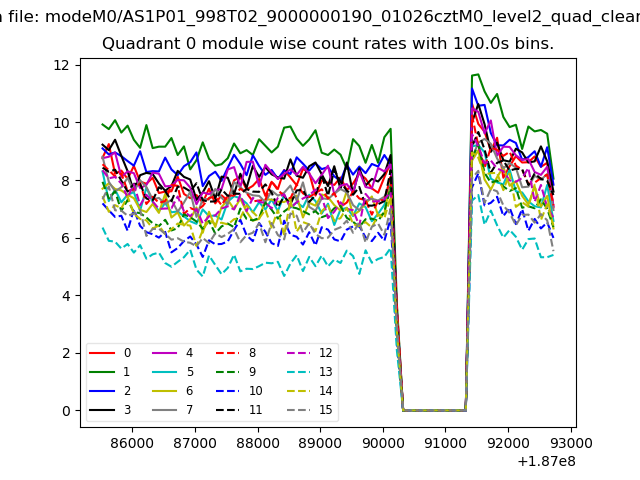 |
 |
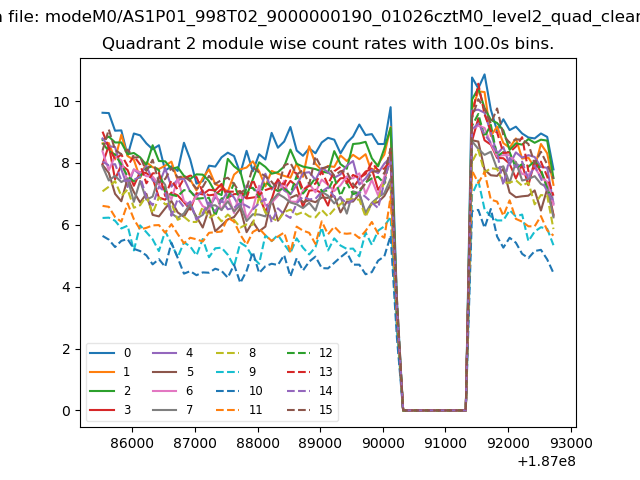
| Module-wise count rates for Quadrant B Data is divided into 100 sec bins |
 |
 |
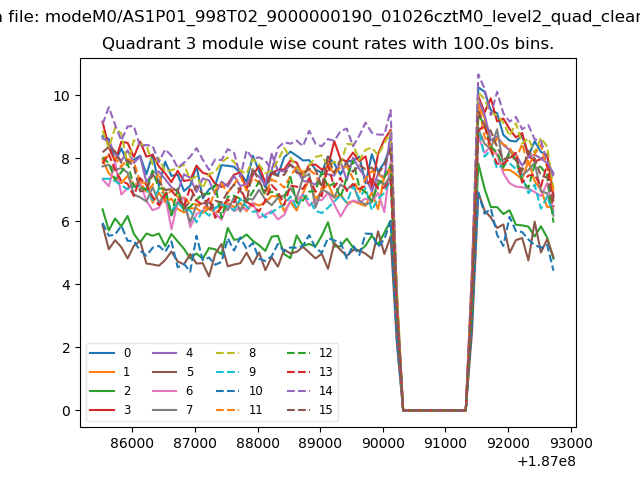
| Module-wise count rates for Quadrant C Data is divided into 100 sec bins |
 |
 |
| Module-wise count rates for Quadrant D Data is divided into 100 sec bins |
 |
 |
| Parameter | Plot |
|---|---|
| CZT HV Monitor | 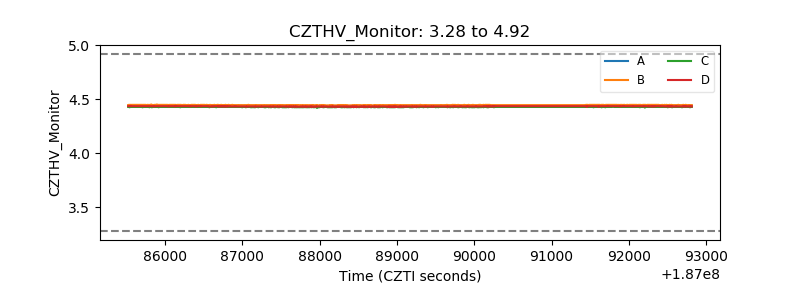 |
| D_VDD | 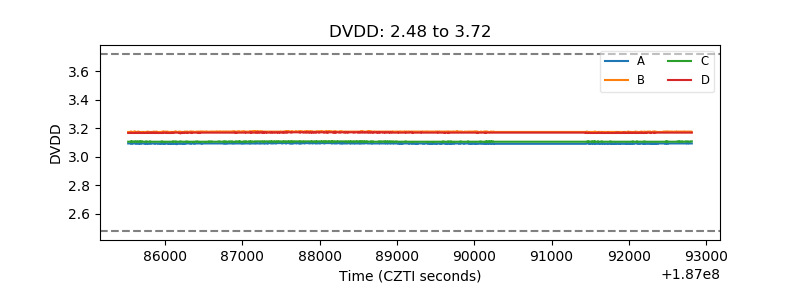 |
| Temperature 1 | 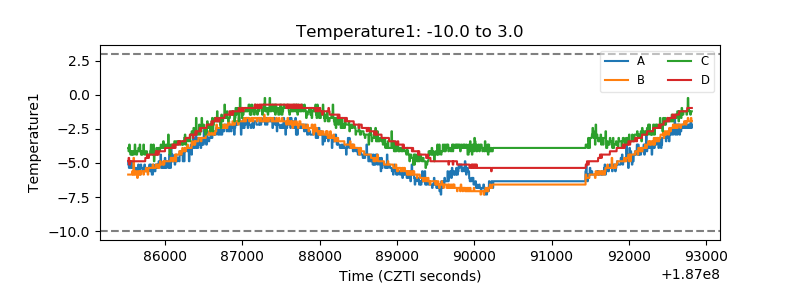 |
| Veto HV Monitor | 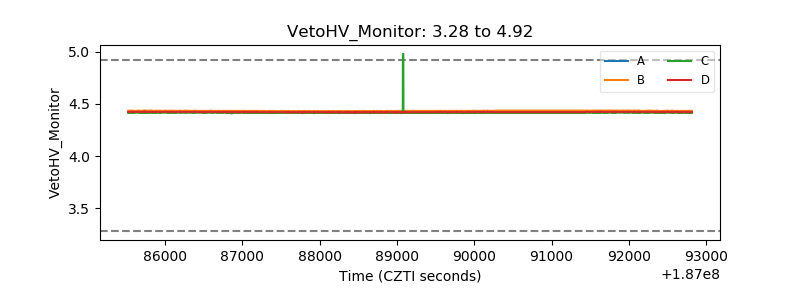 |
| Veto LLD | 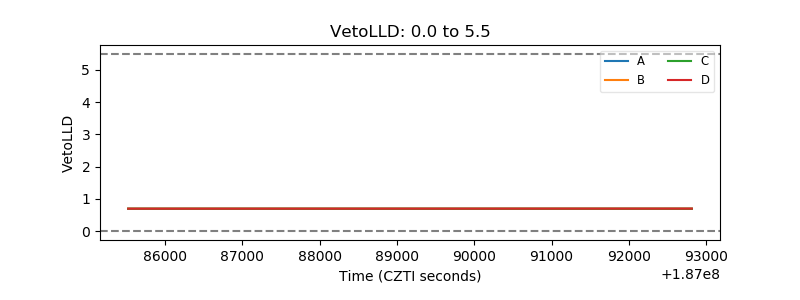 |
| Alpha Counter | 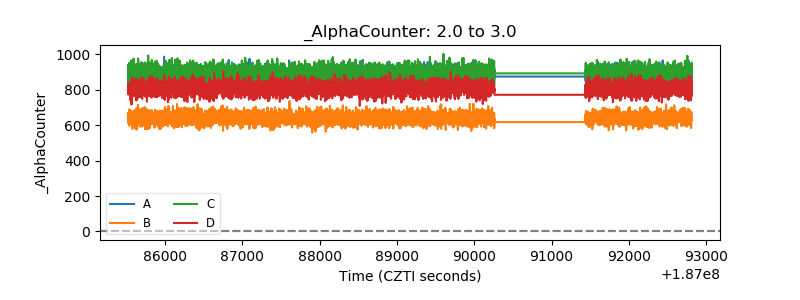 |
| _CPM_Rate | 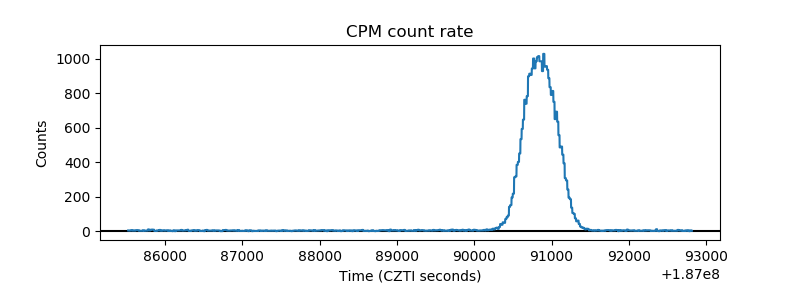 |
| CZT Counter | 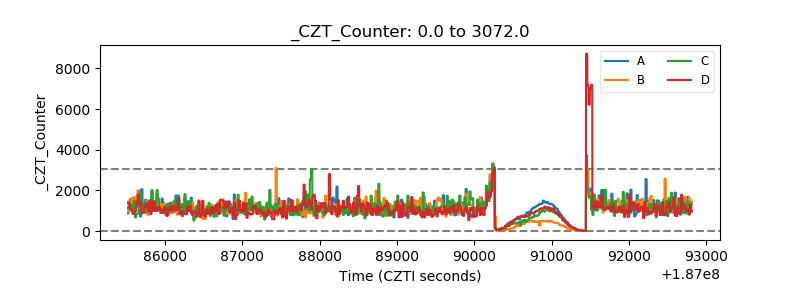 |
| +2.5 Volts monitor | 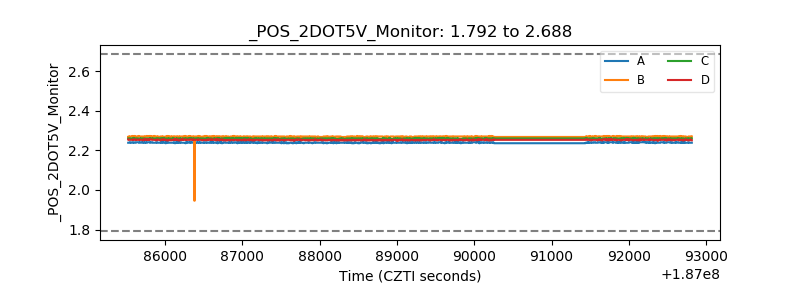 |
| +5 Volts monitor |  |
| _ROLL_ROT | 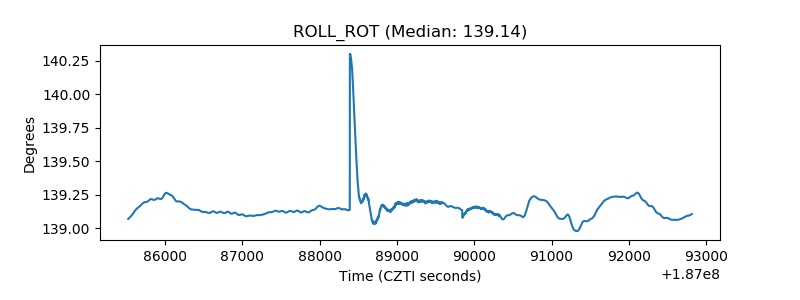 |
| _Roll_DEC | 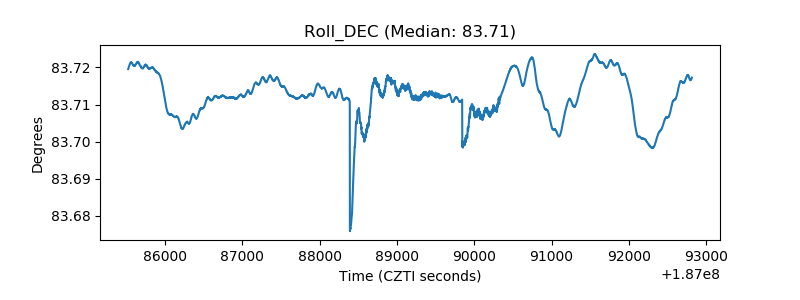 |
| _Roll_RA | 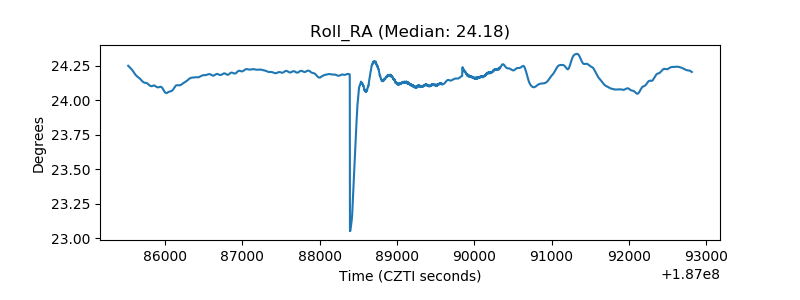 |
| Veto Counter | 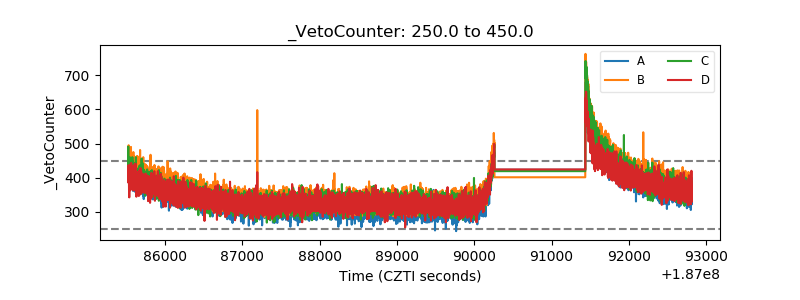 |