| Param | Original file | Final file |
|---|---|---|
| Filename | modeM0/AS1P01_998T02_9000000190_01027cztM0_level2.evt | modeM0/AS1P01_998T02_9000000190_01027cztM0_level2_quad_clean.evt |
| Size (bytes) | 1,033,680,960 | 112,245,120 |
| Size | 985.8 MB | 107.0 MB |
| Events in quadrant A | 7,476,077 | 762,139 |
| Events in quadrant B | 7,731,788 | 765,346 |
| Events in quadrant C | 8,939,121 | 715,982 |
| Events in quadrant D | 6,748,013 | 724,062 |
| Mode M0 | |||
|---|---|---|---|
| Quadrant | BADHDUFLAG | Total packets | Discarded packets |
| A | 0 | 26567 | 1 |
| B | 0 | 27364 | 1 |
| C | 0 | 30970 | 1 |
| D | 0 | 24466 | 1 |
| Mode SS | |||
|---|---|---|---|
| Quadrant | BADHDUFLAG | Total packets | Discarded packets |
| A | 0 | 126 | 0 |
| B | 0 | 126 | 0 |
| C | 0 | 126 | 0 |
| D | 0 | 126 | 0 |
| Mode M9 | |||
|---|---|---|---|
| Quadrant | BADHDUFLAG | Total packets | Discarded packets |
| A | 0 | 12 | 0 |
| B | 0 | 12 | 0 |
| C | 0 | 12 | 0 |
| D | 0 | 12 | 0 |
| Quadrant | Total seconds | Saturated seconds | Saturation percentage |
|---|---|---|---|
| A | 6188 | 46 | 0.743374% |
| B | 6189 | 59 | 0.953304% |
| C | 6189 | 263 | 4.249475% |
| D | 6189 | 40 | 0.646308% |
Noise dominated data is calculated using 1-second bins in cleaned event files. If a bin has >2000 counts, and if more than 50% of those come from <1% of pixels, then it is considered to be noise-dominated and hence unusable.
| Quadrant | # 1 sec bins | Bins with >0 counts | Bins with >2000 counts | High rate bins dominated by noise | Noise dominated (total time) | Noise dominated (detector-on time) | Marked lightcurve |
|---|---|---|---|---|---|---|---|
| A | 7388 | 6189 | 220 | 220 | 2.98% | 3.55% | 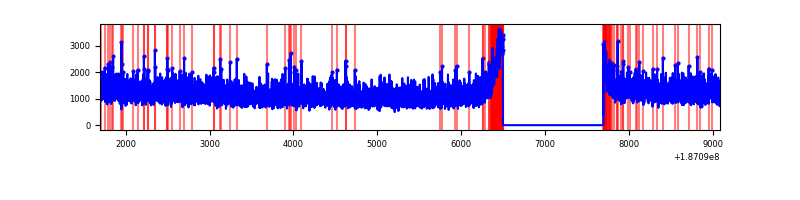 |
| B | 7389 | 6190 | 240 | 240 | 3.25% | 3.88% | 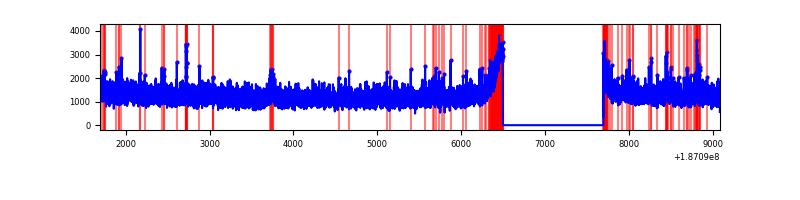 |
| C | 7389 | 6190 | 1098 | 1098 | 14.86% | 17.74% | 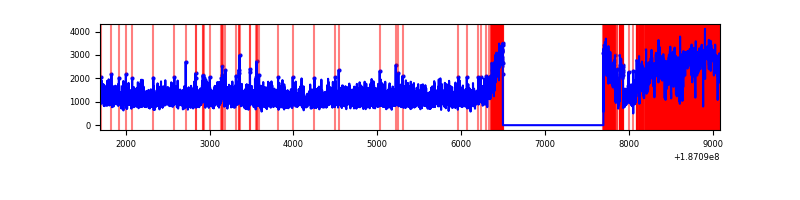 |
| D | 7389 | 6190 | 151 | 151 | 2.04% | 2.44% | 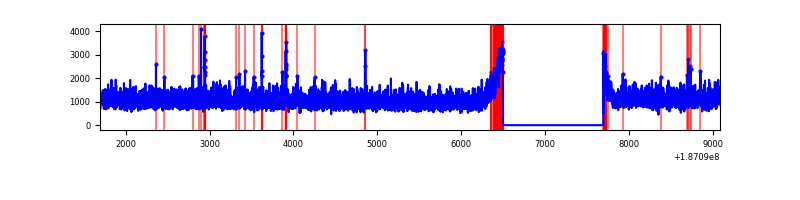 |
Top three noisy pixels from each quadrant. If the there are fewer than three noisy pixels in the level2.evt file, extra rows are filled as -1
| Pixel properties | Quadrant properties | ||||||
|---|---|---|---|---|---|---|---|
| Quadrant | DetID | PixID | Counts | Sigma | Mean | Median | Sigma |
| A | 4 | 32 | 37904 | 77.55 | 1936 | 1945 | 463.7 |
| A | 11 | 242 | 8047 | 13.16 | 1936 | 1945 | 463.7 |
| A | 11 | 79 | 6848 | 10.57 | 1936 | 1945 | 463.7 |
| B | 5 | 249 | 74601 | 154.9 | 1985 | 1993 | 468.7 |
| B | 15 | 85 | 29222 | 58.09 | 1985 | 1993 | 468.7 |
| B | 15 | 22 | 28726 | 57.03 | 1985 | 1993 | 468.7 |
| C | 8 | 208 | 1596505 | 3216.58 | 1789 | 1848 | 495.8 |
| C | 15 | 241 | 291137 | 583.52 | 1789 | 1848 | 495.8 |
| C | 3 | 111 | 23917 | 44.52 | 1789 | 1848 | 495.8 |
| D | 5 | 80 | 33352 | 58.55 | 1769 | 1831 | 538.4 |
| D | 9 | 64 | 24013 | 41.2 | 1769 | 1831 | 538.4 |
| D | 9 | 49 | 23493 | 40.24 | 1769 | 1831 | 538.4 |
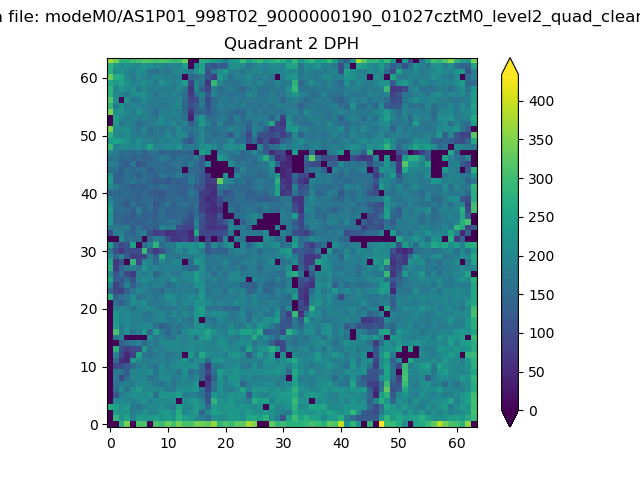
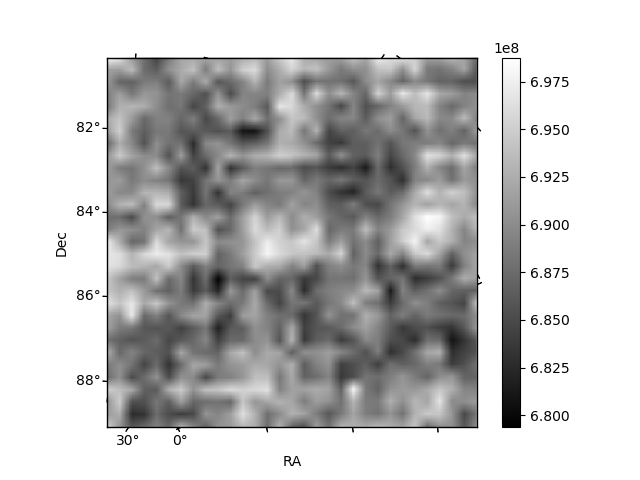
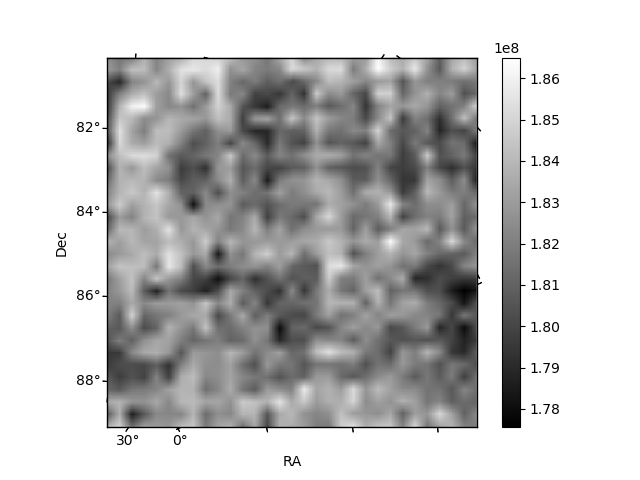
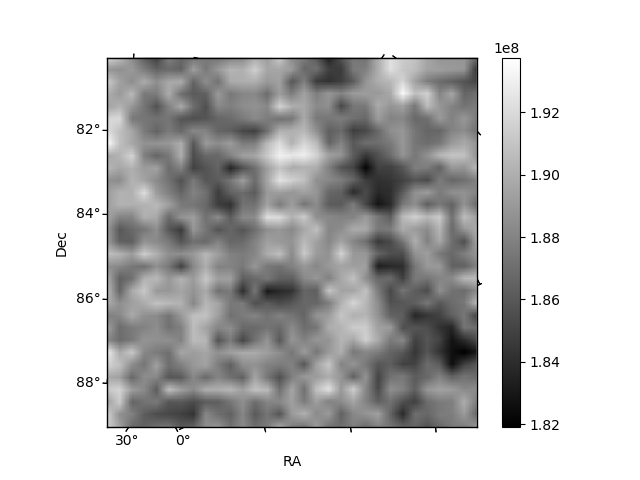
Histogram calculated using DETX and DETY for each event in the final _common_clean file
| Quadrant A | 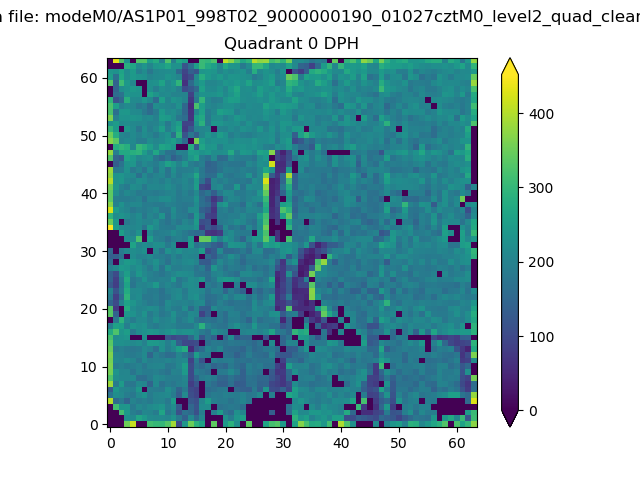 |
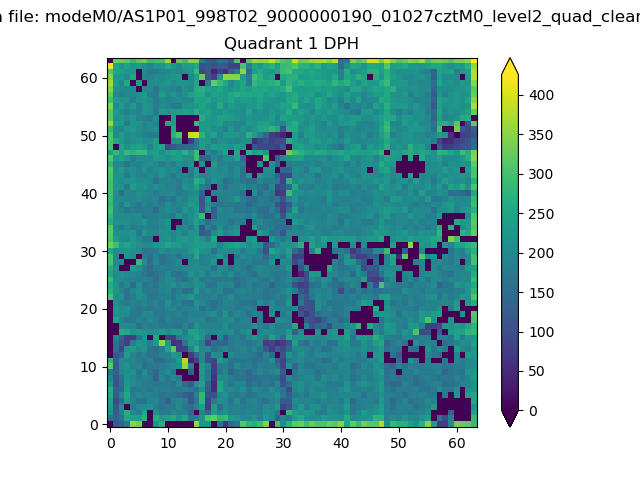 |
Quadrant B |
|---|---|---|---|
| Quadrant D | 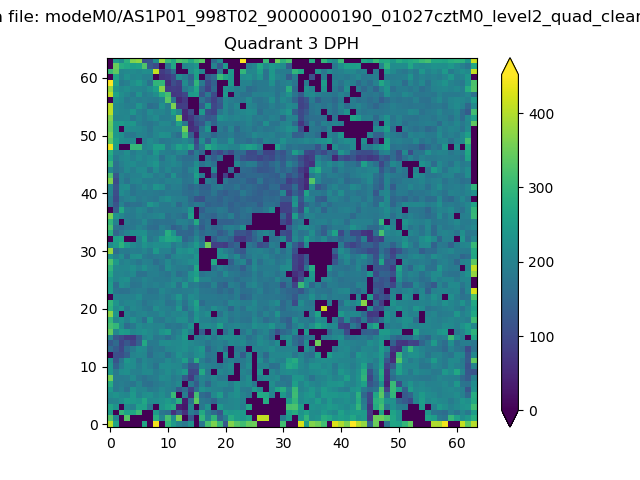 |
 |
Quadrant C |
| Plot type | Count rate plots | Images |
|---|---|---|
| Comparison with Poisson distribution Blue bars denote a histogram of data divided into 1 sec bins. Red curve is a Poisson curve with rate = median count rate of data. |
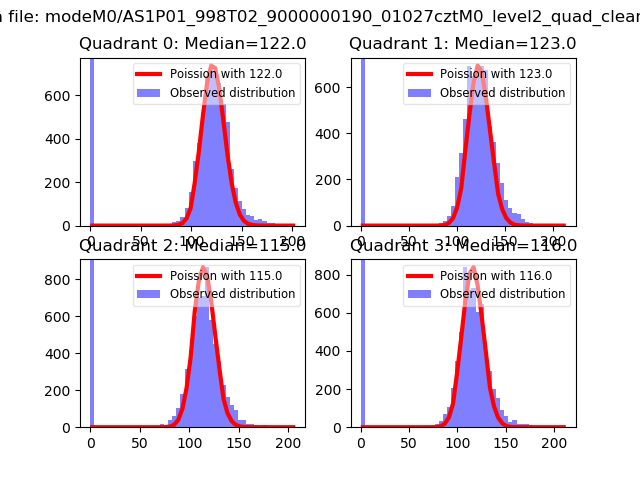 |
 |
| Quadrant-wise count rates Data is divided into 100 sec bins |
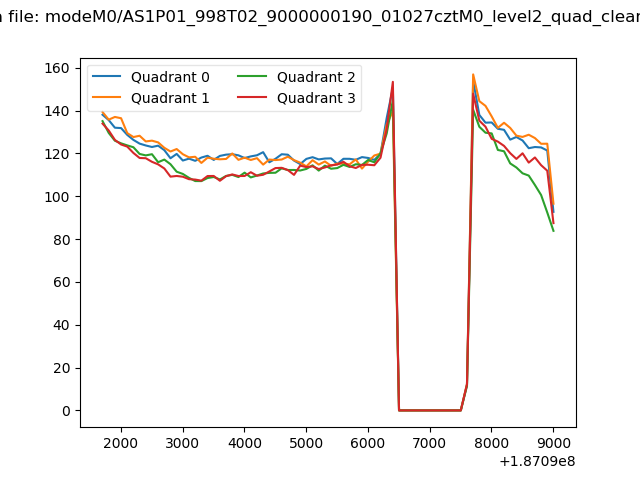 |
|
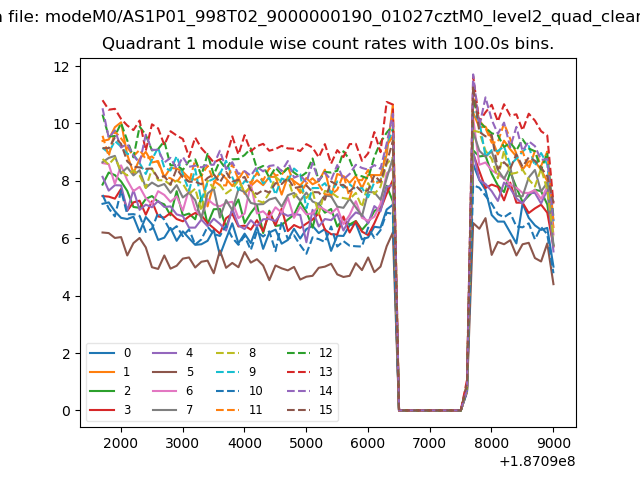
| Module-wise count rates for Quadrant A Data is divided into 100 sec bins |
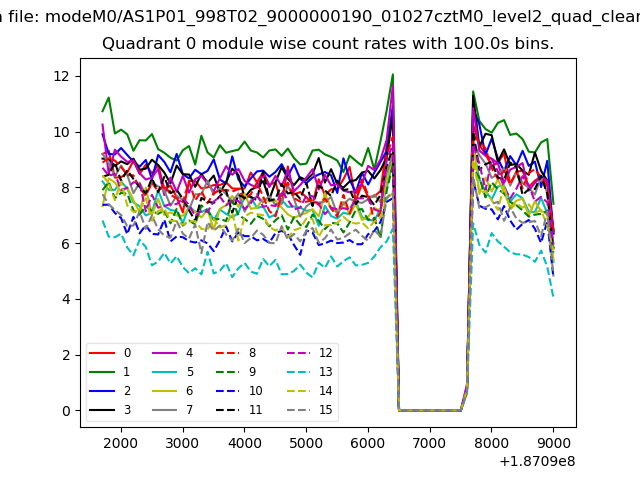 |
 |
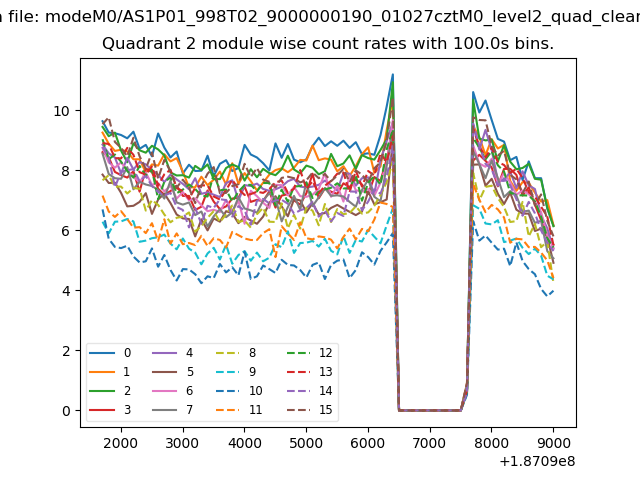
| Module-wise count rates for Quadrant B Data is divided into 100 sec bins |
 |
 |
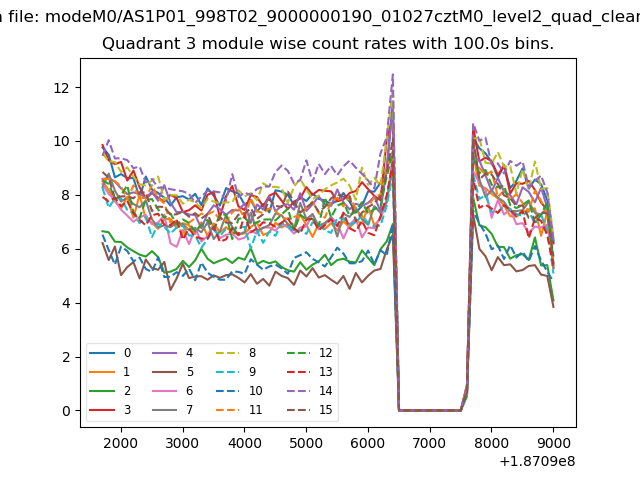
| Module-wise count rates for Quadrant C Data is divided into 100 sec bins |
 |
 |
| Module-wise count rates for Quadrant D Data is divided into 100 sec bins |
 |
 |
| Parameter | Plot |
|---|---|
| CZT HV Monitor | 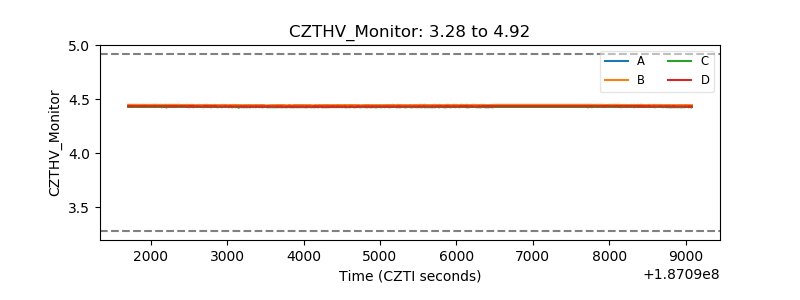 |
| D_VDD | 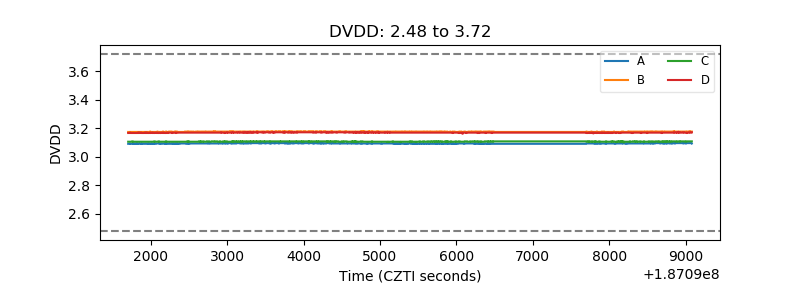 |
| Temperature 1 | 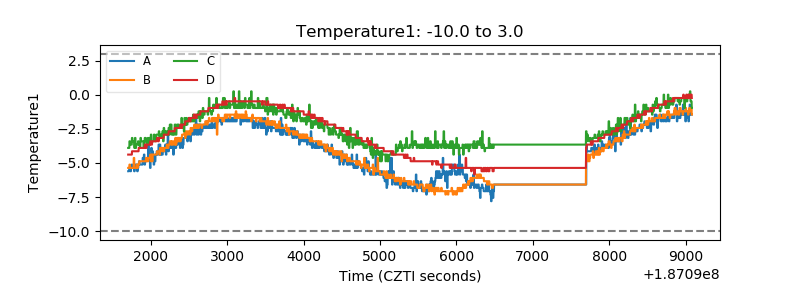 |
| Veto HV Monitor | 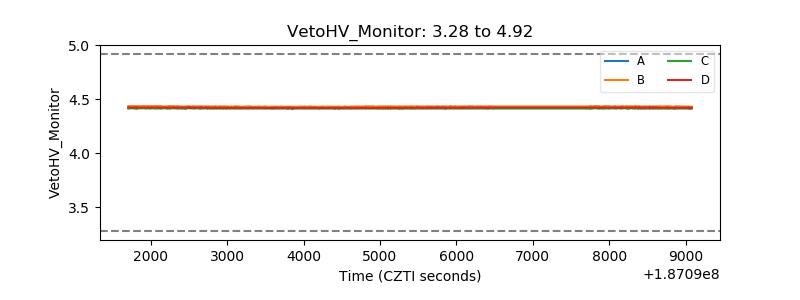 |
| Veto LLD | 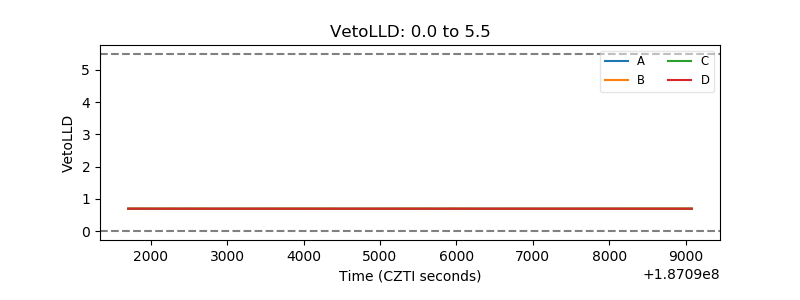 |
| Alpha Counter | 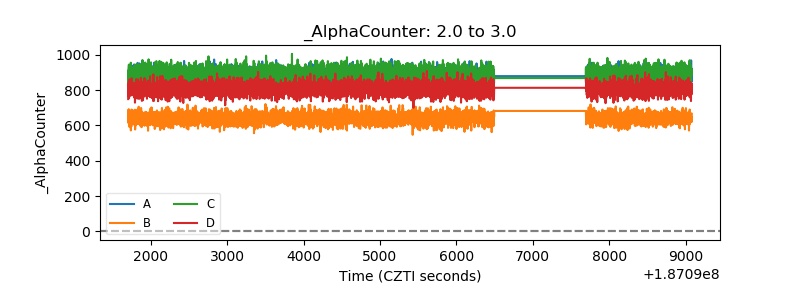 |
| _CPM_Rate | 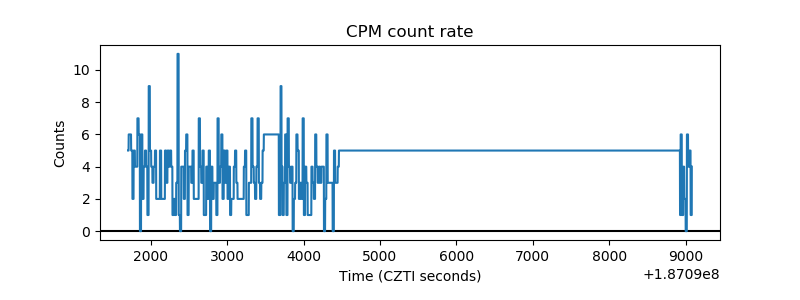 |
| CZT Counter | 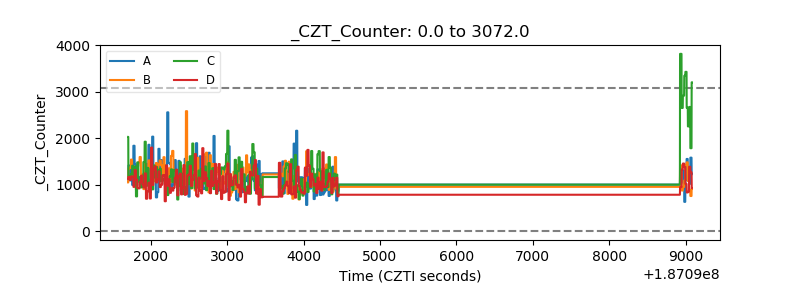 |
| +2.5 Volts monitor |  |
| +5 Volts monitor |  |
| _ROLL_ROT | 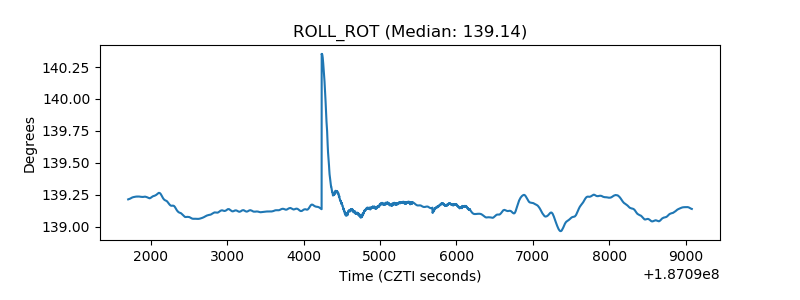 |
| _Roll_DEC | 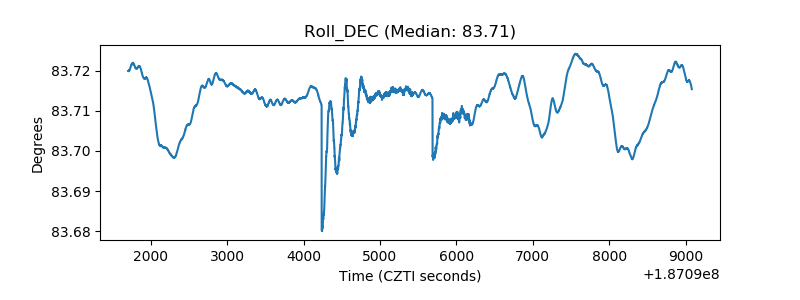 |
| _Roll_RA | 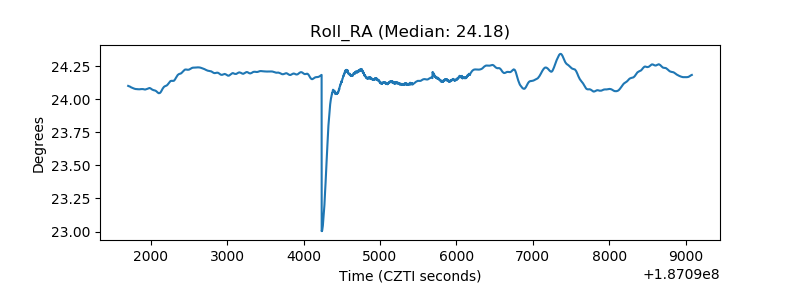 |
| Veto Counter | 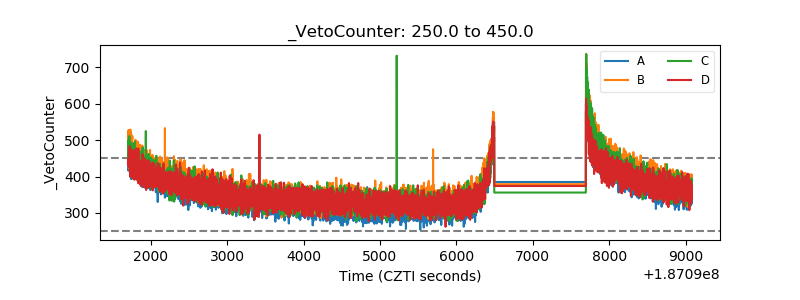 |