| Param | Original file | Final file |
|---|---|---|
| Filename | modeM0/AS1P01_998T02_9000000190_01028cztM0_level2.evt | modeM0/AS1P01_998T02_9000000190_01028cztM0_level2_quad_clean.evt |
| Size (bytes) | 1,021,271,040 | 104,572,800 |
| Size | 974.0 MB | 99.7 MB |
| Events in quadrant A | 7,145,953 | 713,091 |
| Events in quadrant B | 7,280,703 | 710,413 |
| Events in quadrant C | 9,430,125 | 655,056 |
| Events in quadrant D | 6,680,911 | 675,248 |
| Mode M0 | |||
|---|---|---|---|
| Quadrant | BADHDUFLAG | Total packets | Discarded packets |
| A | 0 | 25403 | 1 |
| B | 0 | 25837 | 1 |
| C | 0 | 32274 | 1 |
| D | 0 | 24071 | 1 |
| Mode SS | |||
|---|---|---|---|
| Quadrant | BADHDUFLAG | Total packets | Discarded packets |
| A | 0 | 120 | 0 |
| B | 0 | 120 | 0 |
| C | 0 | 120 | 0 |
| D | 0 | 120 | 0 |
| Mode M9 | |||
|---|---|---|---|
| Quadrant | BADHDUFLAG | Total packets | Discarded packets |
| A | 0 | 12 | 0 |
| B | 0 | 12 | 0 |
| C | 0 | 12 | 0 |
| D | 0 | 12 | 0 |
| Quadrant | Total seconds | Saturated seconds | Saturation percentage |
|---|---|---|---|
| A | 5913 | 61 | 1.031625% |
| B | 5913 | 69 | 1.166920% |
| C | 5913 | 590 | 9.978015% |
| D | 5913 | 85 | 1.437511% |
Noise dominated data is calculated using 1-second bins in cleaned event files. If a bin has >2000 counts, and if more than 50% of those come from <1% of pixels, then it is considered to be noise-dominated and hence unusable.
| Quadrant | # 1 sec bins | Bins with >0 counts | Bins with >2000 counts | High rate bins dominated by noise | Noise dominated (total time) | Noise dominated (detector-on time) | Marked lightcurve |
|---|---|---|---|---|---|---|---|
| A | 7078 | 5914 | 273 | 273 | 3.86% | 4.62% | 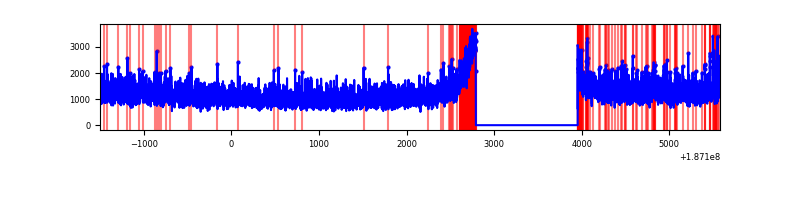 |
| B | 7078 | 5914 | 257 | 257 | 3.63% | 4.35% | 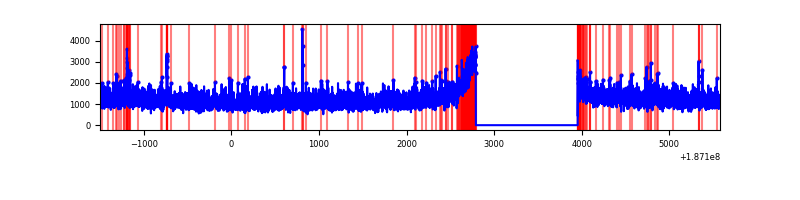 |
| C | 7078 | 5914 | 1460 | 1460 | 20.63% | 24.69% | 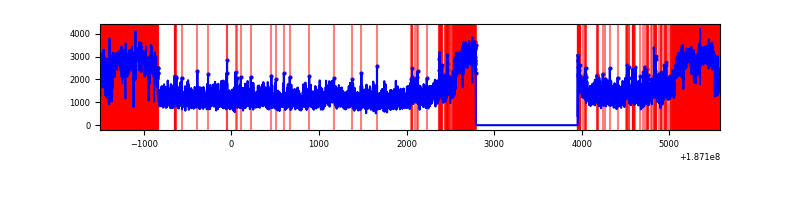 |
| D | 7078 | 5914 | 240 | 240 | 3.39% | 4.06% | 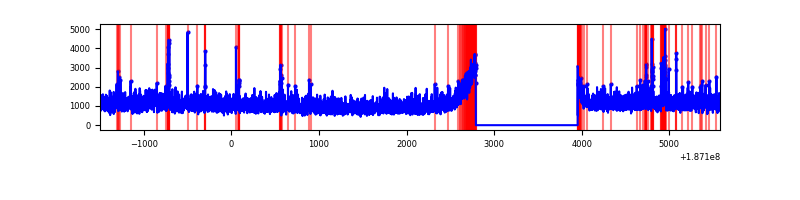 |
Top three noisy pixels from each quadrant. If the there are fewer than three noisy pixels in the level2.evt file, extra rows are filled as -1
| Pixel properties | Quadrant properties | ||||||
|---|---|---|---|---|---|---|---|
| Quadrant | DetID | PixID | Counts | Sigma | Mean | Median | Sigma |
| A | 0 | 253 | 103957 | 234.52 | 1816 | 1822 | 435.5 |
| A | 4 | 32 | 53612 | 118.92 | 1816 | 1822 | 435.5 |
| A | 12 | 189 | 15899 | 32.32 | 1816 | 1822 | 435.5 |
| B | 5 | 249 | 57875 | 128.35 | 1869 | 1870 | 436.3 |
| B | 15 | 85 | 20076 | 41.72 | 1869 | 1870 | 436.3 |
| B | 15 | 22 | 18043 | 37.07 | 1869 | 1870 | 436.3 |
| C | 8 | 208 | 2488462 | 5300.36 | 1686 | 1742 | 469.2 |
| C | 15 | 241 | 280952 | 595.13 | 1686 | 1742 | 469.2 |
| C | 3 | 79 | 28857 | 57.79 | 1686 | 1742 | 469.2 |
| D | 2 | 54 | 135271 | 257.02 | 1692 | 1749 | 519.5 |
| D | 10 | 125 | 60000 | 112.13 | 1692 | 1749 | 519.5 |
| D | 13 | 73 | 53438 | 99.5 | 1692 | 1749 | 519.5 |
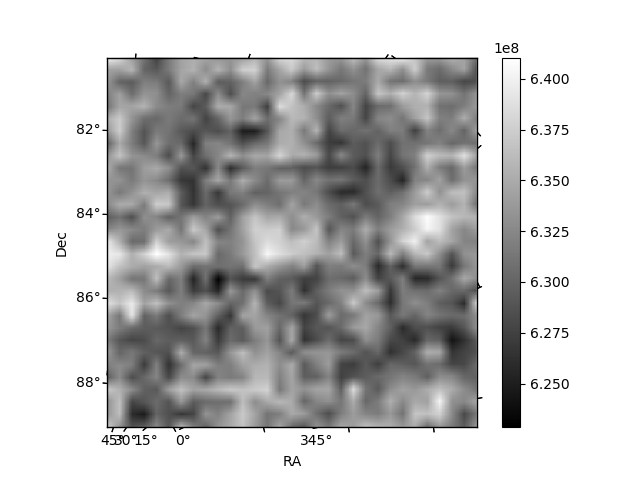
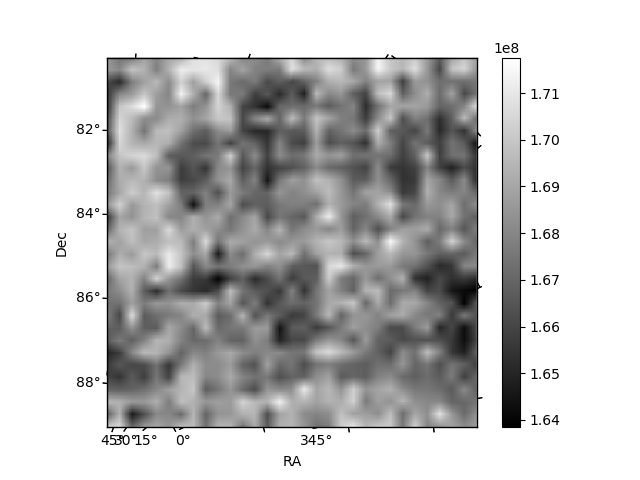
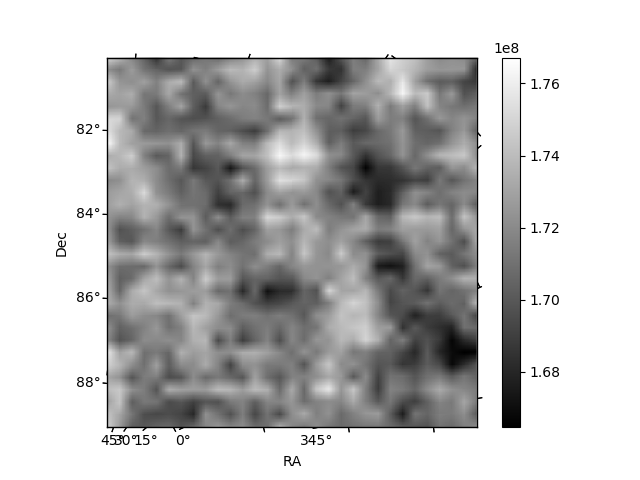
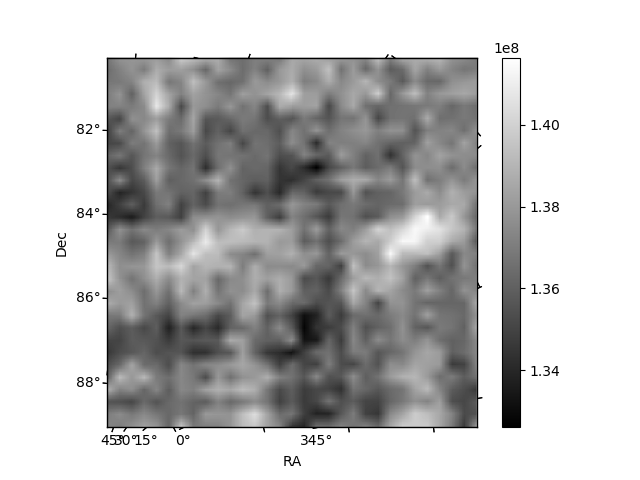
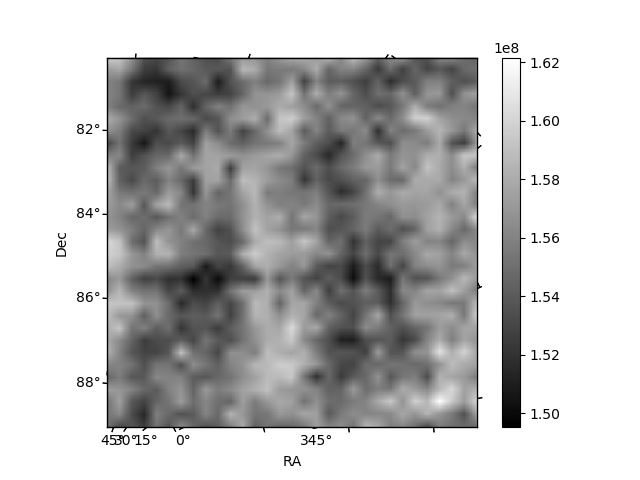
Histogram calculated using DETX and DETY for each event in the final _common_clean file
| Quadrant A | 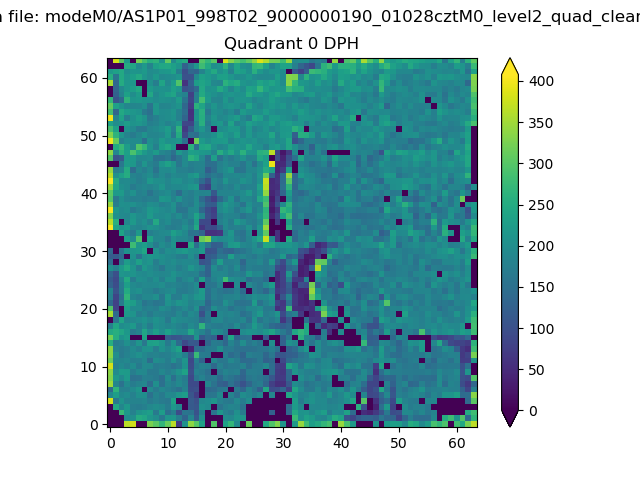 |
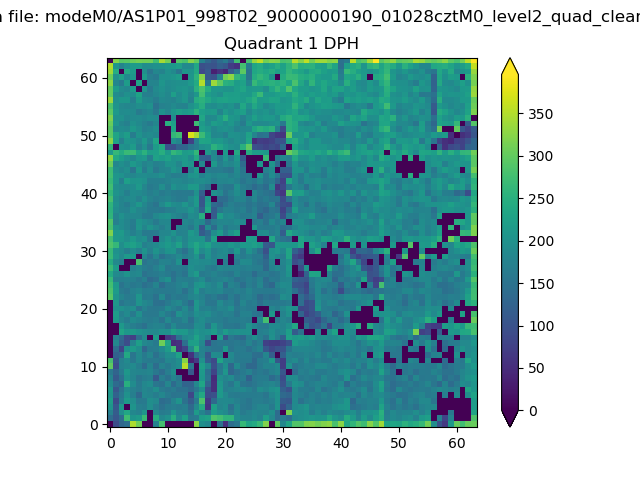 |
Quadrant B |
|---|---|---|---|
| Quadrant D | 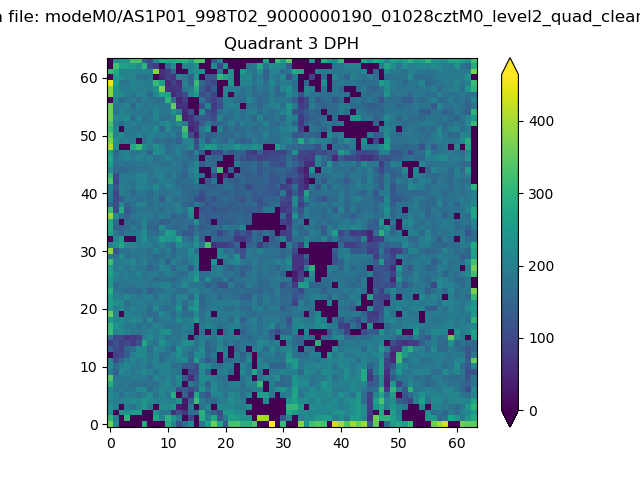 |
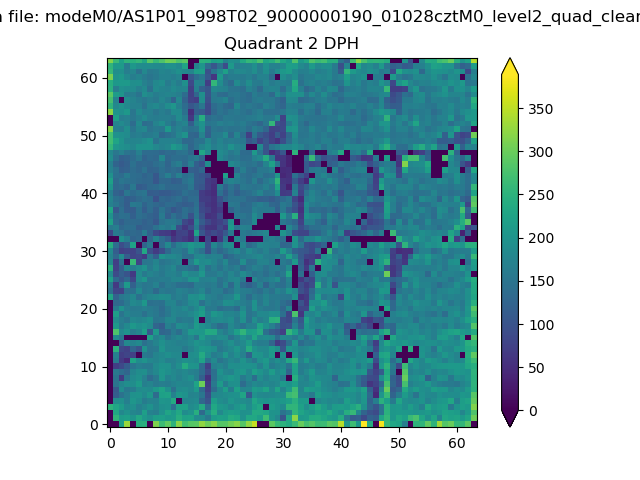 |
Quadrant C |
| Plot type | Count rate plots | Images |
|---|---|---|
| Comparison with Poisson distribution Blue bars denote a histogram of data divided into 1 sec bins. Red curve is a Poisson curve with rate = median count rate of data. |
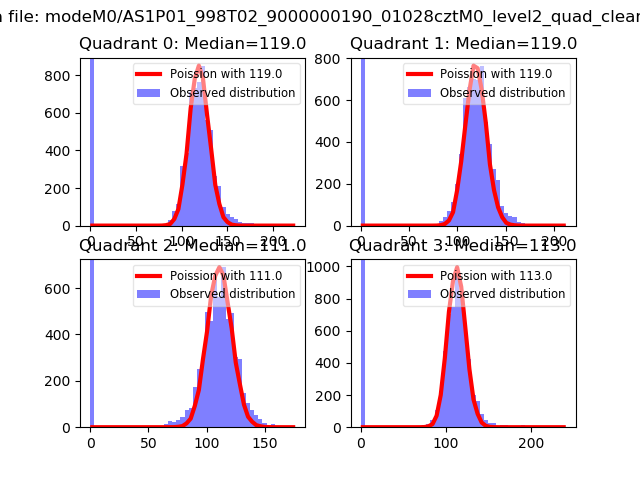 |
 |
| Quadrant-wise count rates Data is divided into 100 sec bins |
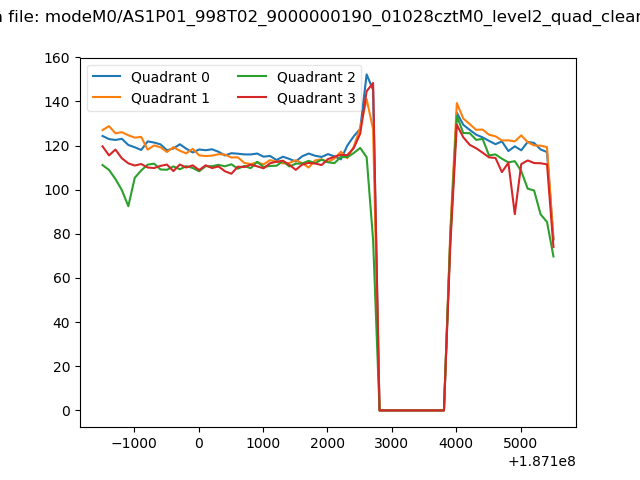 |
|
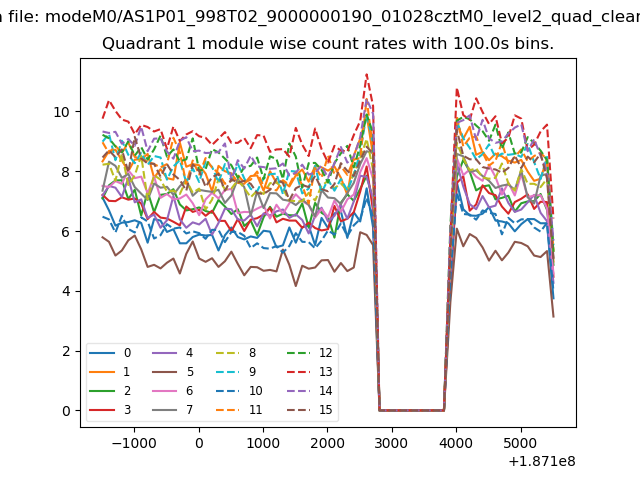
| Module-wise count rates for Quadrant A Data is divided into 100 sec bins |
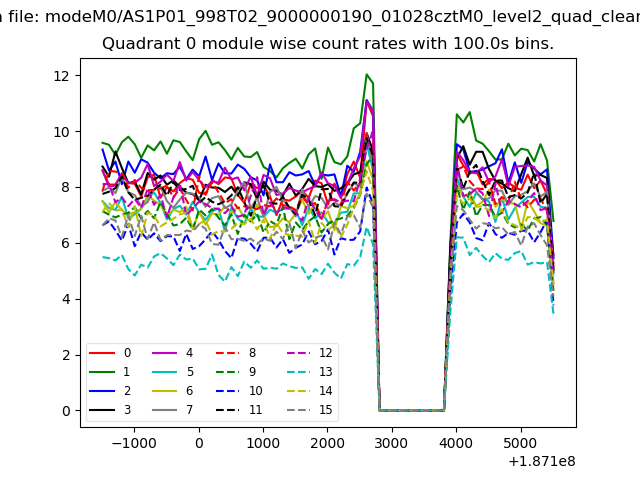 |
 |
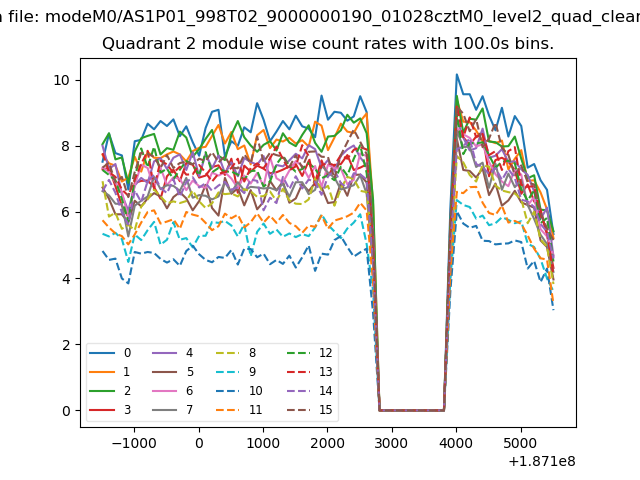
| Module-wise count rates for Quadrant B Data is divided into 100 sec bins |
 |
 |
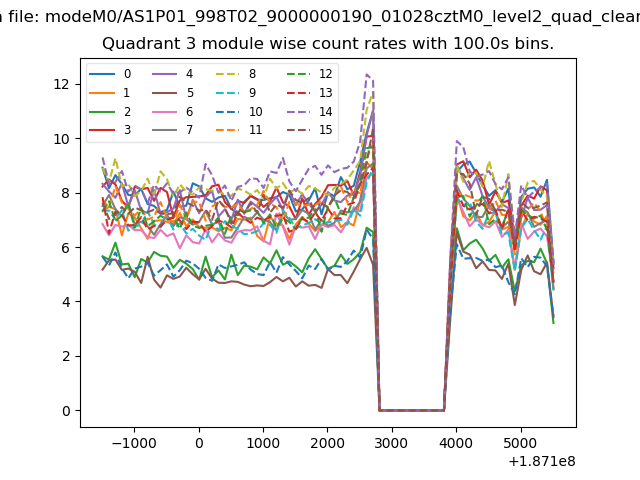
| Module-wise count rates for Quadrant C Data is divided into 100 sec bins |
 |
 |
| Module-wise count rates for Quadrant D Data is divided into 100 sec bins |
 |
 |
| Parameter | Plot |
|---|---|
| CZT HV Monitor | 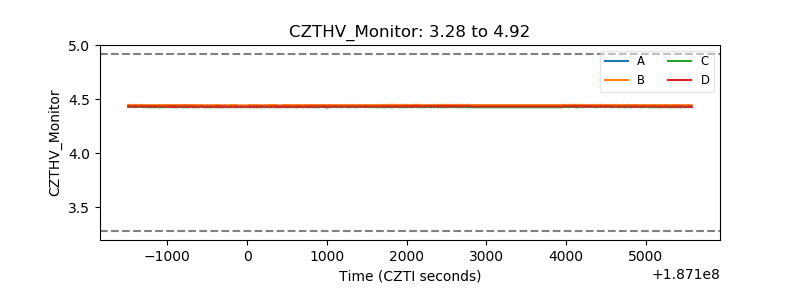 |
| D_VDD | 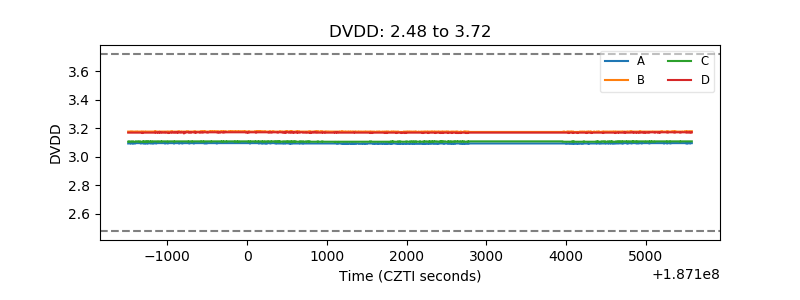 |
| Temperature 1 | 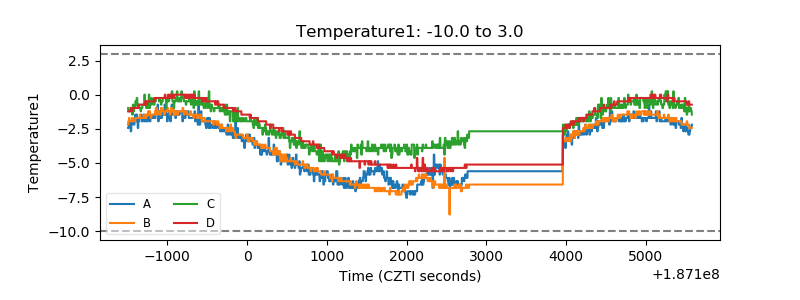 |
| Veto HV Monitor | 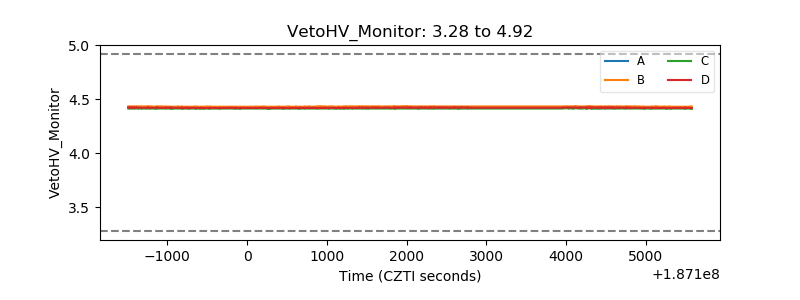 |
| Veto LLD | 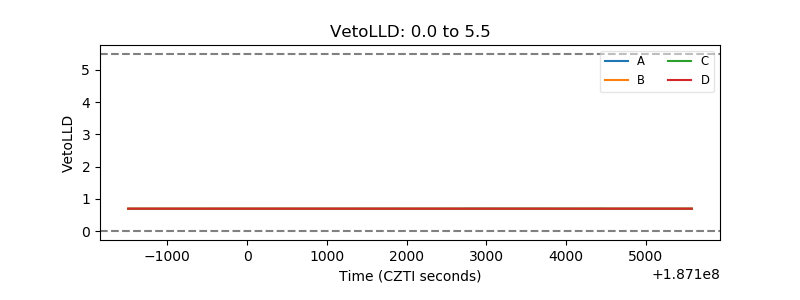 |
| Alpha Counter |  |
| _CPM_Rate |  |
| CZT Counter | 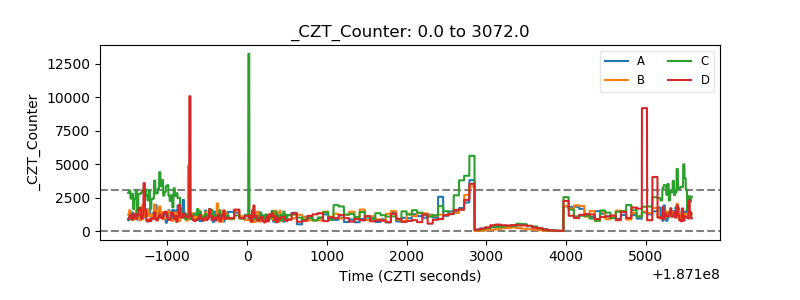 |
| +2.5 Volts monitor |  |
| +5 Volts monitor |  |
| _ROLL_ROT | 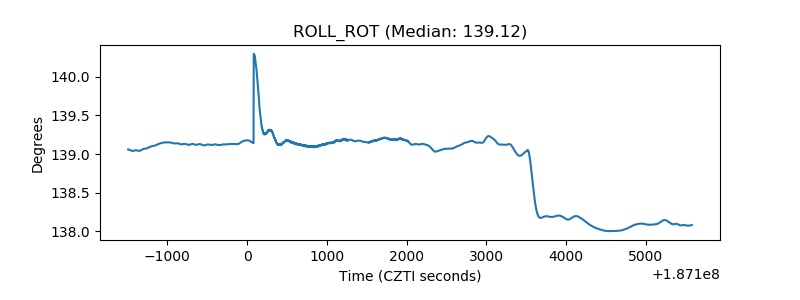 |
| _Roll_DEC | 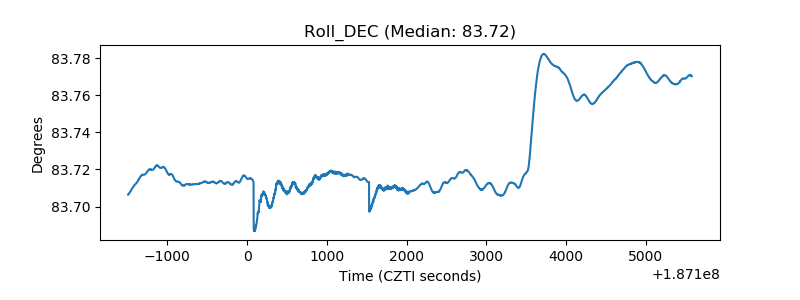 |
| _Roll_RA | 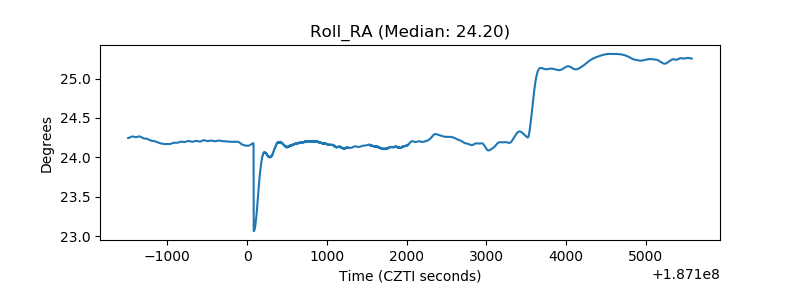 |
| Veto Counter | 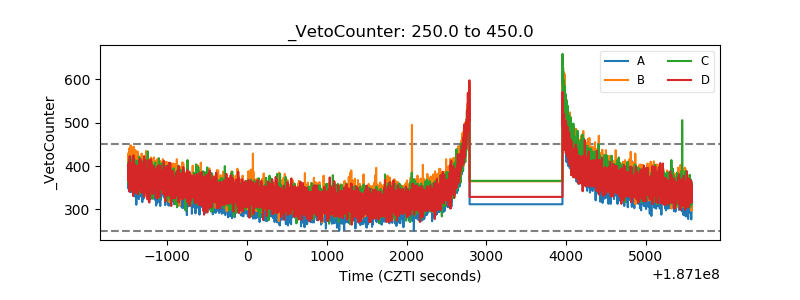 |