| Param | Original file | Final file |
|---|---|---|
| Filename | modeM0/AS1P01_998T02_9000000190_01031cztM0_level2.evt | modeM0/AS1P01_998T02_9000000190_01031cztM0_level2_quad_clean.evt |
| Size (bytes) | 1,215,014,400 | 120,173,760 |
| Size | 1.1 GB | 114.6 MB |
| Events in quadrant A | 8,518,157 | 804,165 |
| Events in quadrant B | 8,767,015 | 807,076 |
| Events in quadrant C | 11,329,486 | 751,607 |
| Events in quadrant D | 7,706,991 | 776,675 |
| Mode M0 | |||
|---|---|---|---|
| Quadrant | BADHDUFLAG | Total packets | Discarded packets |
| A | 0 | 30405 | 2 |
| B | 0 | 31106 | 3 |
| C | 0 | 38782 | 2 |
| D | 0 | 28040 | 2 |
| Mode SS | |||
|---|---|---|---|
| Quadrant | BADHDUFLAG | Total packets | Discarded packets |
| A | 0 | 148 | 0 |
| B | 0 | 148 | 0 |
| C | 0 | 148 | 0 |
| D | 0 | 148 | 0 |
| Mode M9 | |||
|---|---|---|---|
| Quadrant | BADHDUFLAG | Total packets | Discarded packets |
| A | 0 | 3 | 0 |
| B | 0 | 3 | 0 |
| C | 0 | 3 | 0 |
| D | 0 | 3 | 0 |
| Quadrant | Total seconds | Saturated seconds | Saturation percentage |
|---|---|---|---|
| A | 7173 | 21 | 0.292765% |
| B | 7172 | 26 | 0.362521% |
| C | 7172 | 561 | 7.822086% |
| D | 7172 | 9 | 0.125488% |
Noise dominated data is calculated using 1-second bins in cleaned event files. If a bin has >2000 counts, and if more than 50% of those come from <1% of pixels, then it is considered to be noise-dominated and hence unusable.
| Quadrant | # 1 sec bins | Bins with >0 counts | Bins with >2000 counts | High rate bins dominated by noise | Noise dominated (total time) | Noise dominated (detector-on time) | Marked lightcurve |
|---|---|---|---|---|---|---|---|
| A | 7563 | 7175 | 277 | 277 | 3.66% | 3.86% | 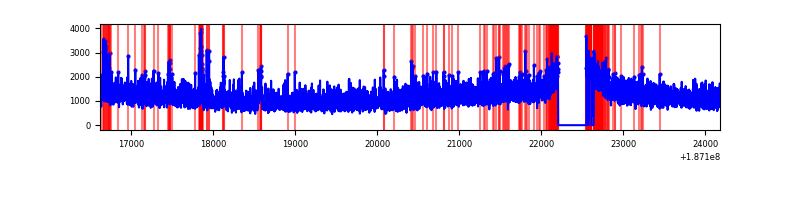 |
| B | 7562 | 7174 | 295 | 295 | 3.90% | 4.11% |  |
| C | 7562 | 7174 | 1755 | 1755 | 23.21% | 24.46% | 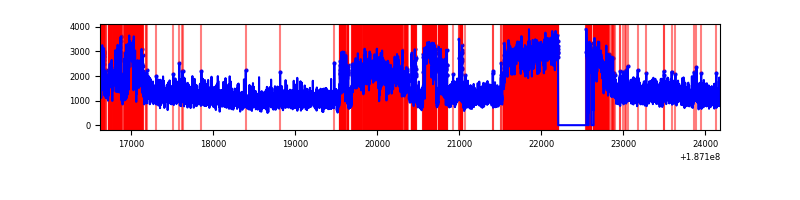 |
| D | 7562 | 7174 | 172 | 172 | 2.27% | 2.40% |  |
Top three noisy pixels from each quadrant. If the there are fewer than three noisy pixels in the level2.evt file, extra rows are filled as -1
| Pixel properties | Quadrant properties | ||||||
|---|---|---|---|---|---|---|---|
| Quadrant | DetID | PixID | Counts | Sigma | Mean | Median | Sigma |
| A | 4 | 32 | 138396 | 259.02 | 2178 | 2186 | 525.9 |
| A | 12 | 189 | 18322 | 30.68 | 2178 | 2186 | 525.9 |
| A | 11 | 79 | 8031 | 11.11 | 2178 | 2186 | 525.9 |
| B | 8 | 234 | 41389 | 73.96 | 2252 | 2260 | 529.1 |
| B | 0 | 220 | 33503 | 59.05 | 2252 | 2260 | 529.1 |
| B | 15 | 22 | 30144 | 52.7 | 2252 | 2260 | 529.1 |
| C | 8 | 208 | 2920985 | 5149.39 | 2037 | 2109 | 566.8 |
| C | 15 | 241 | 359552 | 630.59 | 2037 | 2109 | 566.8 |
| C | 3 | 79 | 40686 | 68.06 | 2037 | 2109 | 566.8 |
| D | 1 | 83 | 41262 | 62.38 | 2036 | 2109 | 627.6 |
| D | 9 | 64 | 21915 | 31.56 | 2036 | 2109 | 627.6 |
| D | 13 | 73 | 17846 | 25.07 | 2036 | 2109 | 627.6 |
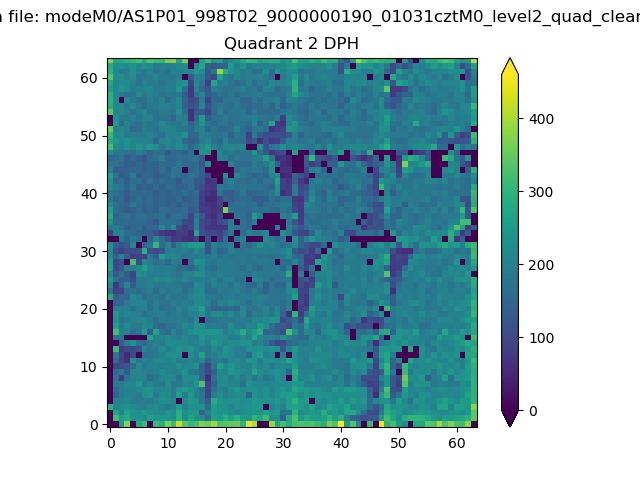
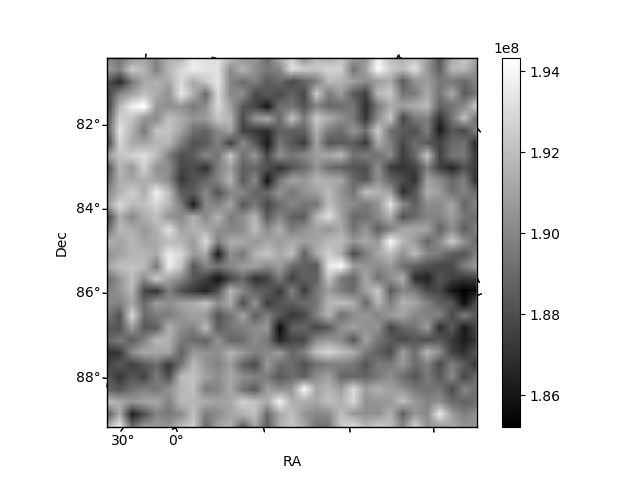
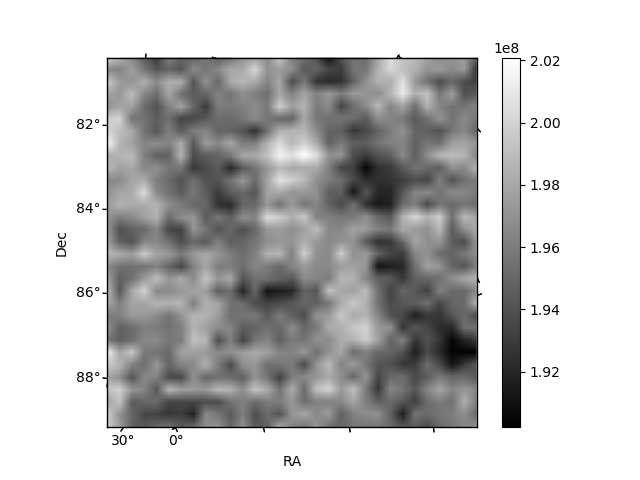
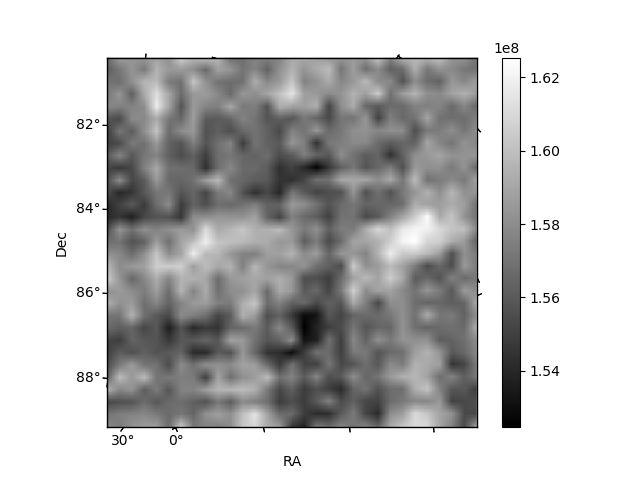
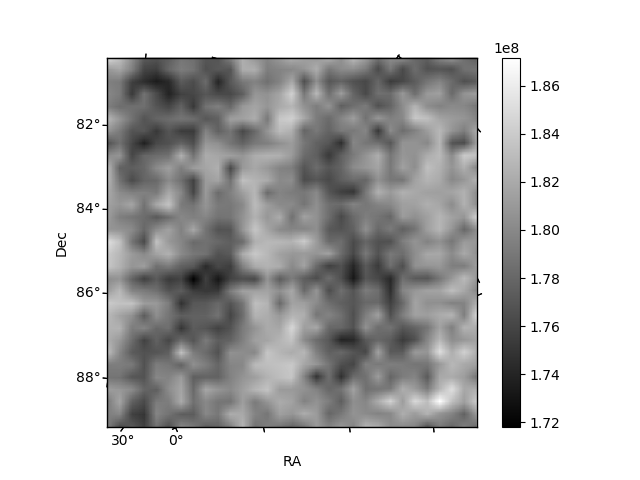
Histogram calculated using DETX and DETY for each event in the final _common_clean file
| Quadrant A | 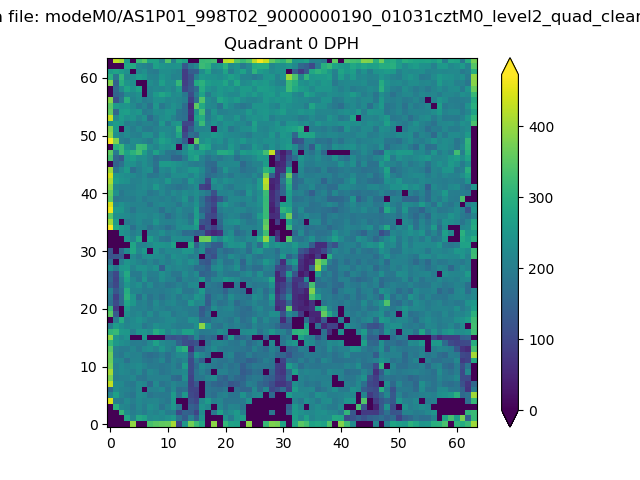 |
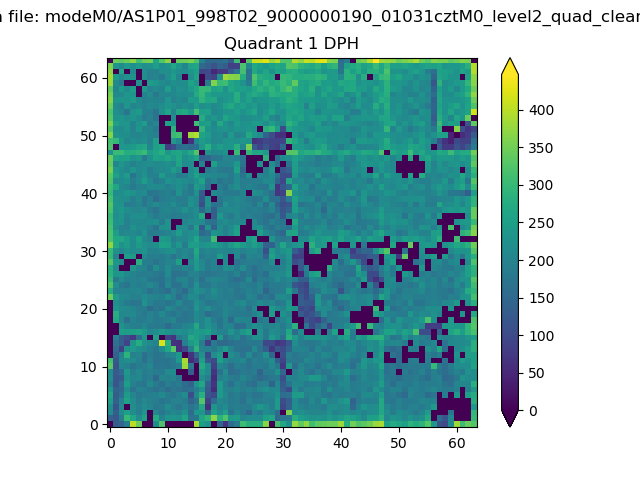 |
Quadrant B |
|---|---|---|---|
| Quadrant D | 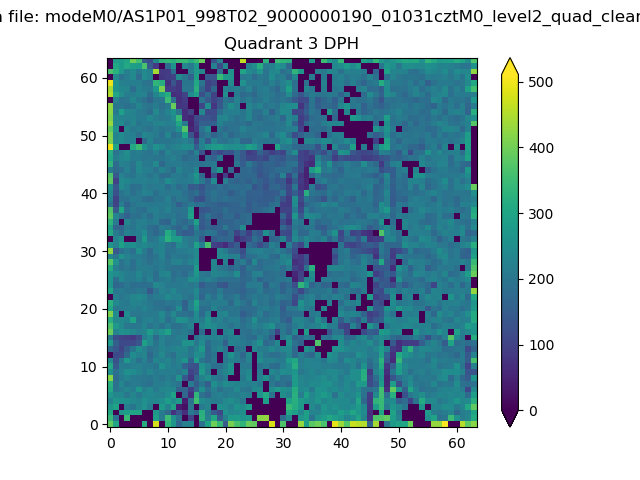 |
 |
Quadrant C |
| Plot type | Count rate plots | Images |
|---|---|---|
| Comparison with Poisson distribution Blue bars denote a histogram of data divided into 1 sec bins. Red curve is a Poisson curve with rate = median count rate of data. |
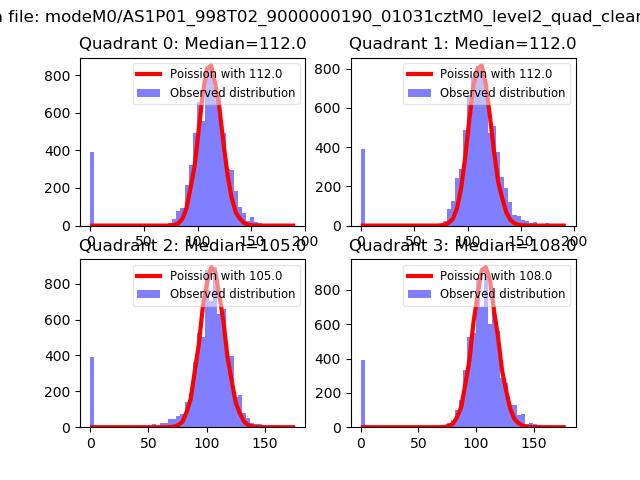 |
 |
| Quadrant-wise count rates Data is divided into 100 sec bins |
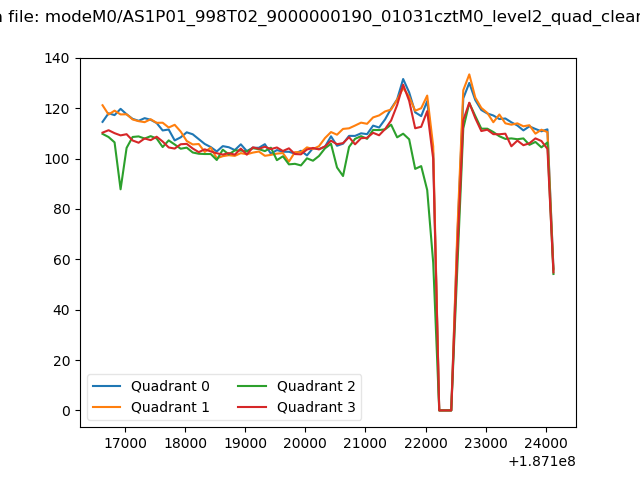 |
|
| Module-wise count rates for Quadrant A Data is divided into 100 sec bins |
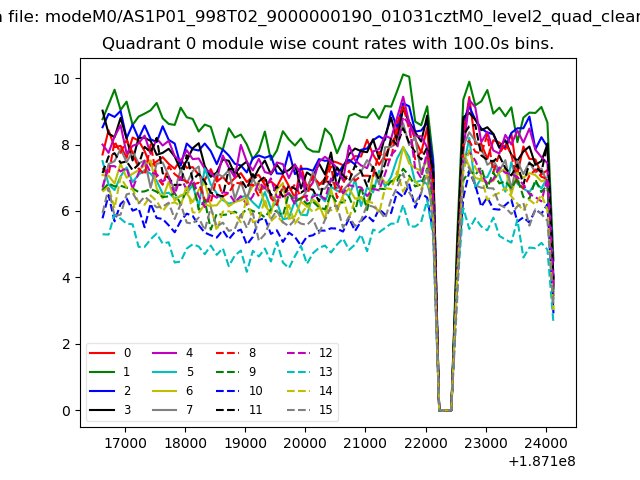 |
 |
| Module-wise count rates for Quadrant B Data is divided into 100 sec bins |
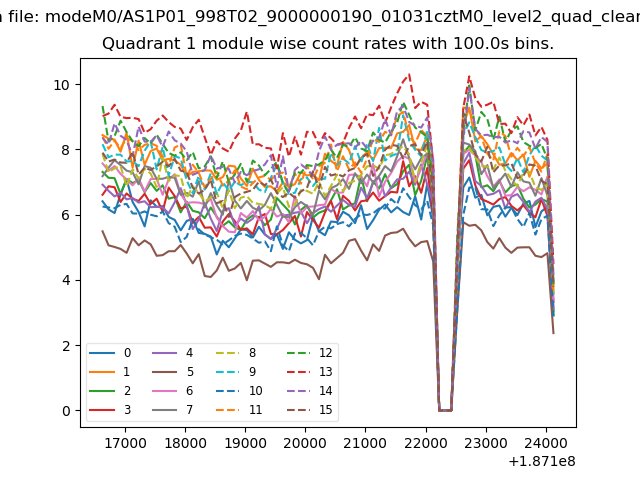 |
 |
| Module-wise count rates for Quadrant C Data is divided into 100 sec bins |
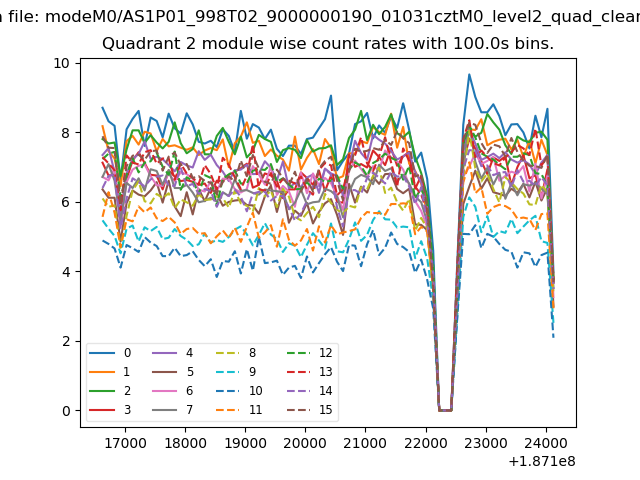 |
 |
| Module-wise count rates for Quadrant D Data is divided into 100 sec bins |
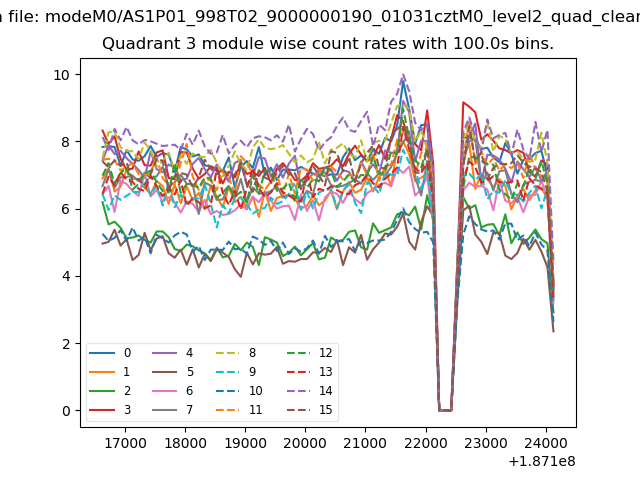 |
 |
| Parameter | Plot |
|---|---|
| CZT HV Monitor | 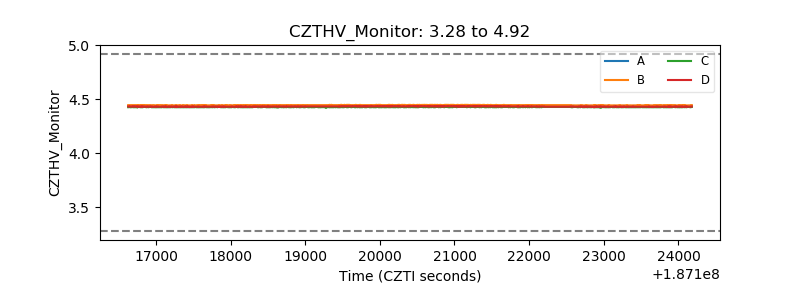 |
| D_VDD | 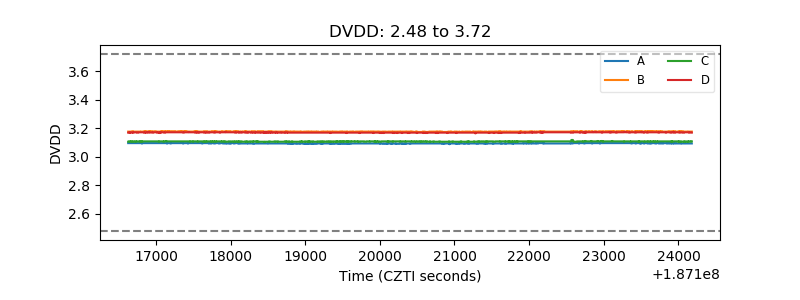 |
| Temperature 1 | 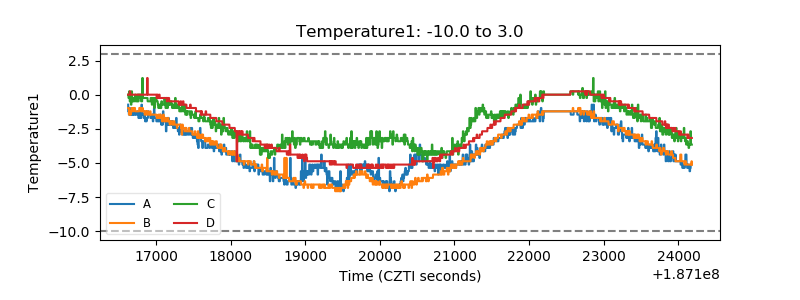 |
| Veto HV Monitor | 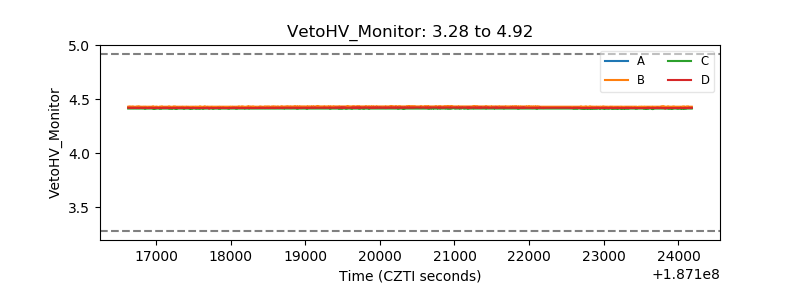 |
| Veto LLD | 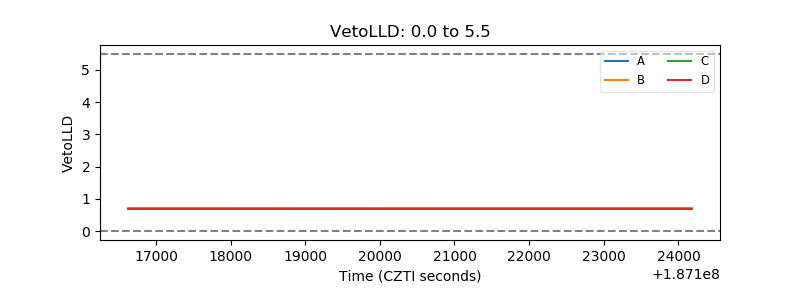 |
| Alpha Counter | 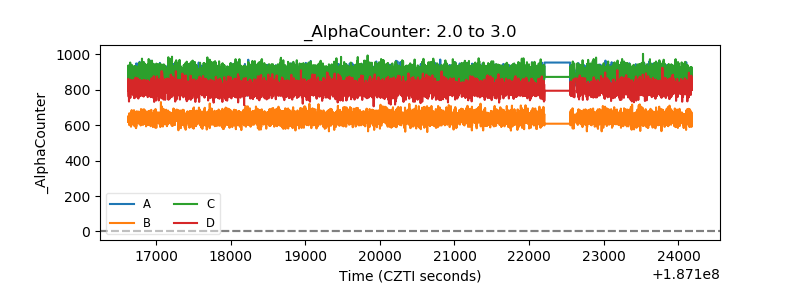 |
| _CPM_Rate | 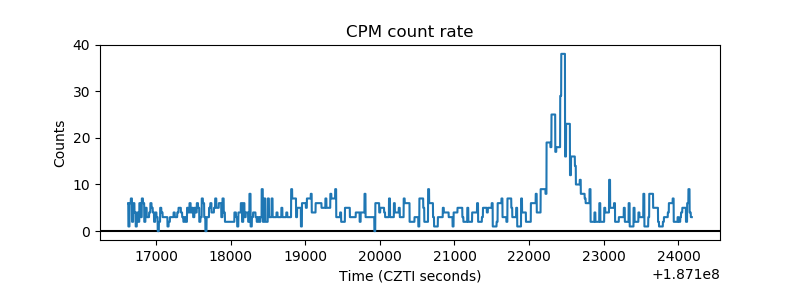 |
| CZT Counter | 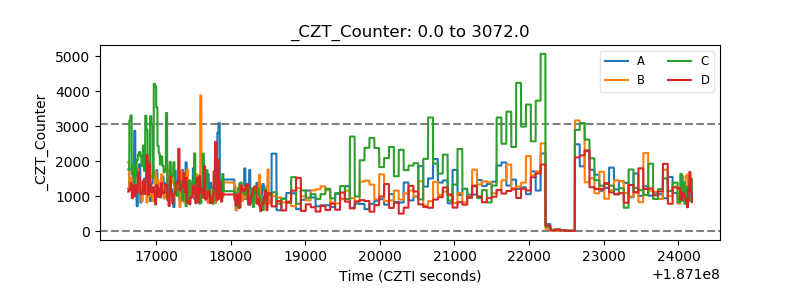 |
| +2.5 Volts monitor |  |
| +5 Volts monitor |  |
| _ROLL_ROT | 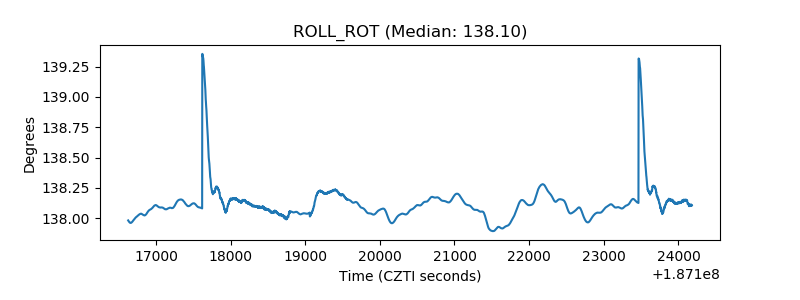 |
| _Roll_DEC | 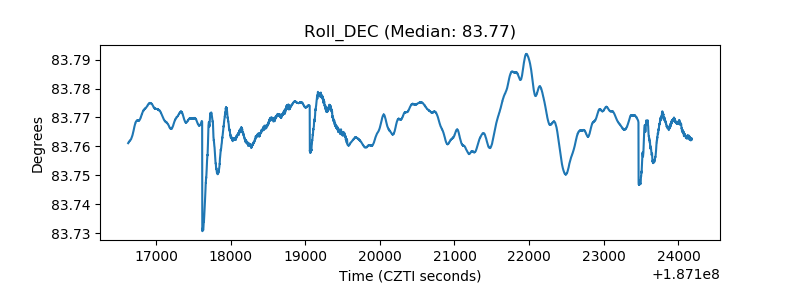 |
| _Roll_RA | 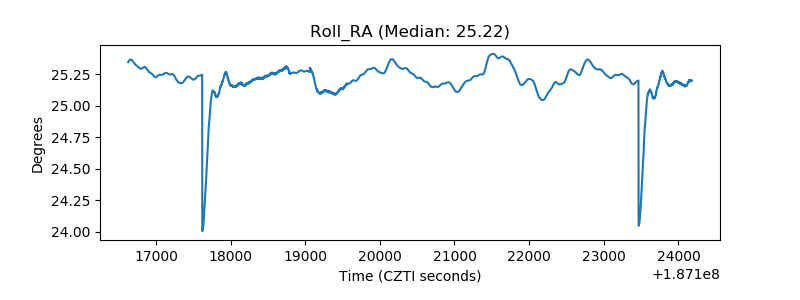 |
| Veto Counter | 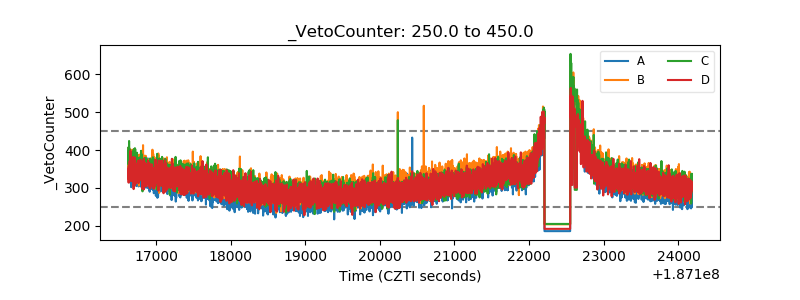 |