| Param | Original file | Final file |
|---|---|---|
| Filename | modeM0/AS1P01_998T02_9000000190_01033cztM0_level2.evt | modeM0/AS1P01_998T02_9000000190_01033cztM0_level2_quad_clean.evt |
| Size (bytes) | 1,776,620,160 | 162,737,280 |
| Size | 1.7 GB | 155.2 MB |
| Events in quadrant A | 13,159,569 | 1,063,618 |
| Events in quadrant B | 13,582,375 | 1,063,673 |
| Events in quadrant C | 14,199,209 | 1,026,495 |
| Events in quadrant D | 12,148,785 | 1,025,379 |
| Mode M0 | |||
|---|---|---|---|
| Quadrant | BADHDUFLAG | Total packets | Discarded packets |
| A | 0 | 47038 | 323 |
| B | 0 | 48359 | 319 |
| C | 0 | 50205 | 331 |
| D | 0 | 44170 | 354 |
| Mode SS | |||
|---|---|---|---|
| Quadrant | BADHDUFLAG | Total packets | Discarded packets |
| A | 0 | 226 | 0 |
| B | 0 | 226 | 2 |
| C | 0 | 226 | 0 |
| D | 0 | 226 | 0 |
| Mode M9 | |||
|---|---|---|---|
| Quadrant | BADHDUFLAG | Total packets | Discarded packets |
| A | 0 | 5 | 0 |
| B | 0 | 5 | 0 |
| C | 0 | 5 | 0 |
| D | 0 | 5 | 0 |
| Quadrant | Total seconds | Saturated seconds | Saturation percentage |
|---|---|---|---|
| A | 10816 | 48 | 0.443787% |
| B | 10816 | 46 | 0.425296% |
| C | 10811 | 180 | 1.664971% |
| D | 10801 | 36 | 0.333302% |
Noise dominated data is calculated using 1-second bins in cleaned event files. If a bin has >2000 counts, and if more than 50% of those come from <1% of pixels, then it is considered to be noise-dominated and hence unusable.
| Quadrant | # 1 sec bins | Bins with >0 counts | Bins with >2000 counts | High rate bins dominated by noise | Noise dominated (total time) | Noise dominated (detector-on time) | Marked lightcurve |
|---|---|---|---|---|---|---|---|
| A | 14130 | 10862 | 477 | 477 | 3.38% | 4.39% | 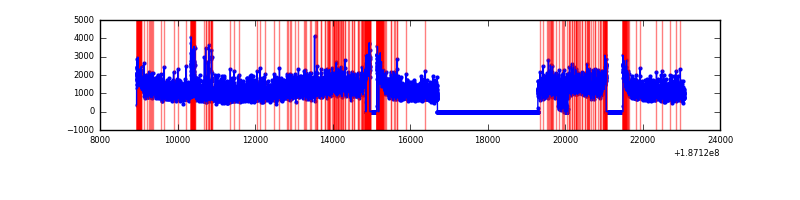 |
| B | 14129 | 10857 | 529 | 529 | 3.74% | 4.87% | 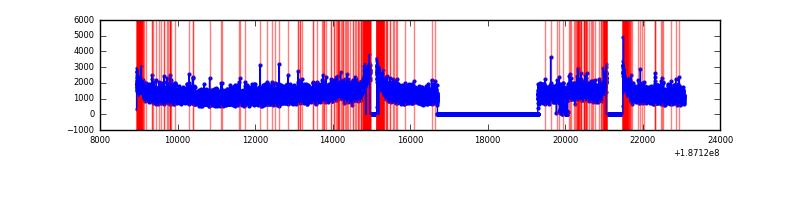 |
| C | 14129 | 10849 | 921 | 921 | 6.52% | 8.49% | 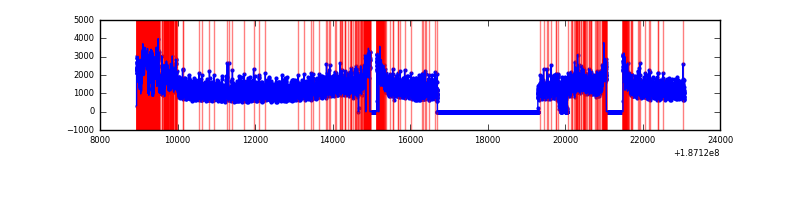 |
| D | 14129 | 10851 | 327 | 327 | 2.31% | 3.01% | 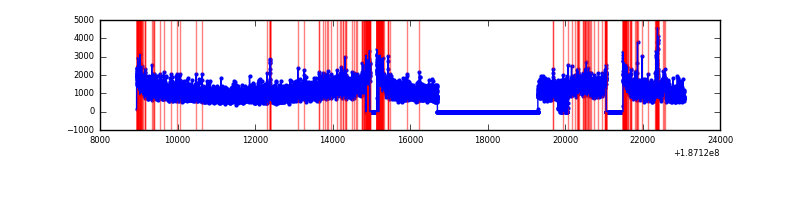 |
Top three noisy pixels from each quadrant. If the there are fewer than three noisy pixels in the level2.evt file, extra rows are filled as -1
| Pixel properties | Quadrant properties | ||||||
|---|---|---|---|---|---|---|---|
| Quadrant | DetID | PixID | Counts | Sigma | Mean | Median | Sigma |
| A | 4 | 32 | 197485 | 240.44 | 3365 | 3386 | 807.3 |
| A | 15 | 233 | 33000 | 36.68 | 3365 | 3386 | 807.3 |
| A | 8 | 14 | 18288 | 18.46 | 3365 | 3386 | 807.3 |
| B | 0 | 220 | 50130 | 56.1 | 3529 | 3537 | 830.6 |
| B | 5 | 249 | 32435 | 34.79 | 3529 | 3537 | 830.6 |
| B | 15 | 22 | 28642 | 30.23 | 3529 | 3537 | 830.6 |
| C | 8 | 208 | 837048 | 906.57 | 3269 | 3388 | 919.6 |
| C | 15 | 241 | 490381 | 529.58 | 3269 | 3388 | 919.6 |
| C | 3 | 111 | 46287 | 46.65 | 3269 | 3388 | 919.6 |
| D | 1 | 83 | 148630 | 149.15 | 3161 | 3275 | 974.6 |
| D | 10 | 125 | 79500 | 78.22 | 3161 | 3275 | 974.6 |
| D | 9 | 65 | 21771 | 18.98 | 3161 | 3275 | 974.6 |
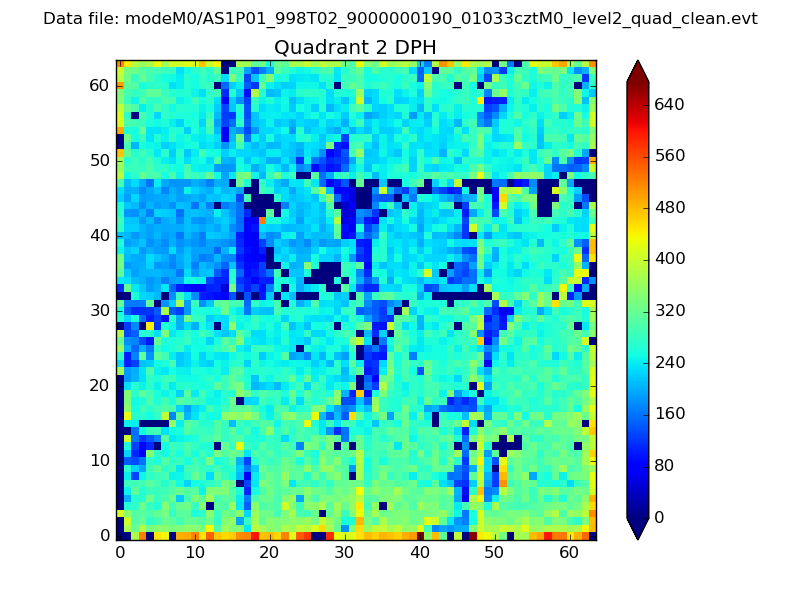
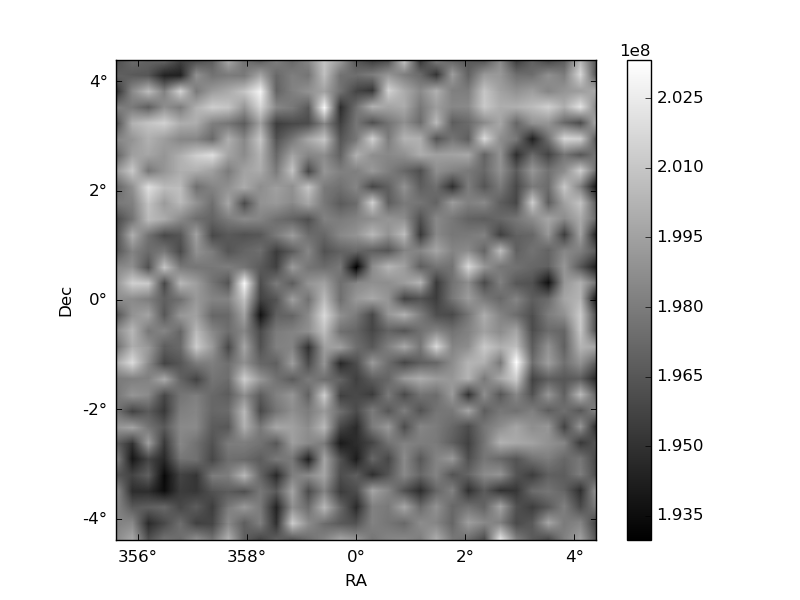
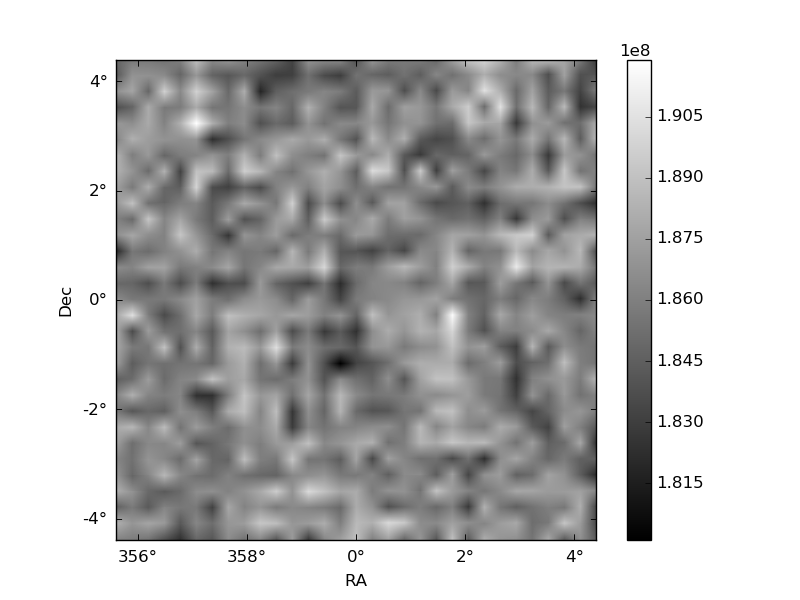
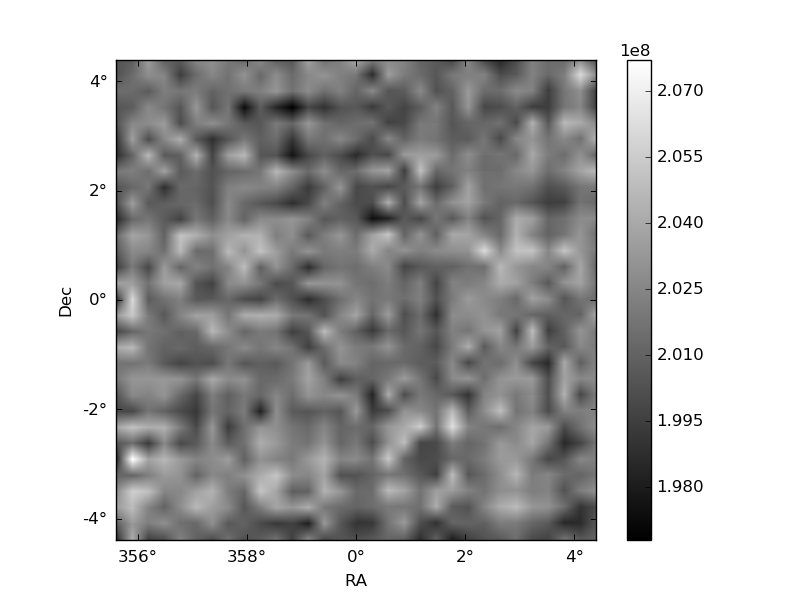
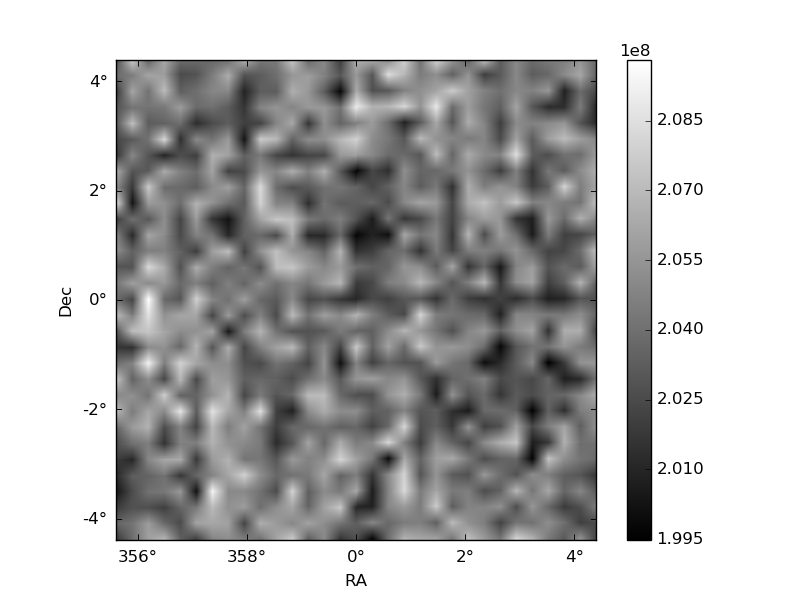
Histogram calculated using DETX and DETY for each event in the final _common_clean file
| Quadrant A | 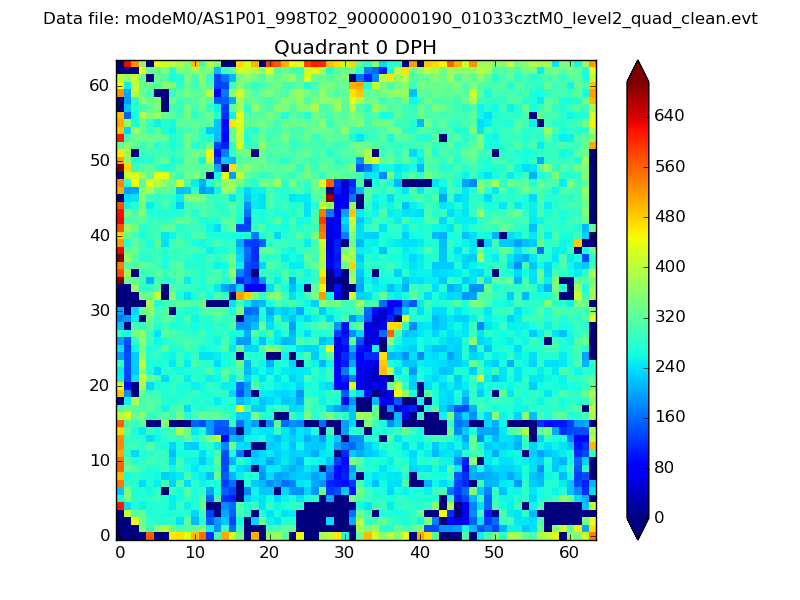 |
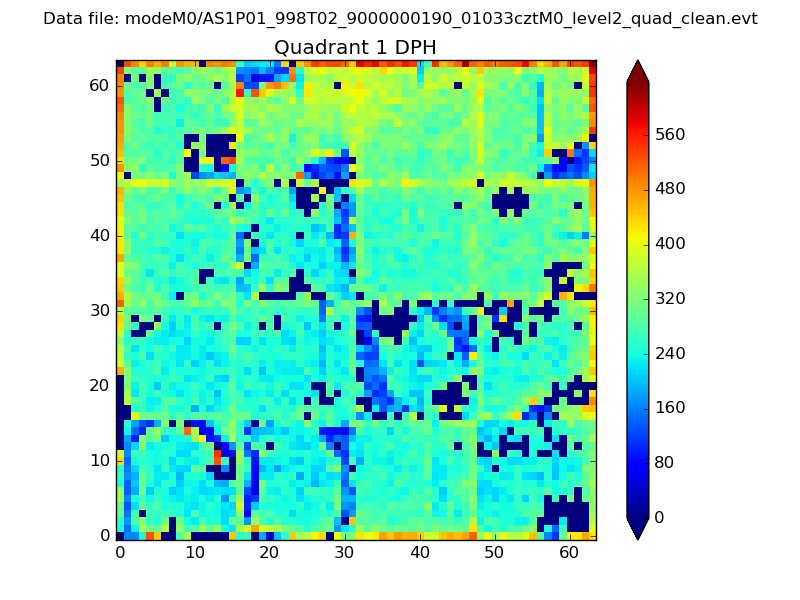 |
Quadrant B |
|---|---|---|---|
| Quadrant D | 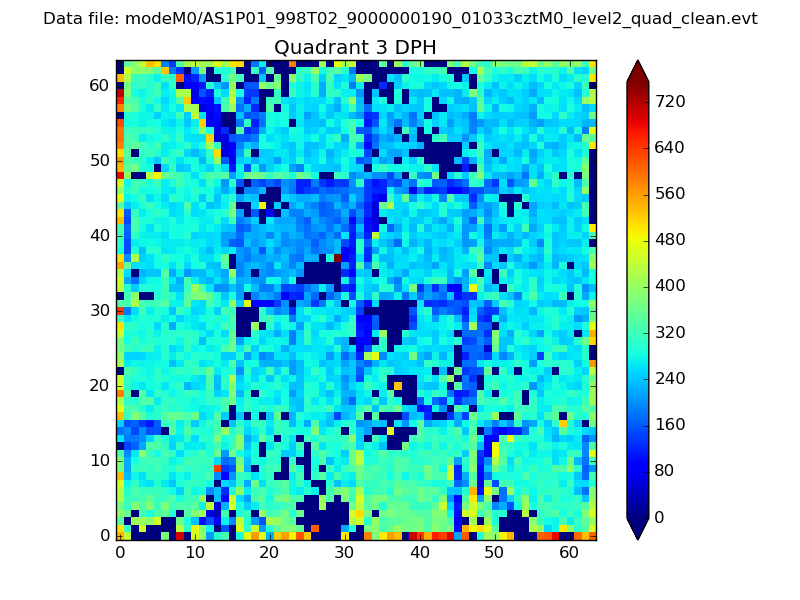 |
 |
Quadrant C |
| Plot type | Count rate plots | Images |
|---|---|---|
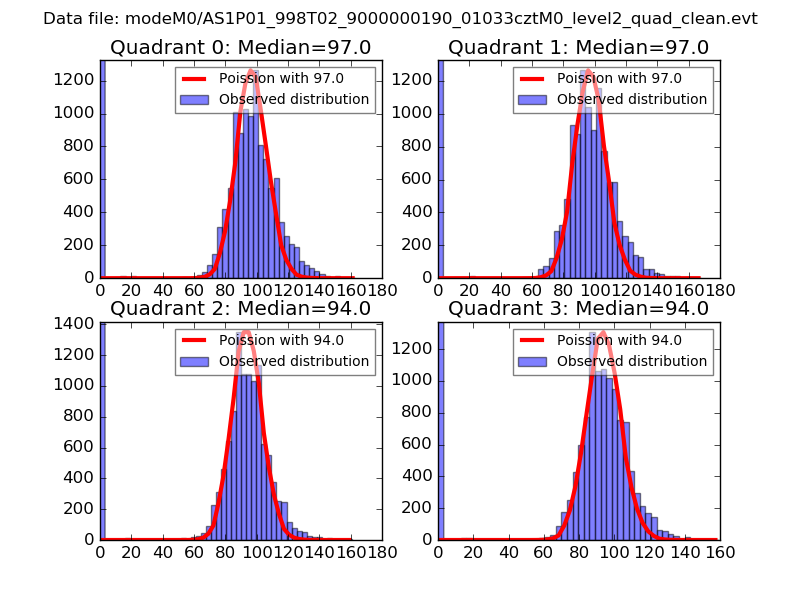
| Comparison with Poisson distribution Blue bars denote a histogram of data divided into 1 sec bins. Red curve is a Poisson curve with rate = median count rate of data. |
 |
 |
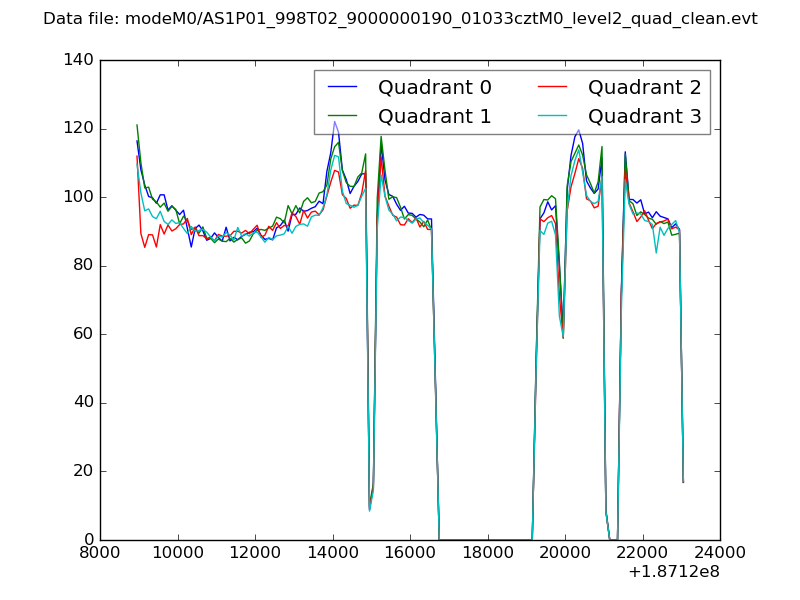
| Quadrant-wise count rates Data is divided into 100 sec bins |
 |
|
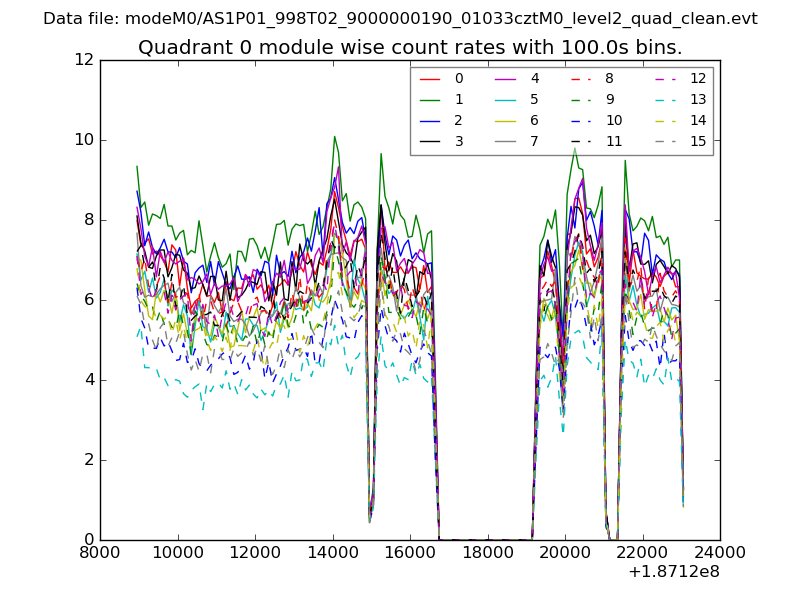
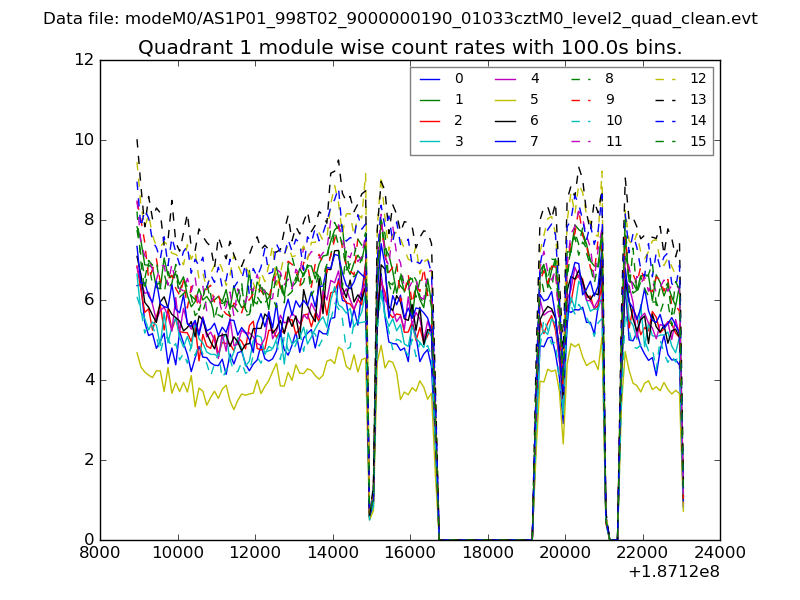
| Module-wise count rates for Quadrant A Data is divided into 100 sec bins |
 |
 |
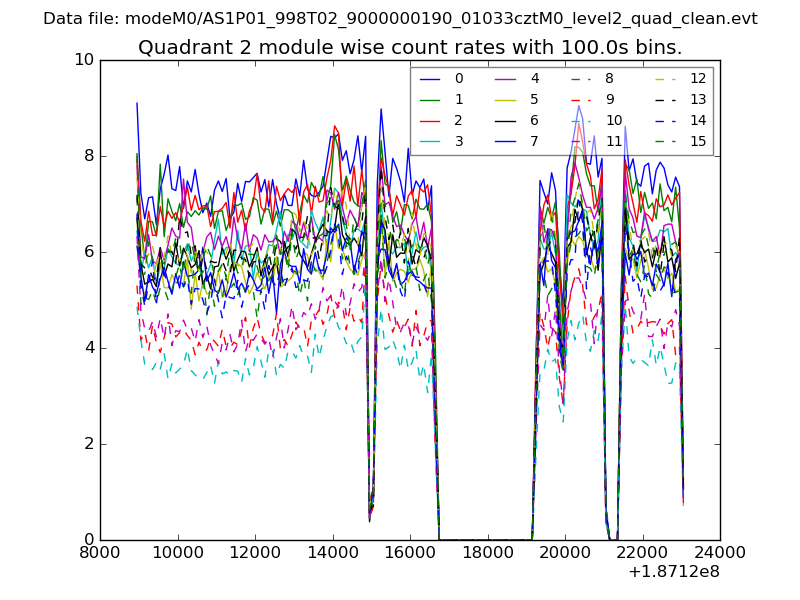
| Module-wise count rates for Quadrant B Data is divided into 100 sec bins |
 |
 |
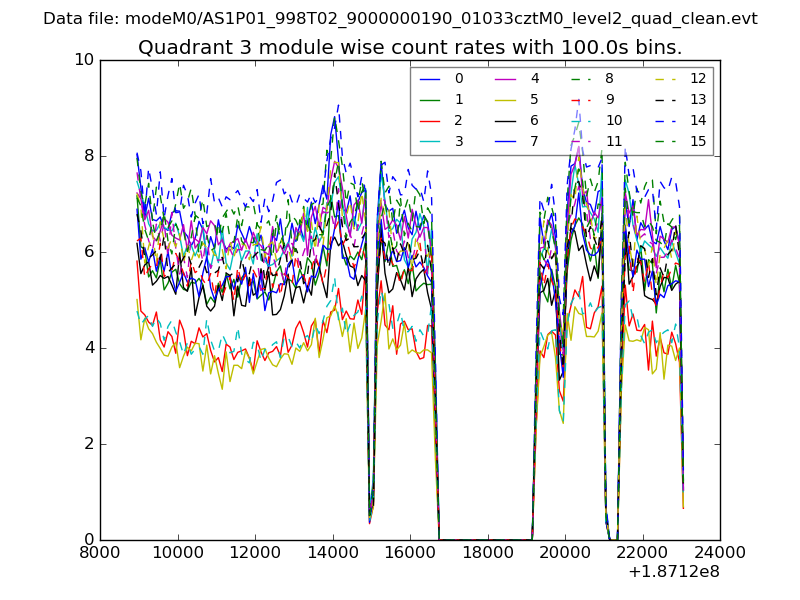
| Module-wise count rates for Quadrant C Data is divided into 100 sec bins |
 |
 |
| Module-wise count rates for Quadrant D Data is divided into 100 sec bins |
 |
 |
| Parameter | Plot |
|---|---|
| CZT HV Monitor | 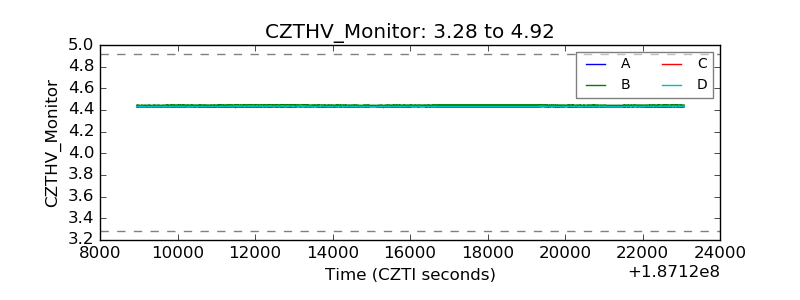 |
| D_VDD | 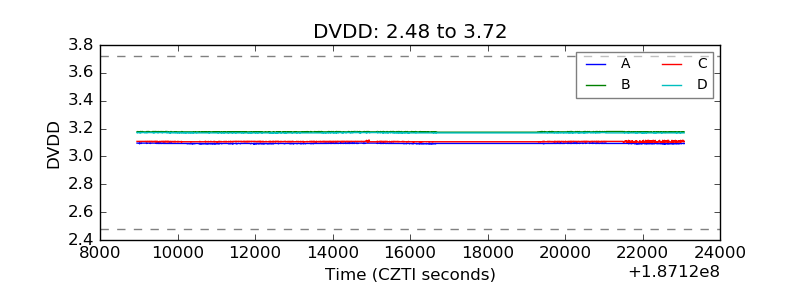 |
| Temperature 1 | 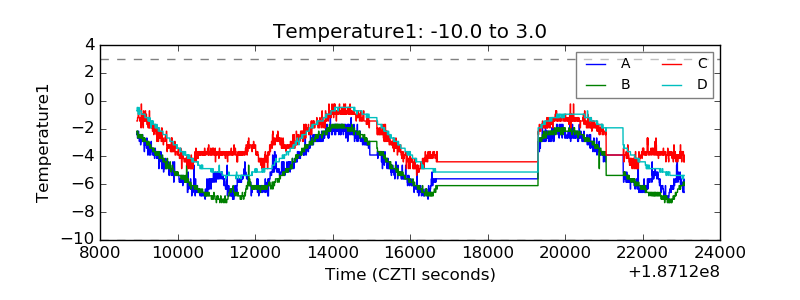 |
| Veto HV Monitor | 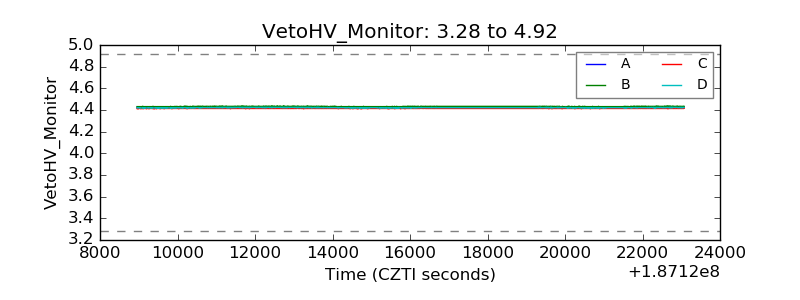 |
| Veto LLD | 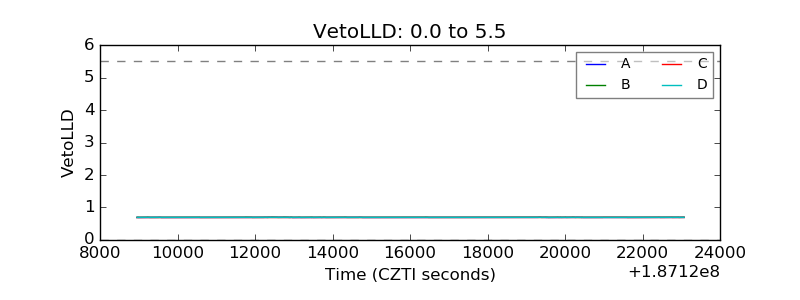 |
| Alpha Counter | 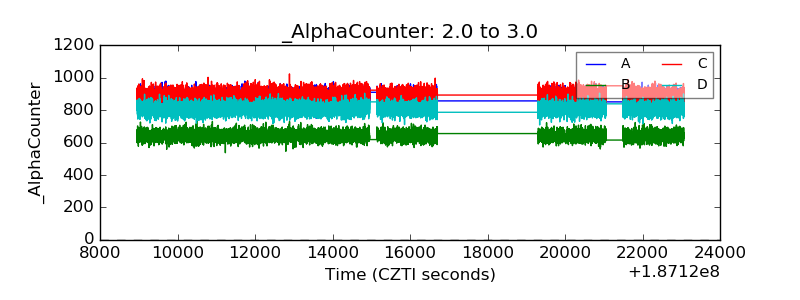 |
| _CPM_Rate | 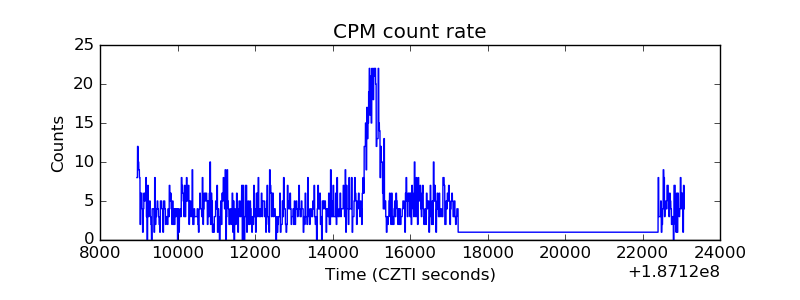 |
| CZT Counter | 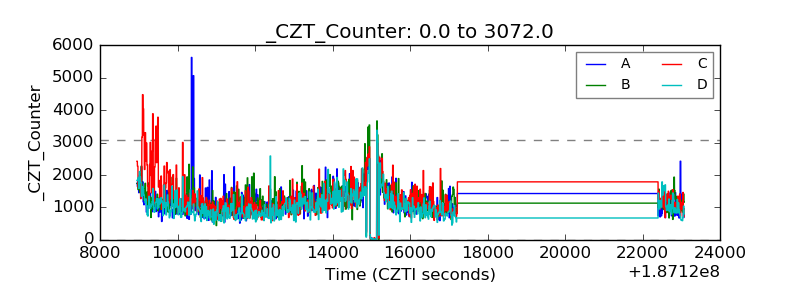 |
| +2.5 Volts monitor |  |
| +5 Volts monitor |  |
| _ROLL_ROT | 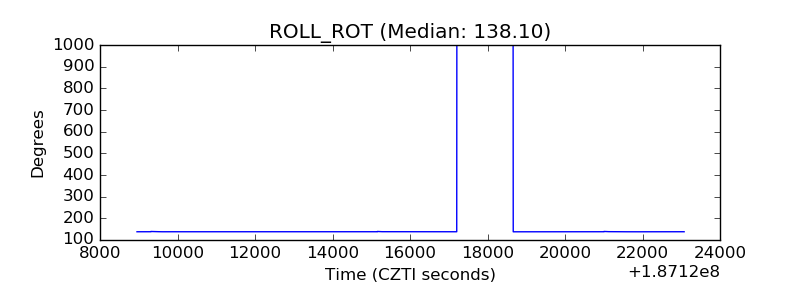 |
| _Roll_DEC | 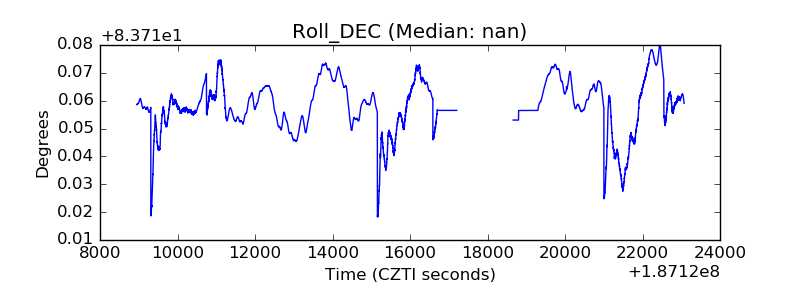 |
| _Roll_RA | 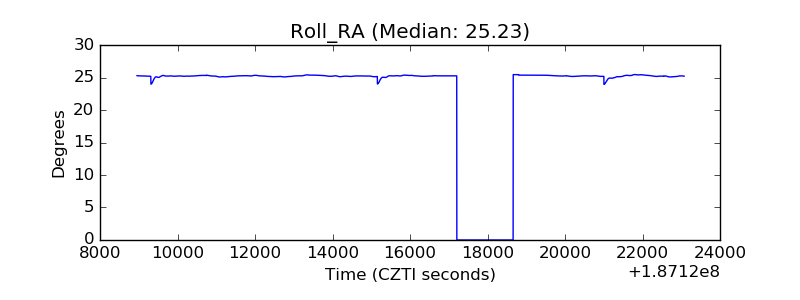 |
| Veto Counter | 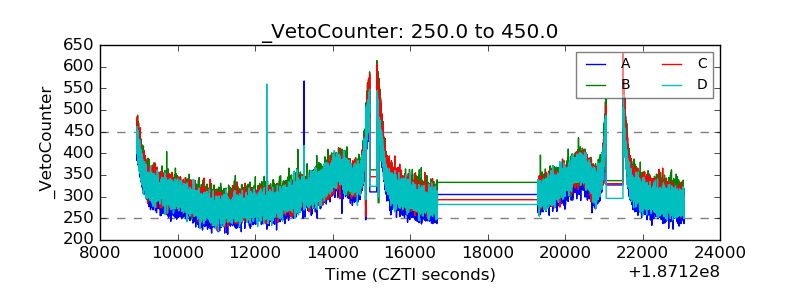 |