| Param | Original file | Final file |
|---|---|---|
| Filename | modeM0/AS1P01_998T02_9000000190_01034cztM0_level2.evt | modeM0/AS1P01_998T02_9000000190_01034cztM0_level2_quad_clean.evt |
| Size (bytes) | 569,272,320 | 58,276,800 |
| Size | 542.9 MB | 55.6 MB |
| Events in quadrant A | 4,203,855 | 388,447 |
| Events in quadrant B | 4,404,272 | 390,833 |
| Events in quadrant C | 4,374,931 | 375,760 |
| Events in quadrant D | 4,033,316 | 371,293 |
| Mode M0 | |||
|---|---|---|---|
| Quadrant | BADHDUFLAG | Total packets | Discarded packets |
| A | 0 | 15404 | 541 |
| B | 0 | 16020 | 547 |
| C | 0 | 15955 | 572 |
| D | 0 | 14931 | 564 |
| Mode SS | |||
|---|---|---|---|
| Quadrant | BADHDUFLAG | Total packets | Discarded packets |
| A | 0 | 72 | 2 |
| B | 0 | 72 | 2 |
| C | 0 | 72 | 0 |
| D | 0 | 72 | 0 |
| Mode M9 | |||
|---|---|---|---|
| Quadrant | BADHDUFLAG | Total packets | Discarded packets |
| A | 0 | 5 | 1 |
| B | 0 | 4 | 0 |
| C | 0 | 4 | 0 |
| D | 0 | 4 | 0 |
| Quadrant | Total seconds | Saturated seconds | Saturation percentage |
|---|---|---|---|
| A | 3359 | 3 | 0.089312% |
| B | 3358 | 17 | 0.506254% |
| C | 3349 | 3 | 0.089579% |
| D | 3344 | 22 | 0.657895% |
Noise dominated data is calculated using 1-second bins in cleaned event files. If a bin has >2000 counts, and if more than 50% of those come from <1% of pixels, then it is considered to be noise-dominated and hence unusable.
| Quadrant | # 1 sec bins | Bins with >0 counts | Bins with >2000 counts | High rate bins dominated by noise | Noise dominated (total time) | Noise dominated (detector-on time) | Marked lightcurve |
|---|---|---|---|---|---|---|---|
| A | 3878 | 3399 | 128 | 128 | 3.30% | 3.77% | 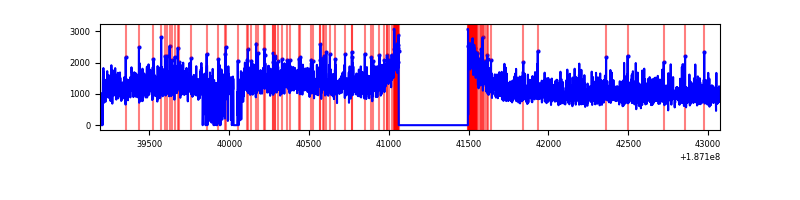 |
| B | 3880 | 3396 | 166 | 166 | 4.28% | 4.89% | 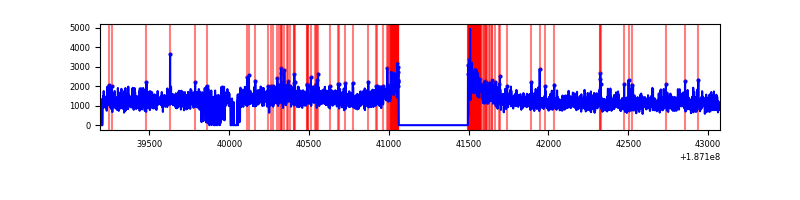 |
| C | 3884 | 3396 | 171 | 171 | 4.40% | 5.04% | 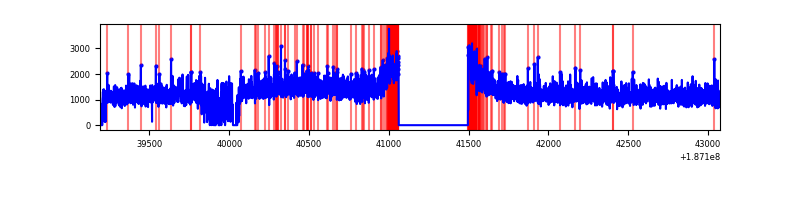 |
| D | 3878 | 3393 | 117 | 117 | 3.02% | 3.45% | 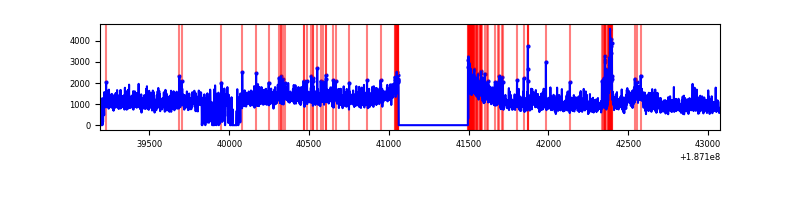 |
Top three noisy pixels from each quadrant. If the there are fewer than three noisy pixels in the level2.evt file, extra rows are filled as -1
| Pixel properties | Quadrant properties | ||||||
|---|---|---|---|---|---|---|---|
| Quadrant | DetID | PixID | Counts | Sigma | Mean | Median | Sigma |
| A | 8 | 14 | 15174 | 53.67 | 1088 | 1096 | 262.3 |
| A | 4 | 32 | 12505 | 43.5 | 1088 | 1096 | 262.3 |
| A | 13 | 9 | 3461 | 9.02 | 1088 | 1096 | 262.3 |
| B | 5 | 249 | 15543 | 53.45 | 1136 | 1139 | 269.5 |
| B | 0 | 220 | 14994 | 51.41 | 1136 | 1139 | 269.5 |
| B | 15 | 255 | 14281 | 48.77 | 1136 | 1139 | 269.5 |
| C | 15 | 241 | 156776 | 522.01 | 1061 | 1100 | 298.2 |
| C | 8 | 208 | 40564 | 132.33 | 1061 | 1100 | 298.2 |
| C | 3 | 111 | 14397 | 44.59 | 1061 | 1100 | 298.2 |
| D | 1 | 83 | 144886 | 452.99 | 1021 | 1056 | 317.5 |
| D | 13 | 88 | 24740 | 74.59 | 1021 | 1056 | 317.5 |
| D | 13 | 73 | 16926 | 49.98 | 1021 | 1056 | 317.5 |
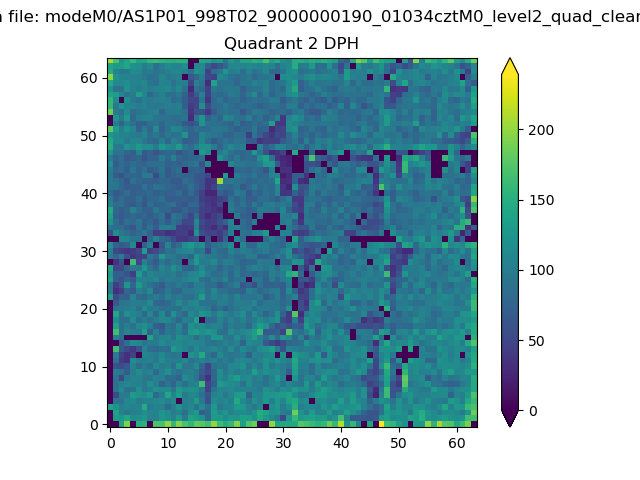
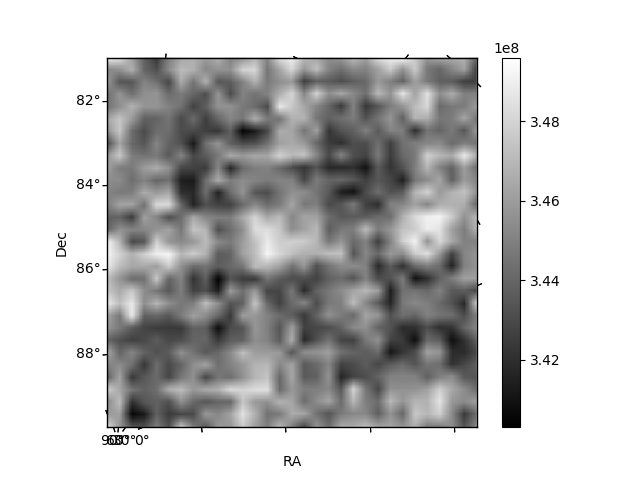
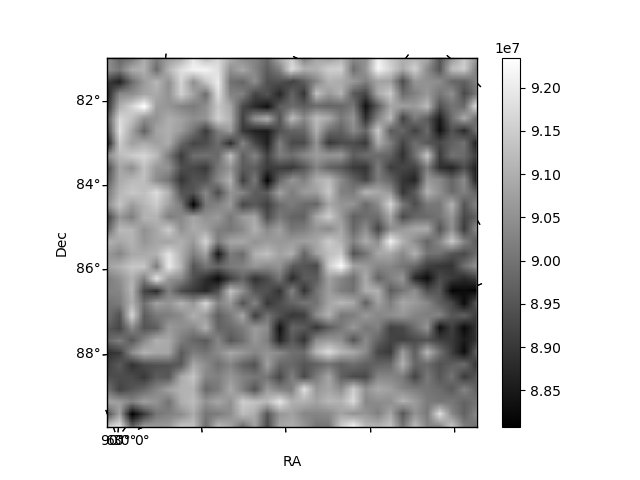
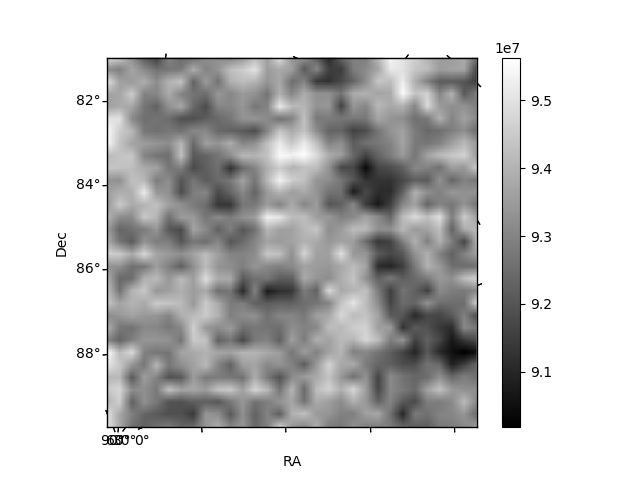
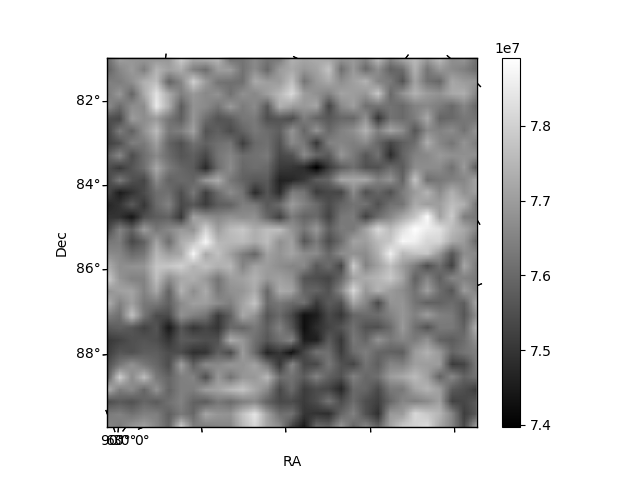
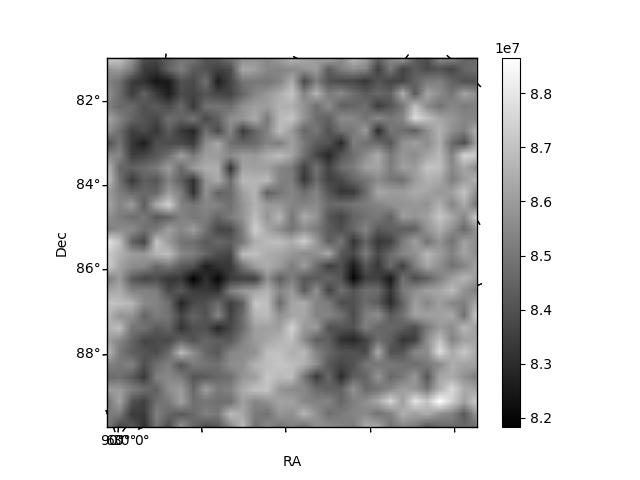
Histogram calculated using DETX and DETY for each event in the final _common_clean file
| Quadrant A | 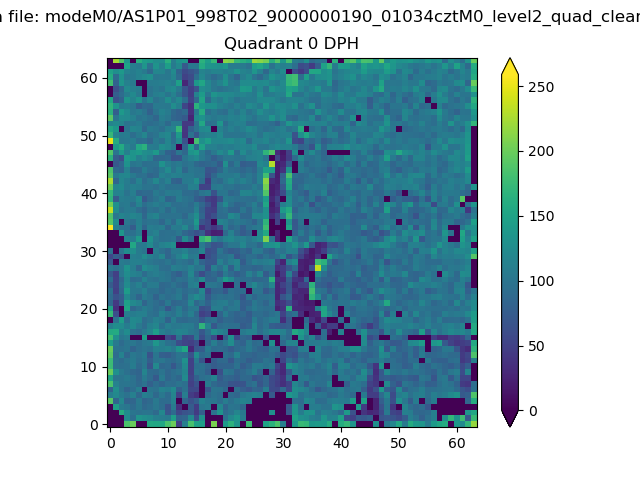 |
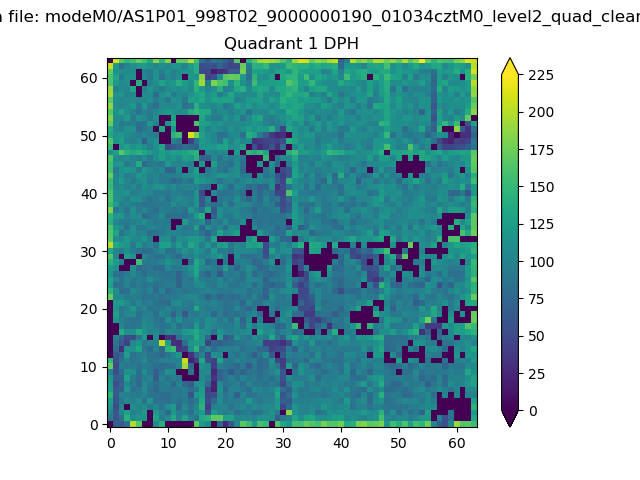 |
Quadrant B |
|---|---|---|---|
| Quadrant D | 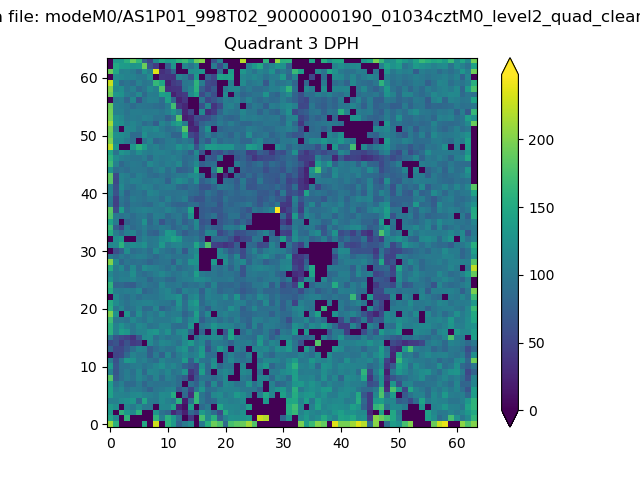 |
 |
Quadrant C |
| Plot type | Count rate plots | Images |
|---|---|---|
| Comparison with Poisson distribution Blue bars denote a histogram of data divided into 1 sec bins. Red curve is a Poisson curve with rate = median count rate of data. |
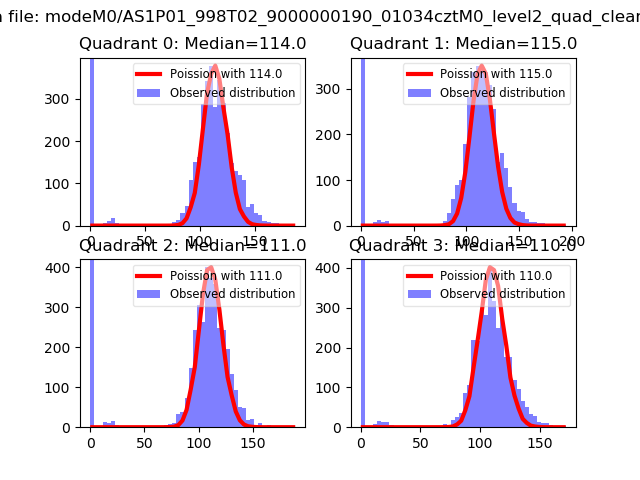 |
 |
| Quadrant-wise count rates Data is divided into 100 sec bins |
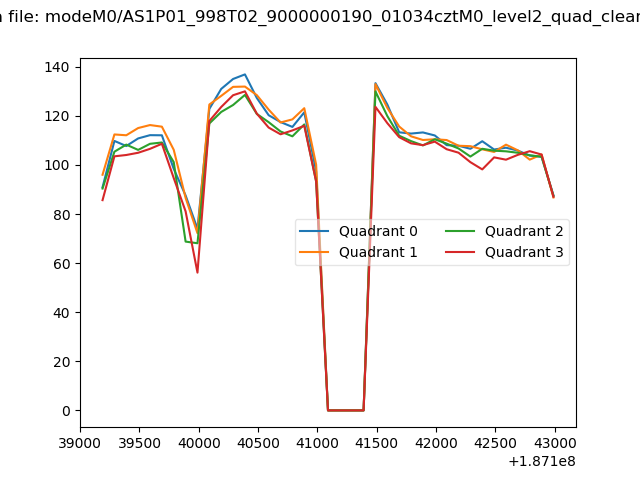 |
|
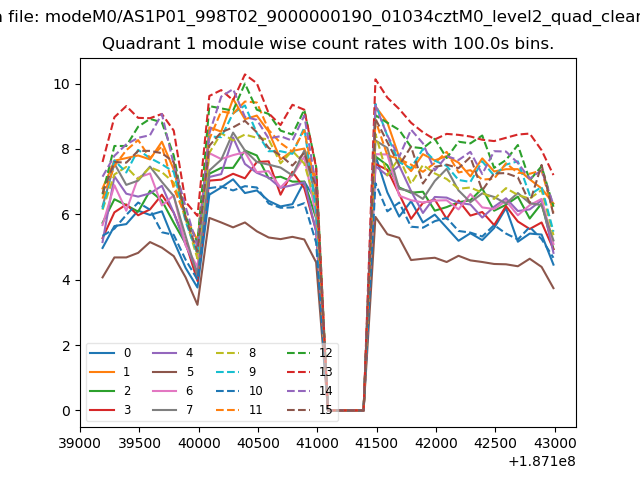
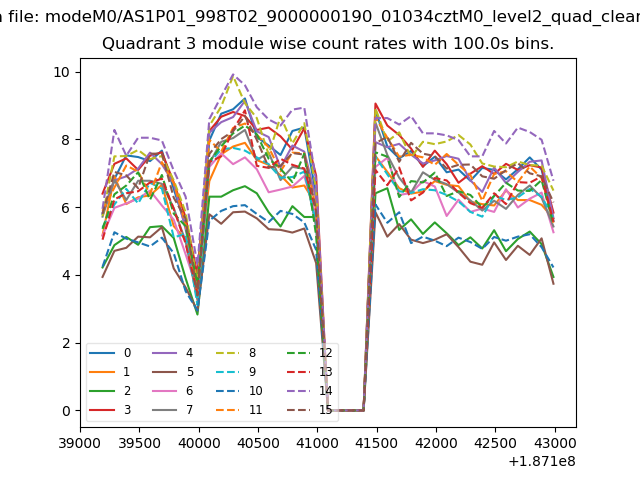
| Module-wise count rates for Quadrant A Data is divided into 100 sec bins |
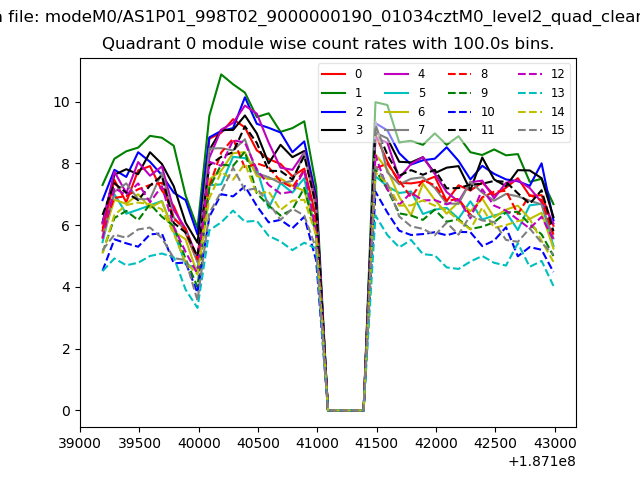 |
 |
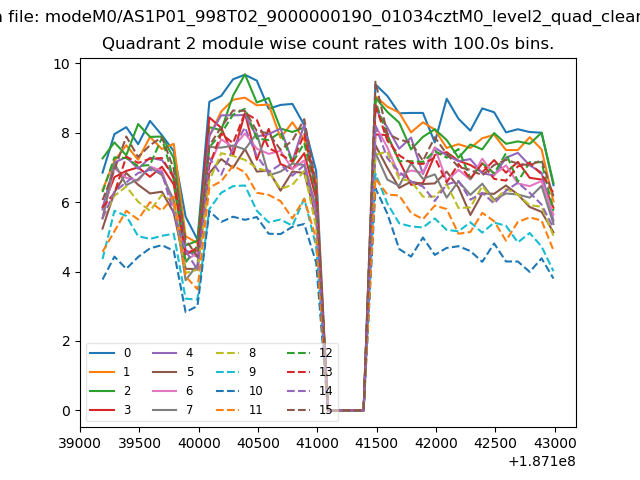
| Module-wise count rates for Quadrant B Data is divided into 100 sec bins |
 |
 |
| Module-wise count rates for Quadrant C Data is divided into 100 sec bins |
 |
 |
| Module-wise count rates for Quadrant D Data is divided into 100 sec bins |
 |
 |
| Parameter | Plot |
|---|---|
| CZT HV Monitor | 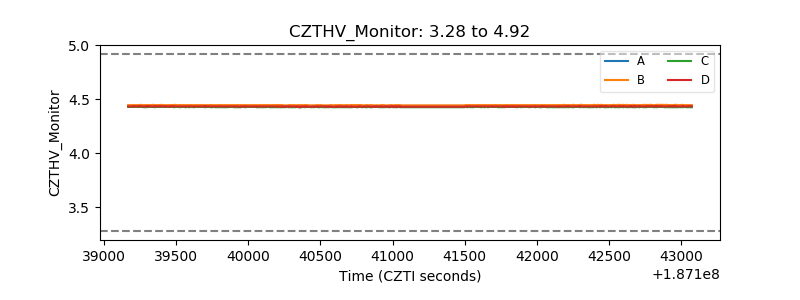 |
| D_VDD | 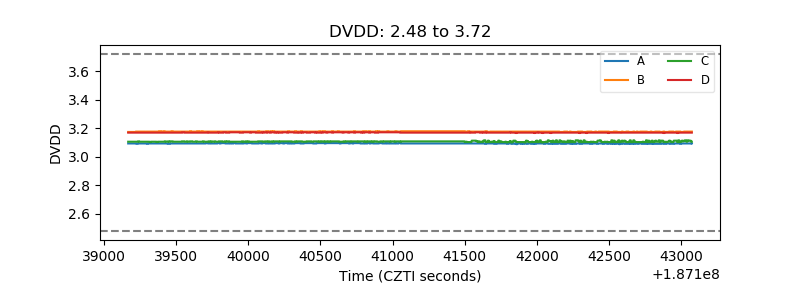 |
| Temperature 1 | 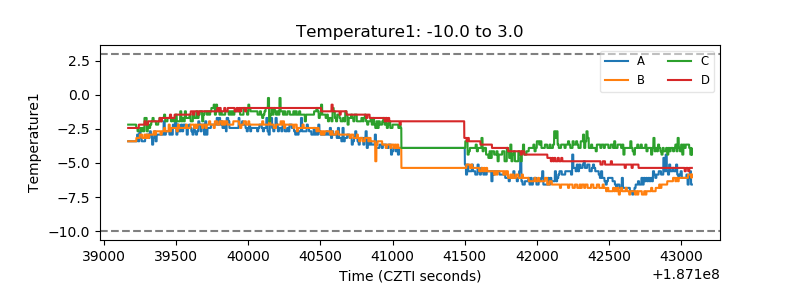 |
| Veto HV Monitor | 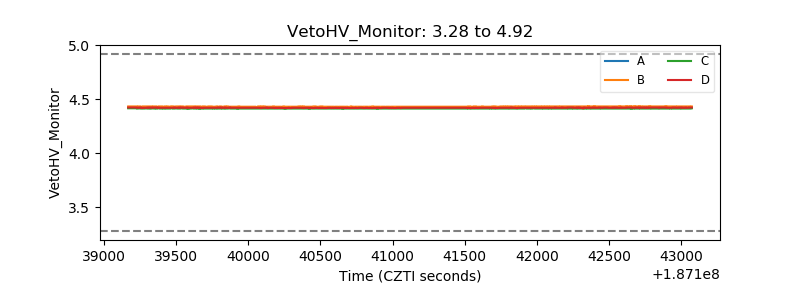 |
| Veto LLD | 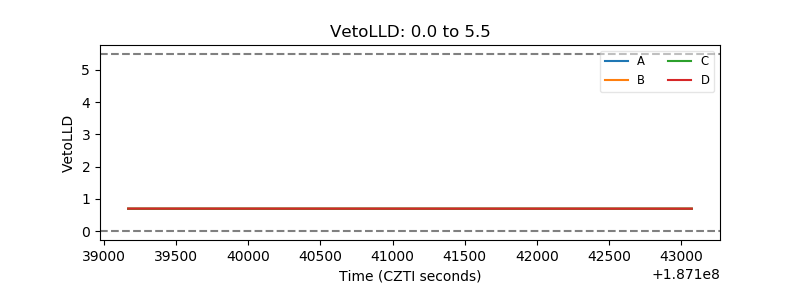 |
| Alpha Counter | 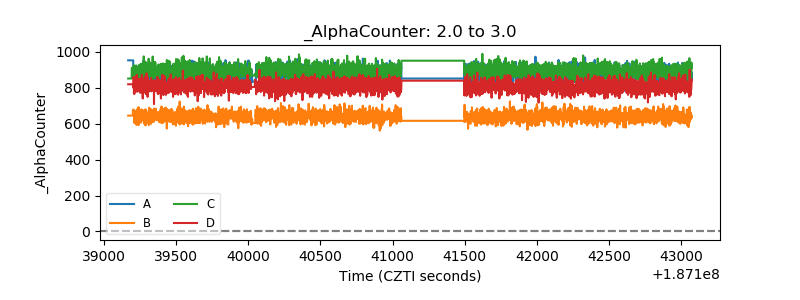 |
| _CPM_Rate | 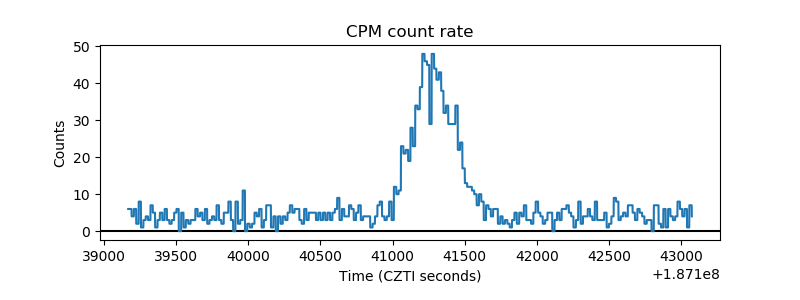 |
| CZT Counter | 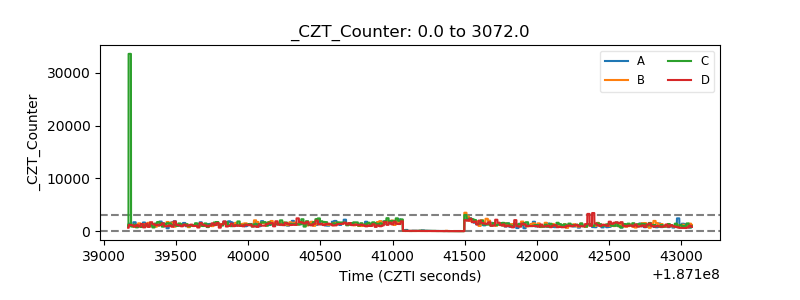 |
| +2.5 Volts monitor |  |
| +5 Volts monitor |  |
| _ROLL_ROT | 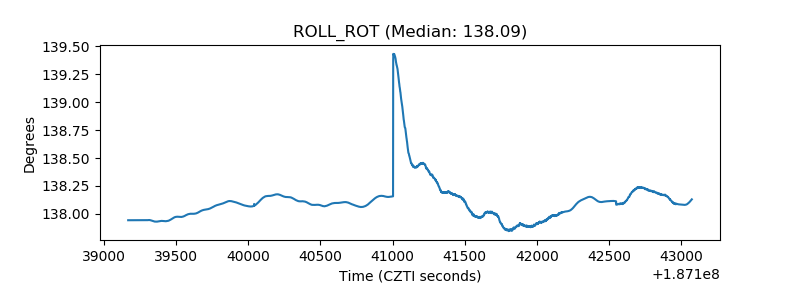 |
| _Roll_DEC | 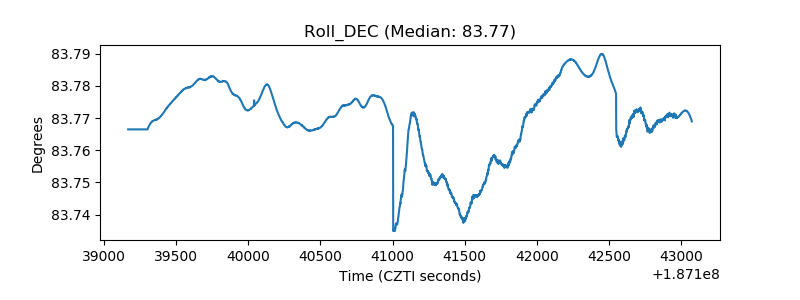 |
| _Roll_RA | 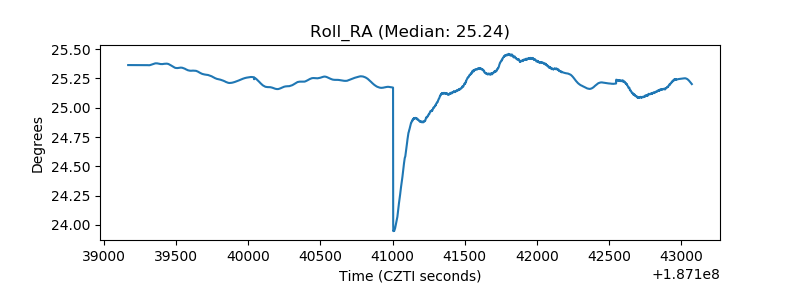 |
| Veto Counter | 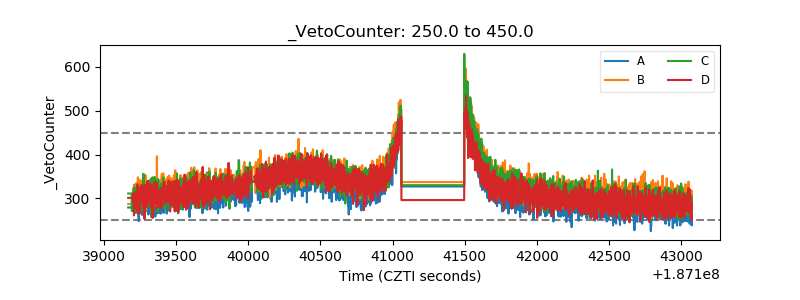 |