| Param | Original file | Final file |
|---|---|---|
| Filename | modeM0/AS1P01_998T02_9000000190_01035cztM0_level2.evt | modeM0/AS1P01_998T02_9000000190_01035cztM0_level2_quad_clean.evt |
| Size (bytes) | 1,230,759,360 | 131,002,560 |
| Size | 1.1 GB | 124.9 MB |
| Events in quadrant A | 9,150,064 | 861,868 |
| Events in quadrant B | 9,697,537 | 871,379 |
| Events in quadrant C | 9,491,685 | 849,597 |
| Events in quadrant D | 8,413,880 | 839,014 |
| Mode M0 | |||
|---|---|---|---|
| Quadrant | BADHDUFLAG | Total packets | Discarded packets |
| A | 0 | 32746 | 2 |
| B | 0 | 34386 | 2 |
| C | 0 | 33794 | 2 |
| D | 0 | 30654 | 2 |
| Mode SS | |||
|---|---|---|---|
| Quadrant | BADHDUFLAG | Total packets | Discarded packets |
| A | 0 | 162 | 0 |
| B | 0 | 162 | 0 |
| C | 0 | 162 | 0 |
| D | 0 | 162 | 0 |
| Mode M9 | |||
|---|---|---|---|
| Quadrant | BADHDUFLAG | Total packets | Discarded packets |
| A | 0 | 10 | 0 |
| B | 0 | 10 | 0 |
| C | 0 | 10 | 0 |
| D | 0 | 10 | 0 |
| Quadrant | Total seconds | Saturated seconds | Saturation percentage |
|---|---|---|---|
| A | 7851 | 7 | 0.089161% |
| B | 7852 | 19 | 0.241977% |
| C | 7852 | 10 | 0.127356% |
| D | 7852 | 25 | 0.318390% |
Noise dominated data is calculated using 1-second bins in cleaned event files. If a bin has >2000 counts, and if more than 50% of those come from <1% of pixels, then it is considered to be noise-dominated and hence unusable.
| Quadrant | # 1 sec bins | Bins with >0 counts | Bins with >2000 counts | High rate bins dominated by noise | Noise dominated (total time) | Noise dominated (detector-on time) | Marked lightcurve |
|---|---|---|---|---|---|---|---|
| A | 8931 | 7853 | 198 | 198 | 2.22% | 2.52% | 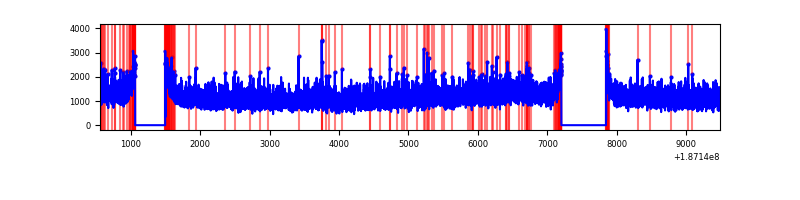 |
| B | 8932 | 7854 | 273 | 273 | 3.06% | 3.48% | 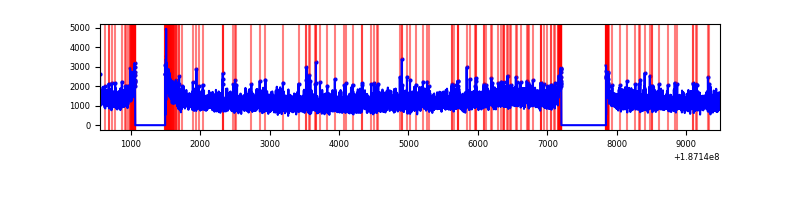 |
| C | 8932 | 7854 | 276 | 276 | 3.09% | 3.51% | 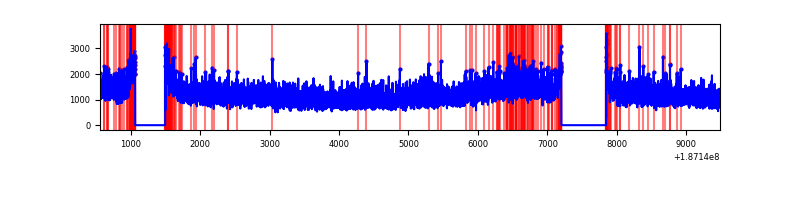 |
| D | 8932 | 7854 | 161 | 161 | 1.80% | 2.05% | 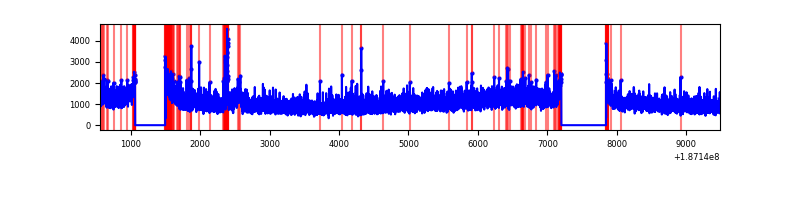 |
Top three noisy pixels from each quadrant. If the there are fewer than three noisy pixels in the level2.evt file, extra rows are filled as -1
| Pixel properties | Quadrant properties | ||||||
|---|---|---|---|---|---|---|---|
| Quadrant | DetID | PixID | Counts | Sigma | Mean | Median | Sigma |
| A | 8 | 14 | 16011 | 23.73 | 2378 | 2390 | 574.1 |
| A | 11 | 79 | 8155 | 10.04 | 2378 | 2390 | 574.1 |
| A | 3 | 111 | 7554 | 9.0 | 2378 | 2390 | 574.1 |
| B | 7 | 221 | 39782 | 63.18 | 2505 | 2514 | 589.9 |
| B | 0 | 220 | 26477 | 40.62 | 2505 | 2514 | 589.9 |
| B | 5 | 191 | 25260 | 38.56 | 2505 | 2514 | 589.9 |
| C | 15 | 241 | 374910 | 582.58 | 2286 | 2367 | 639.5 |
| C | 8 | 208 | 110844 | 169.63 | 2286 | 2367 | 639.5 |
| C | 3 | 111 | 34464 | 50.19 | 2286 | 2367 | 639.5 |
| D | 1 | 83 | 146210 | 210.59 | 2192 | 2267 | 683.5 |
| D | 10 | 125 | 21582 | 28.26 | 2192 | 2267 | 683.5 |
| D | 13 | 73 | 18843 | 24.25 | 2192 | 2267 | 683.5 |
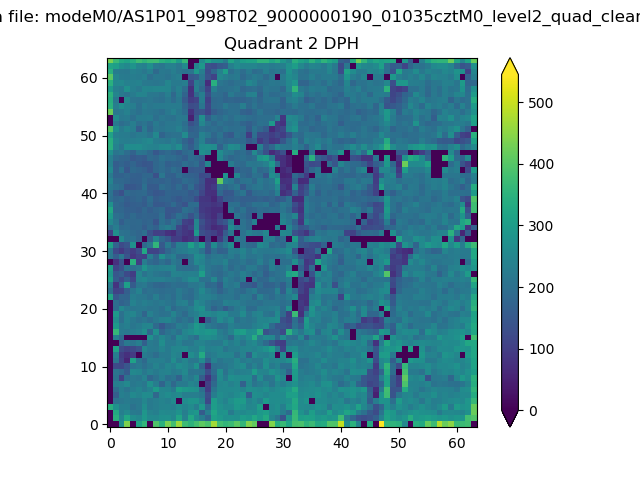
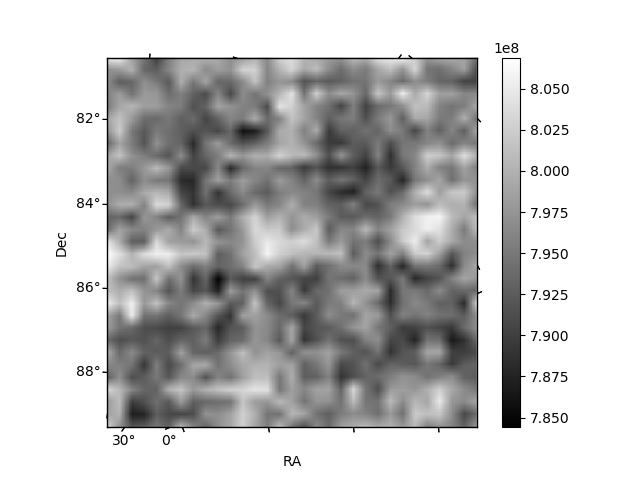
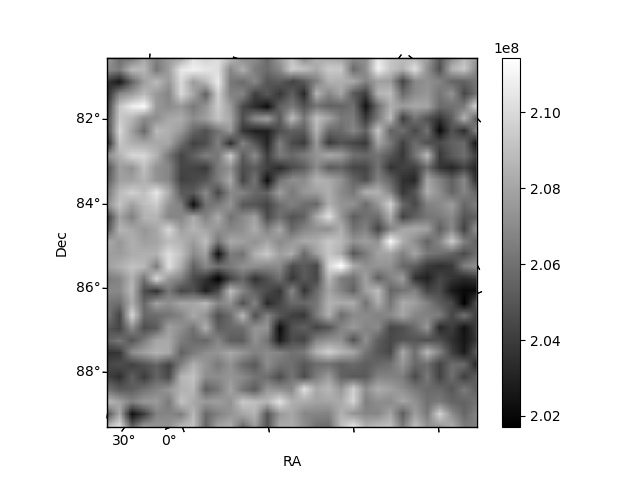
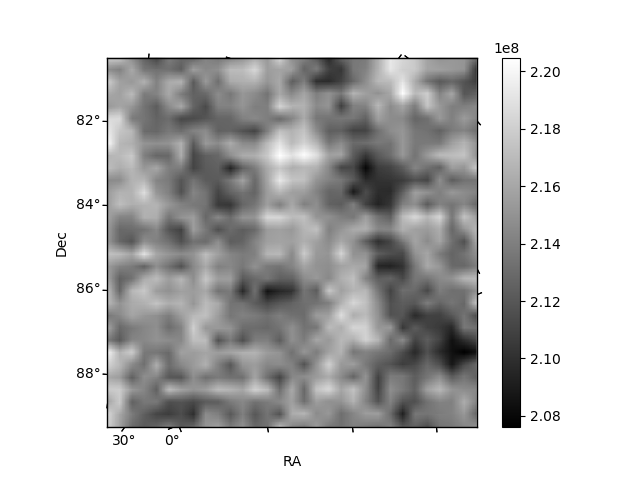
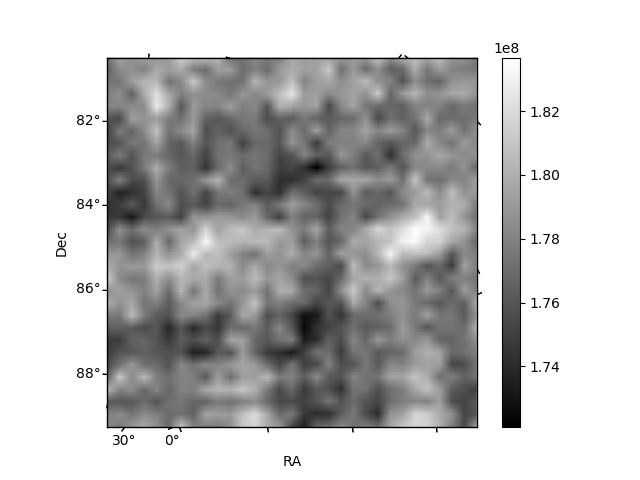
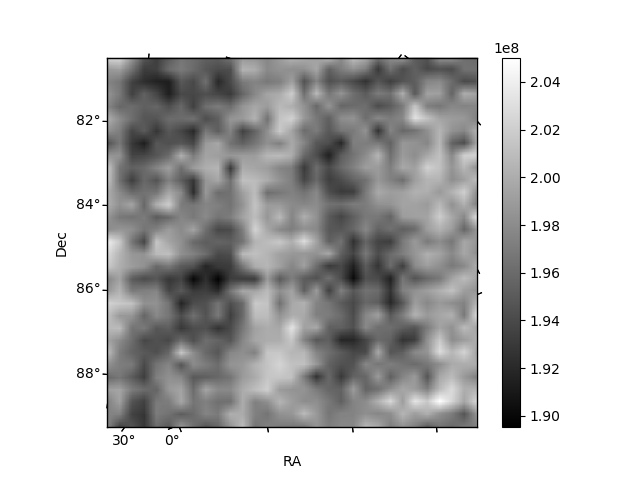
Histogram calculated using DETX and DETY for each event in the final _common_clean file
| Quadrant A | 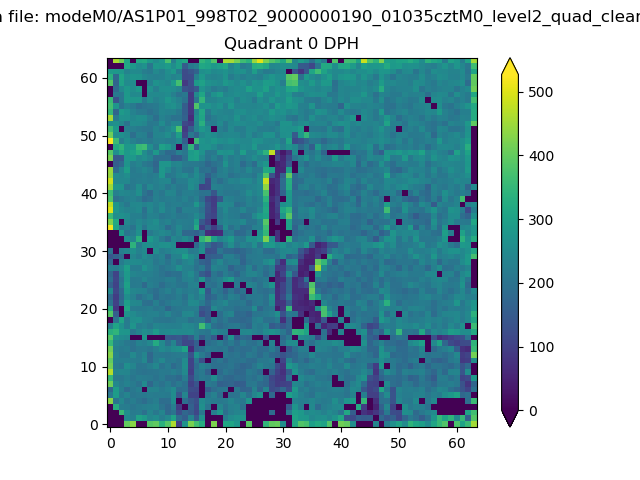 |
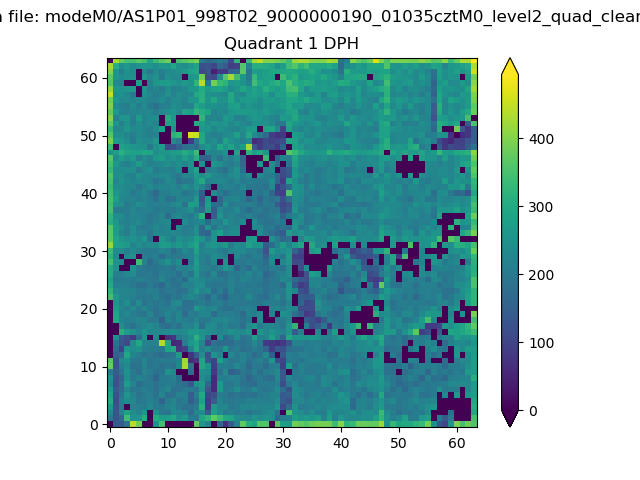 |
Quadrant B |
|---|---|---|---|
| Quadrant D | 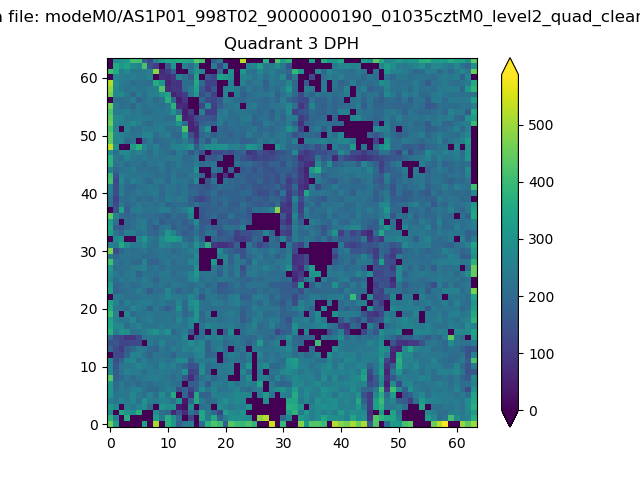 |
 |
Quadrant C |
| Plot type | Count rate plots | Images |
|---|---|---|
| Comparison with Poisson distribution Blue bars denote a histogram of data divided into 1 sec bins. Red curve is a Poisson curve with rate = median count rate of data. |
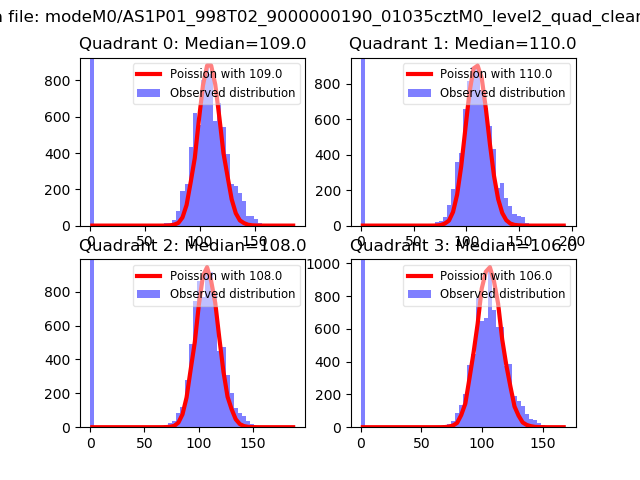 |
 |
| Quadrant-wise count rates Data is divided into 100 sec bins |
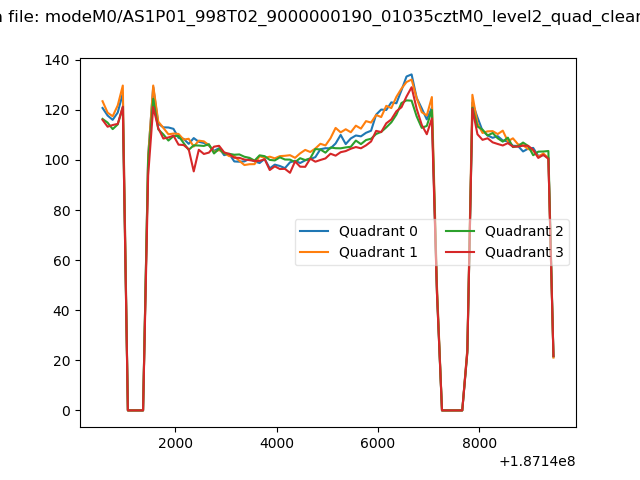 |
|
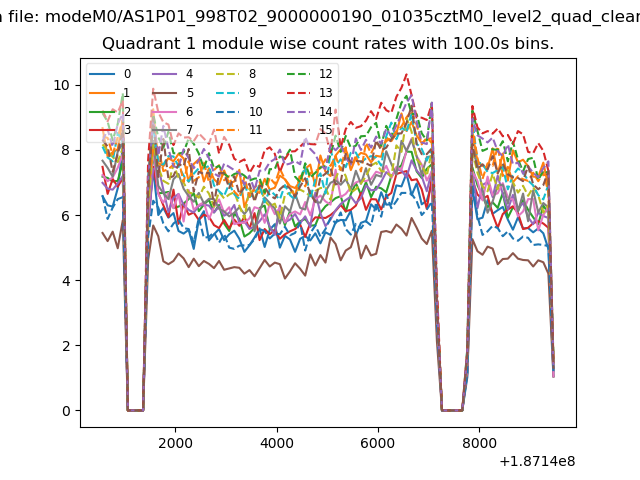
| Module-wise count rates for Quadrant A Data is divided into 100 sec bins |
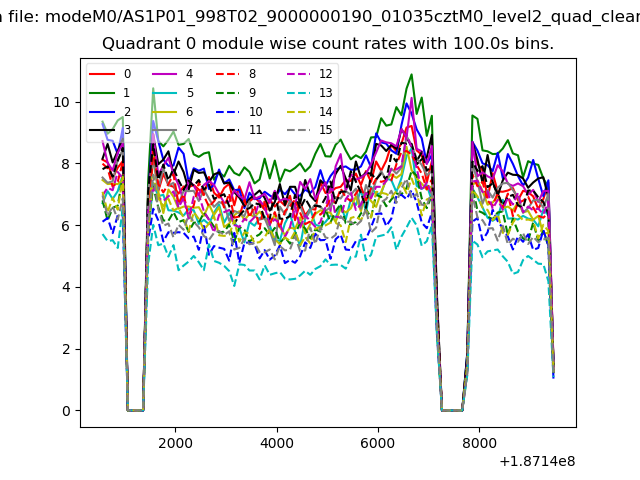 |
 |
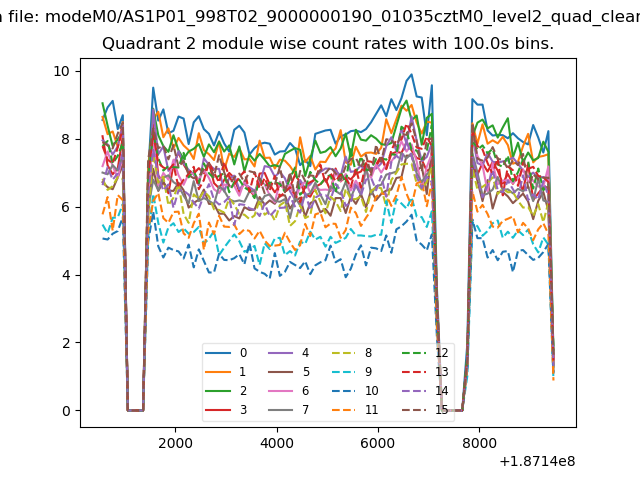
| Module-wise count rates for Quadrant B Data is divided into 100 sec bins |
 |
 |
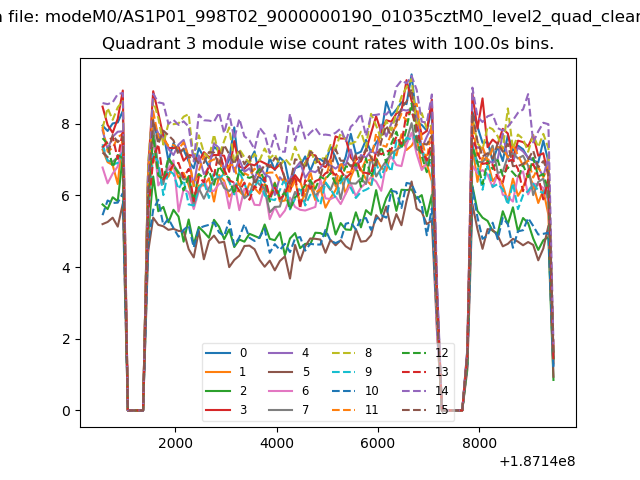
| Module-wise count rates for Quadrant C Data is divided into 100 sec bins |
 |
 |
| Module-wise count rates for Quadrant D Data is divided into 100 sec bins |
 |
 |
| Parameter | Plot |
|---|---|
| CZT HV Monitor | 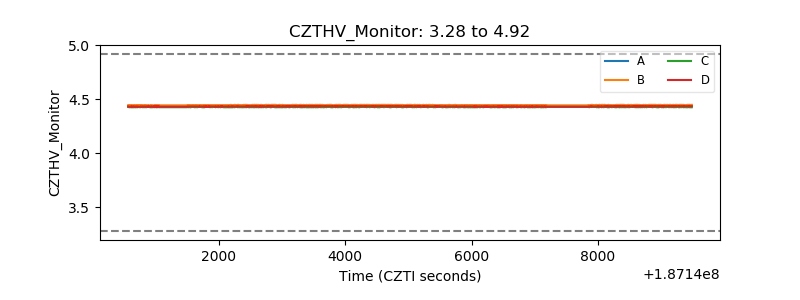 |
| D_VDD | 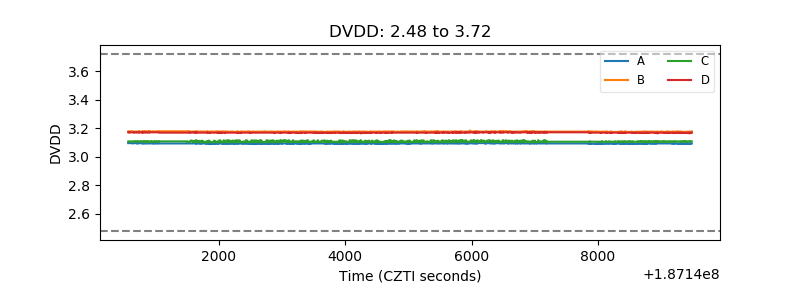 |
| Temperature 1 | 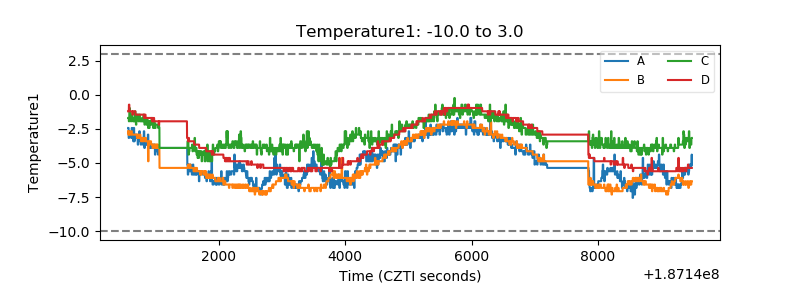 |
| Veto HV Monitor | 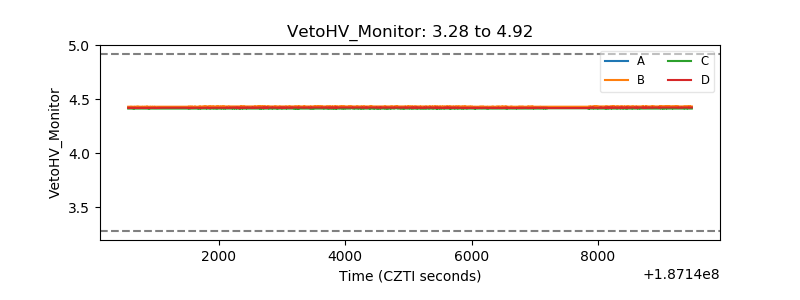 |
| Veto LLD | 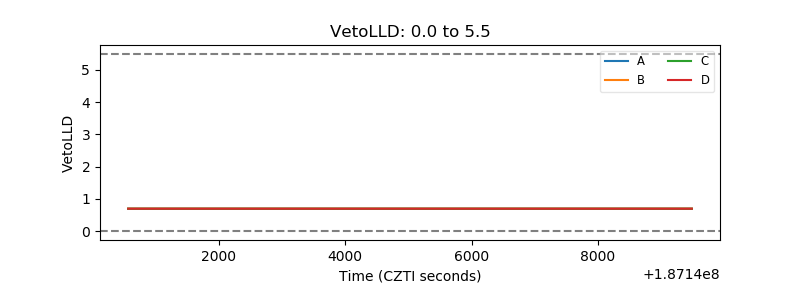 |
| Alpha Counter | 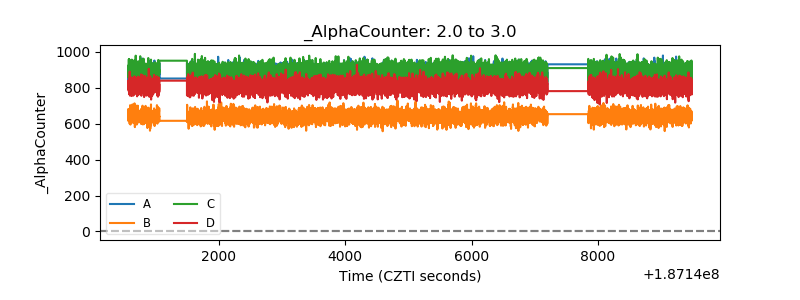 |
| _CPM_Rate | 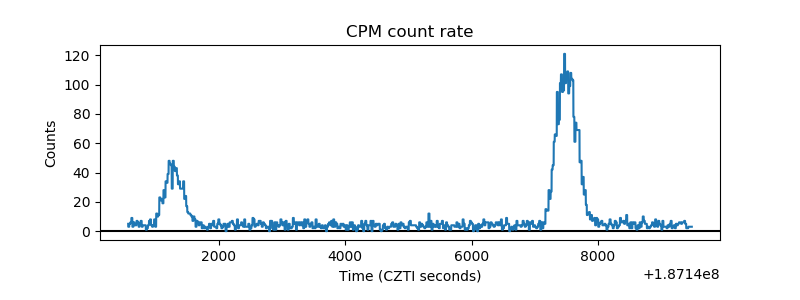 |
| CZT Counter | 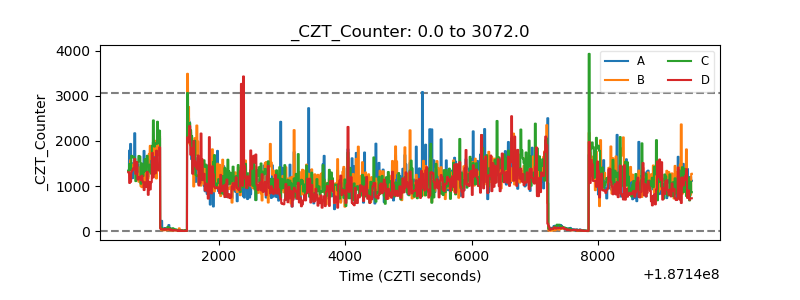 |
| +2.5 Volts monitor |  |
| +5 Volts monitor |  |
| _ROLL_ROT | 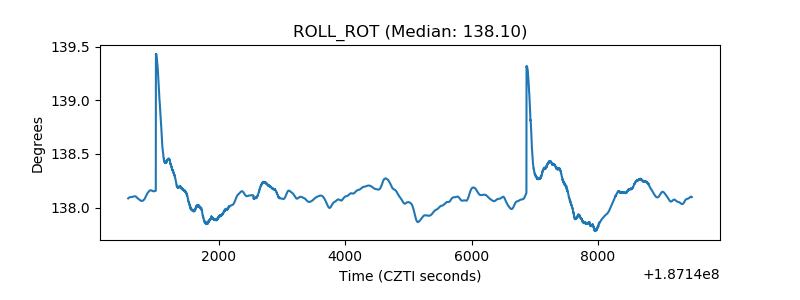 |
| _Roll_DEC | 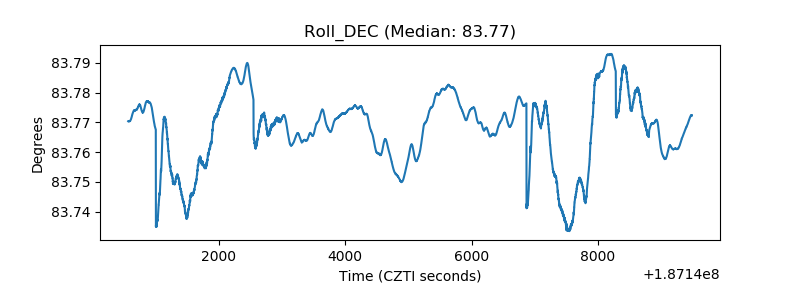 |
| _Roll_RA | 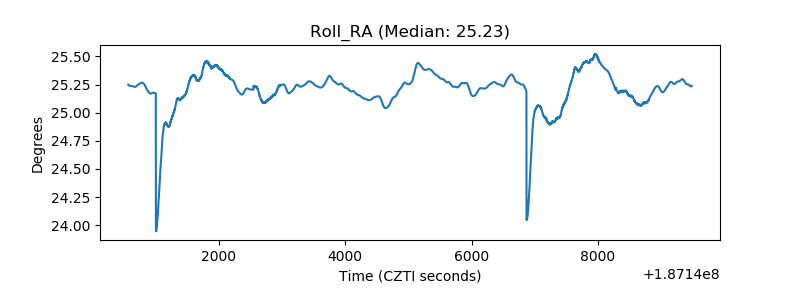 |
| Veto Counter | 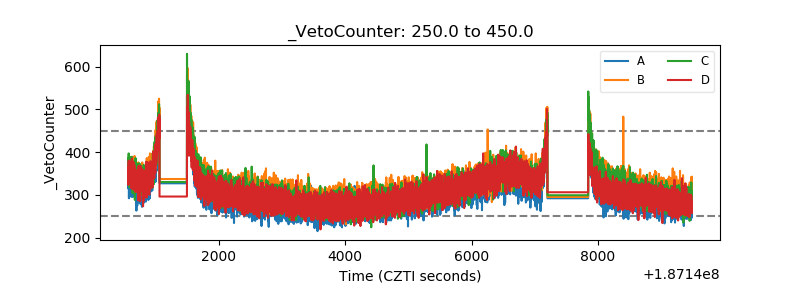 |