| Param | Original file | Final file |
|---|---|---|
| Filename | modeM0/AS1P01_998T02_9000000190_01037cztM0_level2.evt | modeM0/AS1P01_998T02_9000000190_01037cztM0_level2_quad_clean.evt |
| Size (bytes) | 996,422,400 | 108,820,800 |
| Size | 950.3 MB | 103.8 MB |
| Events in quadrant A | 7,415,970 | 719,138 |
| Events in quadrant B | 7,959,405 | 728,167 |
| Events in quadrant C | 7,540,554 | 703,728 |
| Events in quadrant D | 6,831,435 | 693,892 |
| Mode M0 | |||
|---|---|---|---|
| Quadrant | BADHDUFLAG | Total packets | Discarded packets |
| A | 0 | 26615 | 1 |
| B | 0 | 28269 | 4 |
| C | 0 | 27001 | 1 |
| D | 0 | 24974 | 1 |
| Mode SS | |||
|---|---|---|---|
| Quadrant | BADHDUFLAG | Total packets | Discarded packets |
| A | 0 | 132 | 0 |
| B | 0 | 132 | 0 |
| C | 0 | 132 | 0 |
| D | 0 | 132 | 0 |
| Mode M9 | |||
|---|---|---|---|
| Quadrant | BADHDUFLAG | Total packets | Discarded packets |
| A | 0 | 9 | 0 |
| B | 0 | 9 | 0 |
| C | 0 | 9 | 0 |
| D | 0 | 9 | 0 |
| Quadrant | Total seconds | Saturated seconds | Saturation percentage |
|---|---|---|---|
| A | 6462 | 20 | 0.309502% |
| B | 6461 | 46 | 0.711964% |
| C | 6461 | 17 | 0.263117% |
| D | 6461 | 13 | 0.201207% |
Noise dominated data is calculated using 1-second bins in cleaned event files. If a bin has >2000 counts, and if more than 50% of those come from <1% of pixels, then it is considered to be noise-dominated and hence unusable.
| Quadrant | # 1 sec bins | Bins with >0 counts | Bins with >2000 counts | High rate bins dominated by noise | Noise dominated (total time) | Noise dominated (detector-on time) | Marked lightcurve |
|---|---|---|---|---|---|---|---|
| A | 7387 | 6463 | 132 | 132 | 1.79% | 2.04% | 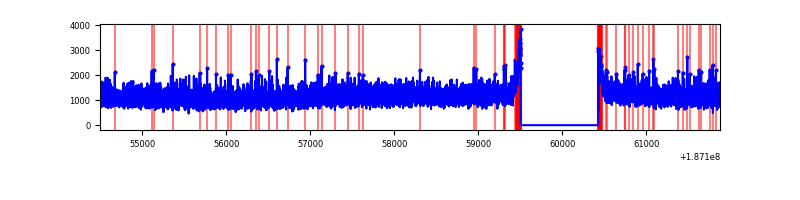 |
| B | 7386 | 6462 | 226 | 226 | 3.06% | 3.50% | 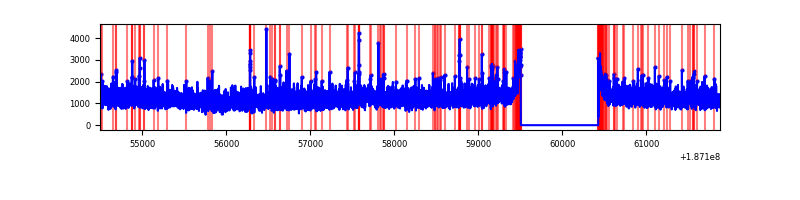 |
| C | 7386 | 6462 | 148 | 148 | 2.00% | 2.29% | 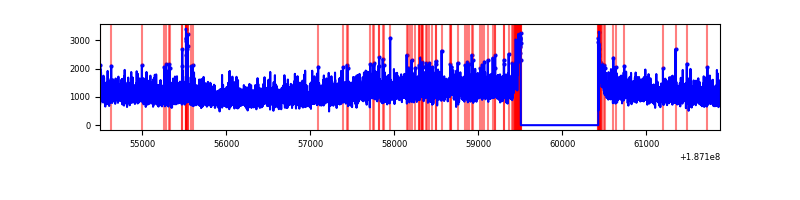 |
| D | 7386 | 6462 | 130 | 130 | 1.76% | 2.01% | 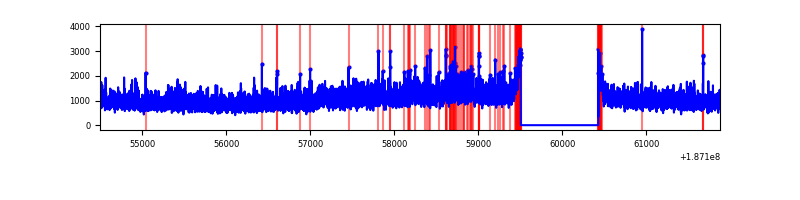 |
Top three noisy pixels from each quadrant. If the there are fewer than three noisy pixels in the level2.evt file, extra rows are filled as -1
| Pixel properties | Quadrant properties | ||||||
|---|---|---|---|---|---|---|---|
| Quadrant | DetID | PixID | Counts | Sigma | Mean | Median | Sigma |
| A | 11 | 79 | 9193 | 15.61 | 1931 | 1942 | 464.4 |
| A | 3 | 111 | 6352 | 9.49 | 1931 | 1942 | 464.4 |
| A | 14 | 203 | 5034 | 6.66 | 1931 | 1942 | 464.4 |
| B | 15 | 22 | 68450 | 140.78 | 2019 | 2031 | 471.8 |
| B | 7 | 221 | 57255 | 117.05 | 2019 | 2031 | 471.8 |
| B | 12 | 52 | 38105 | 76.46 | 2019 | 2031 | 471.8 |
| C | 15 | 241 | 318135 | 631.41 | 1803 | 1866 | 500.9 |
| C | 8 | 208 | 119264 | 234.38 | 1803 | 1866 | 500.9 |
| C | 3 | 111 | 27616 | 51.41 | 1803 | 1866 | 500.9 |
| D | 13 | 73 | 202300 | 369.19 | 1753 | 1815 | 543.0 |
| D | 10 | 125 | 33848 | 58.99 | 1753 | 1815 | 543.0 |
| D | 13 | 88 | 17814 | 29.46 | 1753 | 1815 | 543.0 |
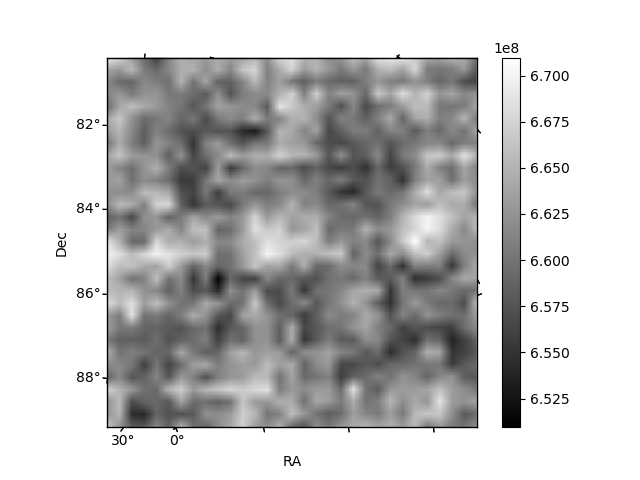
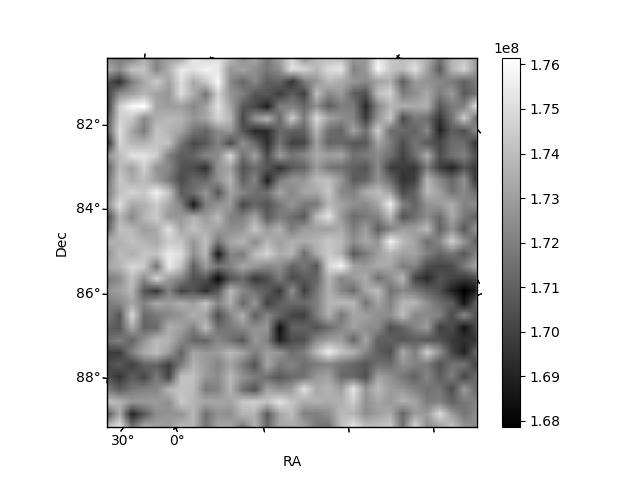
Histogram calculated using DETX and DETY for each event in the final _common_clean file
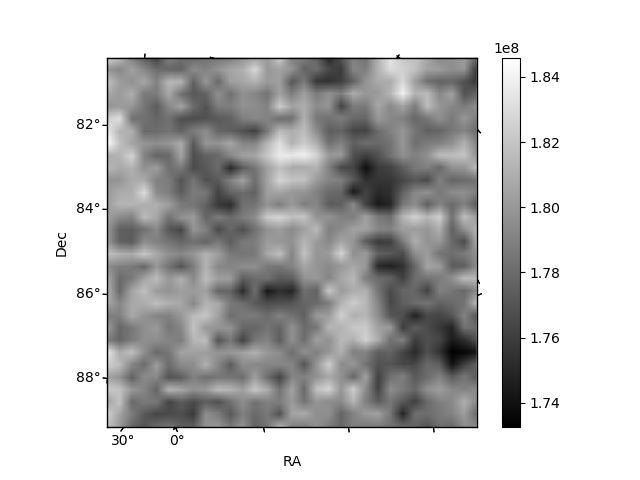
| Quadrant A | 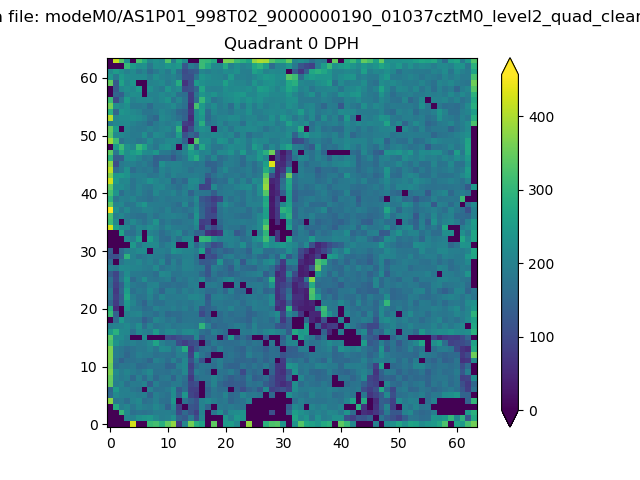 |
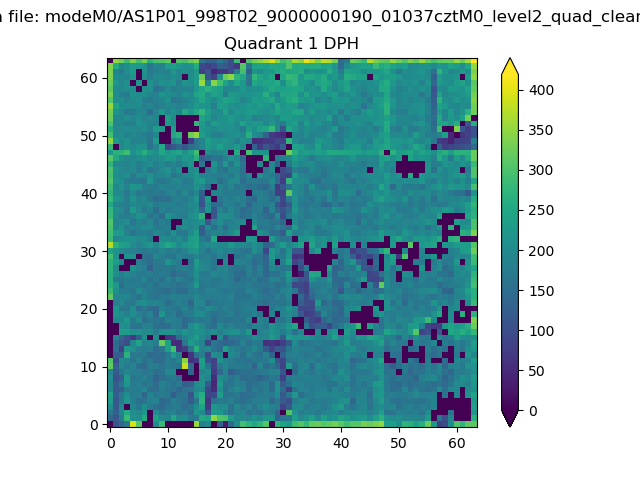 |
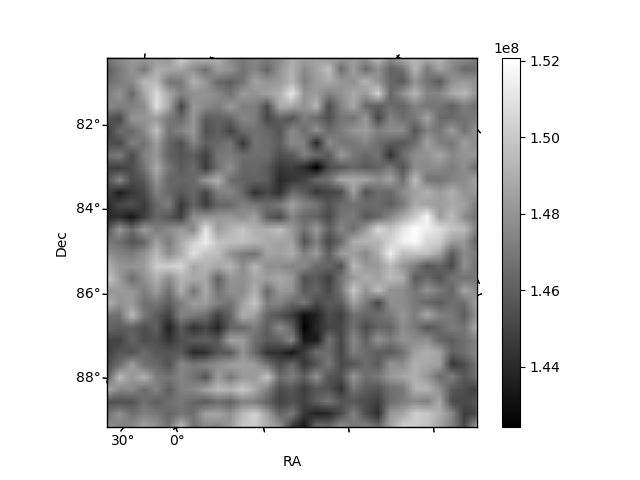
Quadrant B |
|---|---|---|---|
| Quadrant D |  |
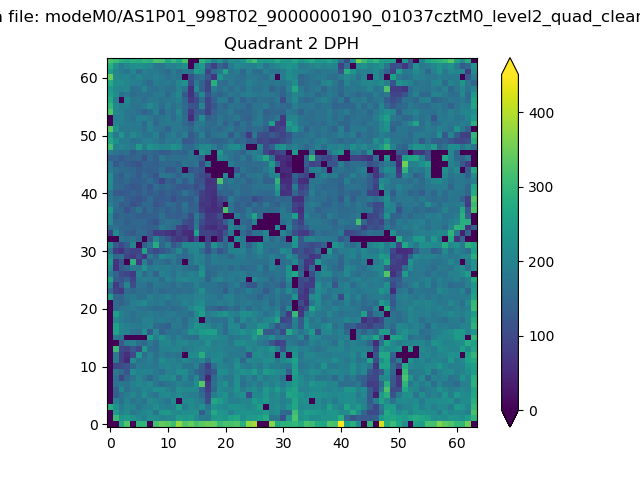 |
Quadrant C |
| Plot type | Count rate plots | Images |
|---|---|---|
| Comparison with Poisson distribution Blue bars denote a histogram of data divided into 1 sec bins. Red curve is a Poisson curve with rate = median count rate of data. |
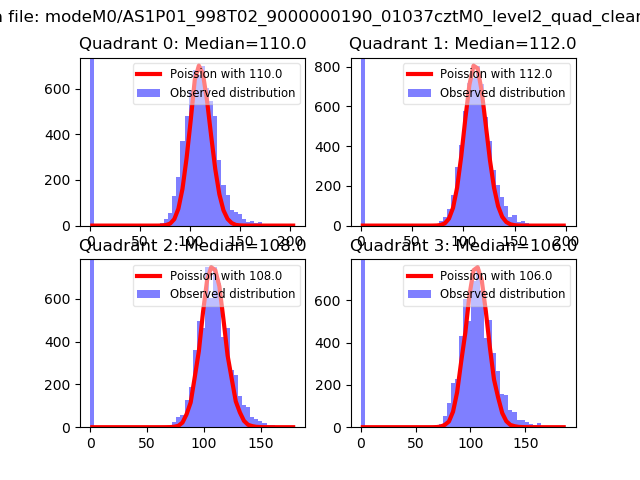 |
 |
| Quadrant-wise count rates Data is divided into 100 sec bins |
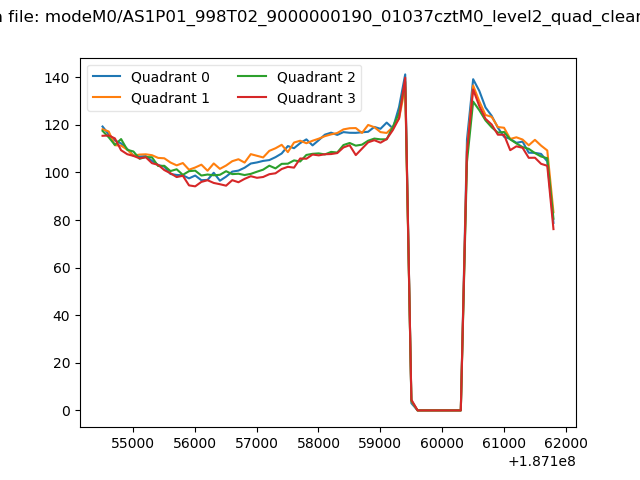 |
|
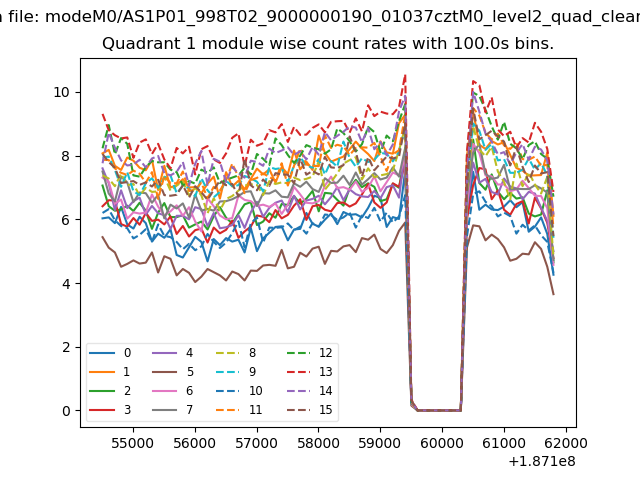
| Module-wise count rates for Quadrant A Data is divided into 100 sec bins |
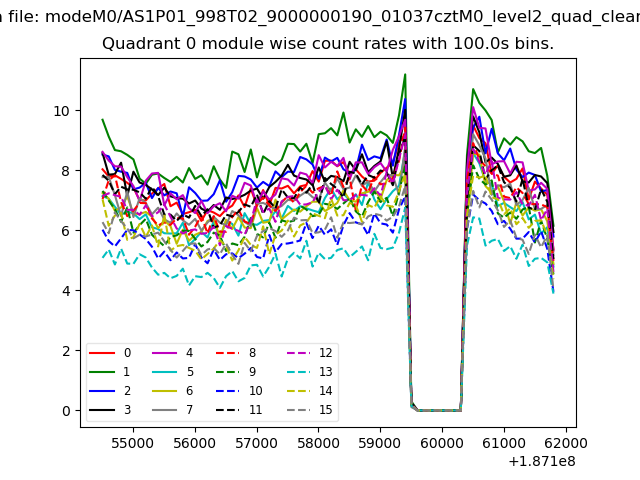 |
 |
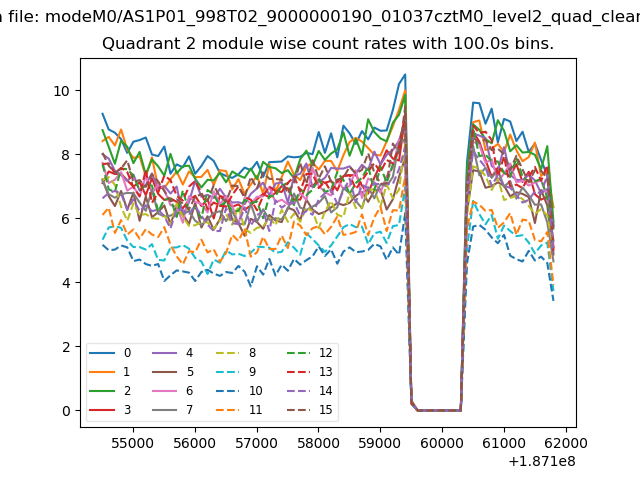
| Module-wise count rates for Quadrant B Data is divided into 100 sec bins |
 |
 |
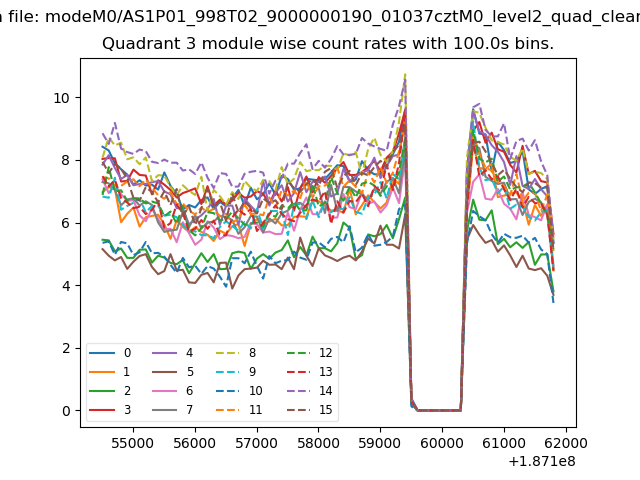
| Module-wise count rates for Quadrant C Data is divided into 100 sec bins |
 |
 |
| Module-wise count rates for Quadrant D Data is divided into 100 sec bins |
 |
 |
| Parameter | Plot |
|---|---|
| CZT HV Monitor |  |
| D_VDD | 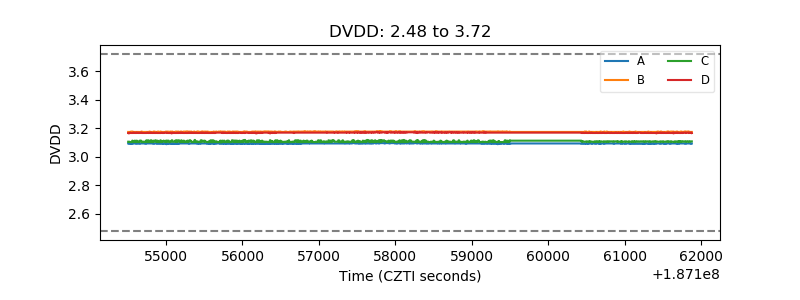 |
| Temperature 1 | 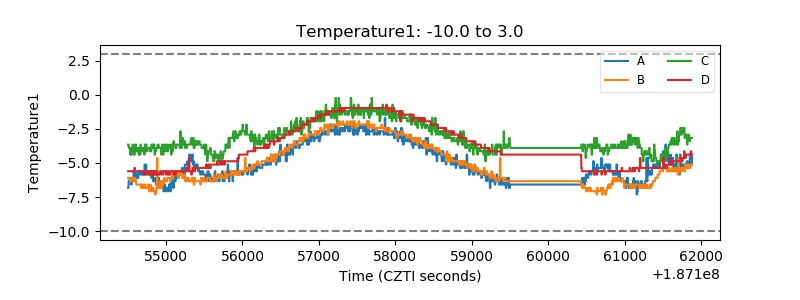 |
| Veto HV Monitor | 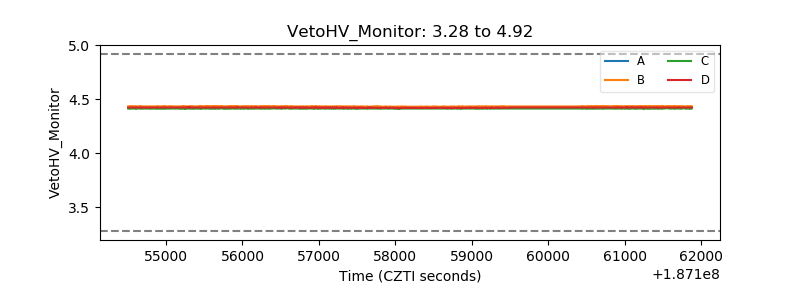 |
| Veto LLD |  |
| Alpha Counter | 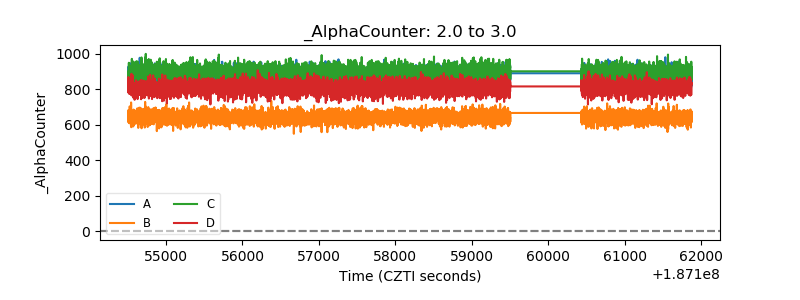 |
| _CPM_Rate | 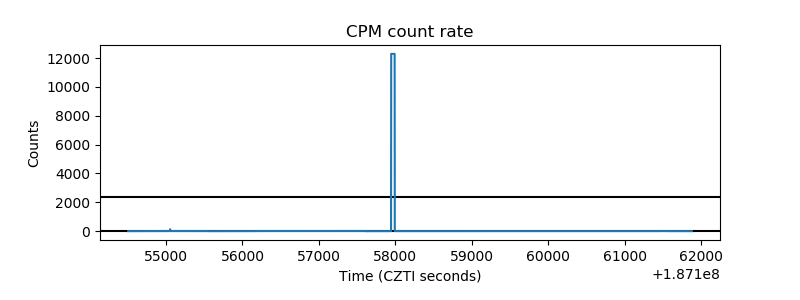 |
| CZT Counter | 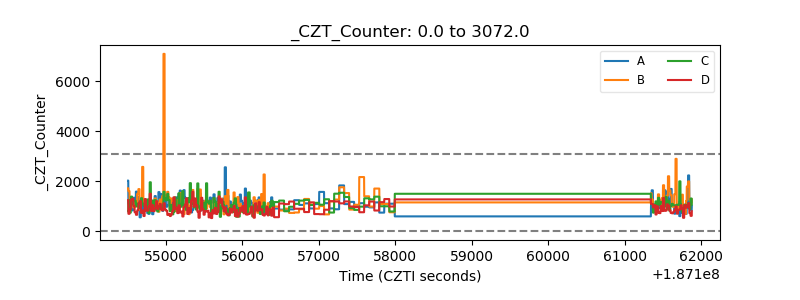 |
| +2.5 Volts monitor |  |
| +5 Volts monitor |  |
| _ROLL_ROT | 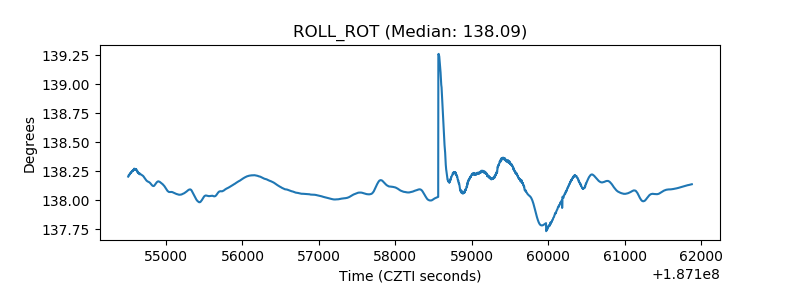 |
| _Roll_DEC | 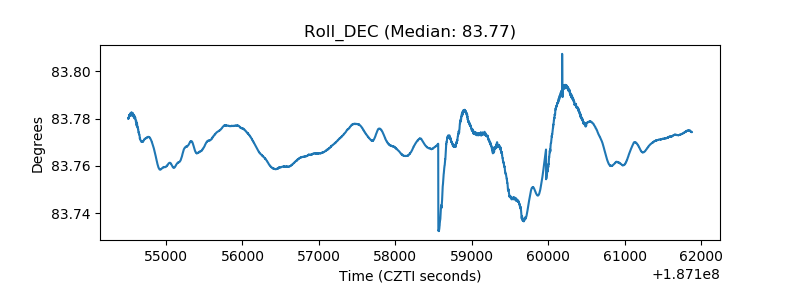 |
| _Roll_RA | 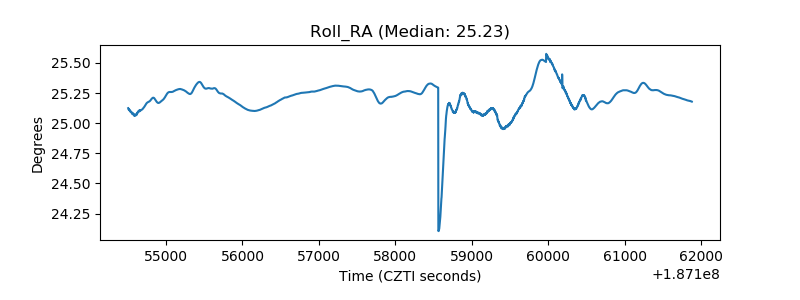 |
| Veto Counter | 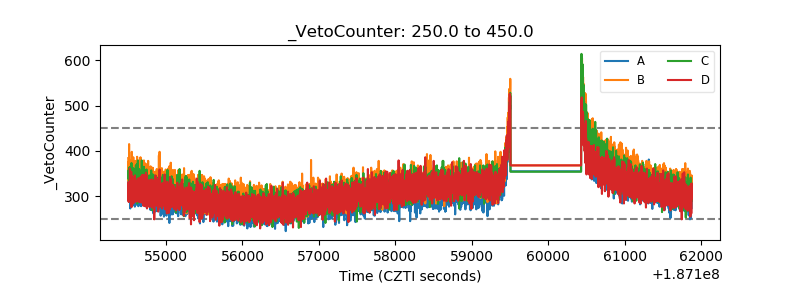 |