| Param | Original file | Final file |
|---|---|---|
| Filename | modeM0/AS1P01_998T02_9000000190_01039cztM0_level2.evt | modeM0/AS1P01_998T02_9000000190_01039cztM0_level2_quad_clean.evt |
| Size (bytes) | 984,015,360 | 109,658,880 |
| Size | 938.4 MB | 104.6 MB |
| Events in quadrant A | 7,408,029 | 729,390 |
| Events in quadrant B | 7,847,105 | 738,053 |
| Events in quadrant C | 7,505,283 | 708,685 |
| Events in quadrant D | 6,615,627 | 698,920 |
| Mode M0 | |||
|---|---|---|---|
| Quadrant | BADHDUFLAG | Total packets | Discarded packets |
| A | 0 | 26537 | 1 |
| B | 0 | 27872 | 3 |
| C | 0 | 26854 | 1 |
| D | 0 | 24247 | 1 |
| Mode SS | |||
|---|---|---|---|
| Quadrant | BADHDUFLAG | Total packets | Discarded packets |
| A | 0 | 128 | 0 |
| B | 0 | 128 | 0 |
| C | 0 | 128 | 0 |
| D | 0 | 128 | 0 |
| Mode M9 | |||
|---|---|---|---|
| Quadrant | BADHDUFLAG | Total packets | Discarded packets |
| A | 0 | 10 | 0 |
| B | 0 | 10 | 0 |
| C | 0 | 10 | 0 |
| D | 0 | 10 | 0 |
| Quadrant | Total seconds | Saturated seconds | Saturation percentage |
|---|---|---|---|
| A | 6395 | 15 | 0.234558% |
| B | 6395 | 20 | 0.312744% |
| C | 6395 | 14 | 0.218921% |
| D | 6395 | 13 | 0.203284% |
Noise dominated data is calculated using 1-second bins in cleaned event files. If a bin has >2000 counts, and if more than 50% of those come from <1% of pixels, then it is considered to be noise-dominated and hence unusable.
| Quadrant | # 1 sec bins | Bins with >0 counts | Bins with >2000 counts | High rate bins dominated by noise | Noise dominated (total time) | Noise dominated (detector-on time) | Marked lightcurve |
|---|---|---|---|---|---|---|---|
| A | 7460 | 6396 | 147 | 147 | 1.97% | 2.30% | 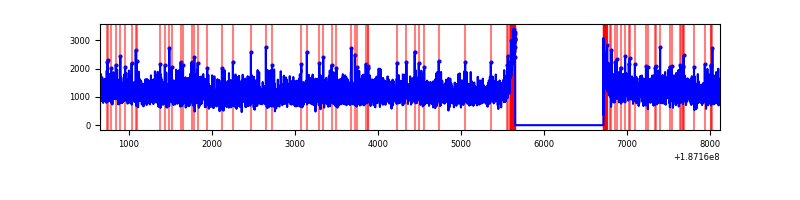 |
| B | 7460 | 6396 | 189 | 189 | 2.53% | 2.95% | 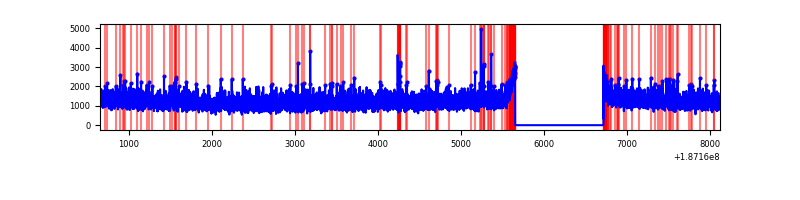 |
| C | 7460 | 6396 | 180 | 180 | 2.41% | 2.81% | 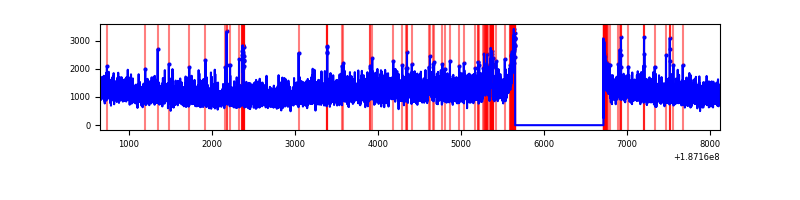 |
| D | 7460 | 6396 | 85 | 85 | 1.14% | 1.33% | 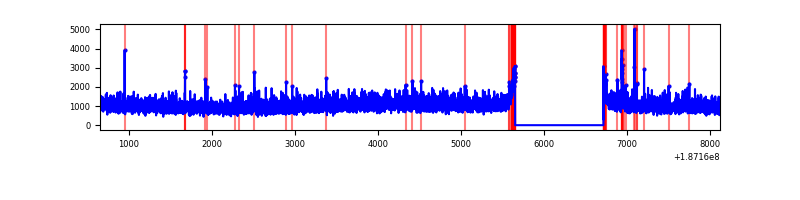 |
Top three noisy pixels from each quadrant. If the there are fewer than three noisy pixels in the level2.evt file, extra rows are filled as -1
| Pixel properties | Quadrant properties | ||||||
|---|---|---|---|---|---|---|---|
| Quadrant | DetID | PixID | Counts | Sigma | Mean | Median | Sigma |
| A | 11 | 79 | 8489 | 14.1 | 1928 | 1939 | 464.4 |
| A | 3 | 111 | 6074 | 8.9 | 1928 | 1939 | 464.4 |
| A | 12 | 243 | 5769 | 8.25 | 1928 | 1939 | 464.4 |
| B | 8 | 234 | 69848 | 143.63 | 2008 | 2015 | 472.3 |
| B | 5 | 249 | 39079 | 78.48 | 2008 | 2015 | 472.3 |
| B | 15 | 22 | 37914 | 76.02 | 2008 | 2015 | 472.3 |
| C | 15 | 241 | 390428 | 777.68 | 1791 | 1851 | 499.7 |
| C | 8 | 208 | 38738 | 73.82 | 1791 | 1851 | 499.7 |
| C | 5 | 234 | 30885 | 58.11 | 1791 | 1851 | 499.7 |
| D | 5 | 80 | 46832 | 83.77 | 1738 | 1799 | 537.6 |
| D | 13 | 169 | 22142 | 37.84 | 1738 | 1799 | 537.6 |
| D | 10 | 199 | 18772 | 31.57 | 1738 | 1799 | 537.6 |
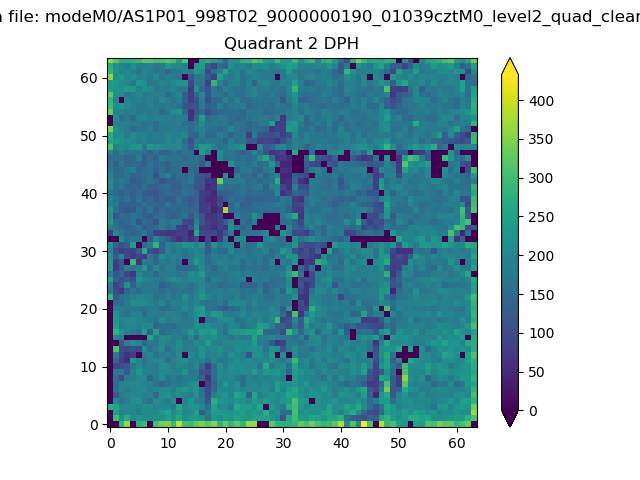
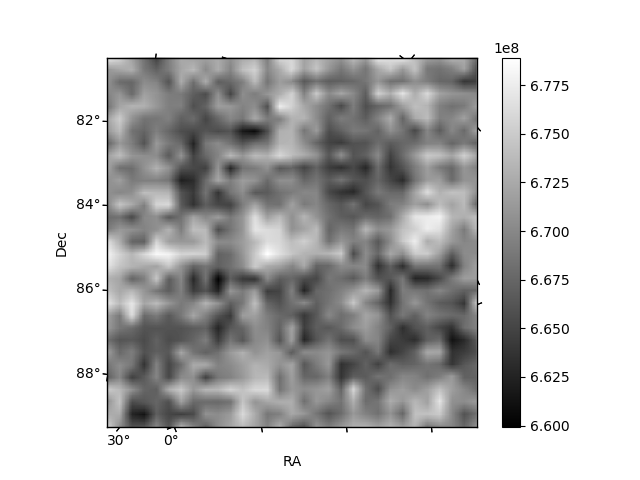
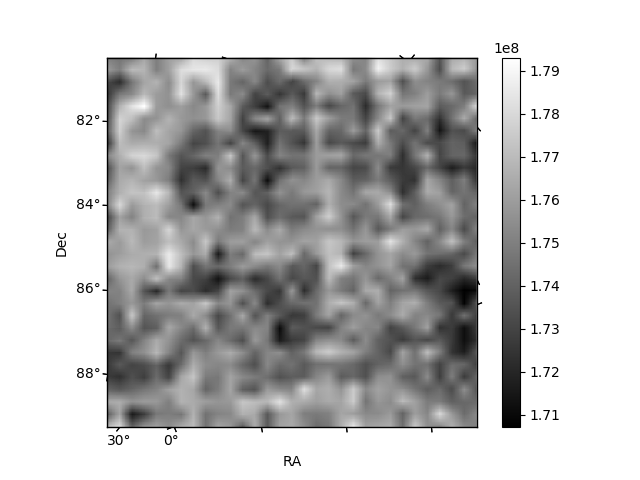
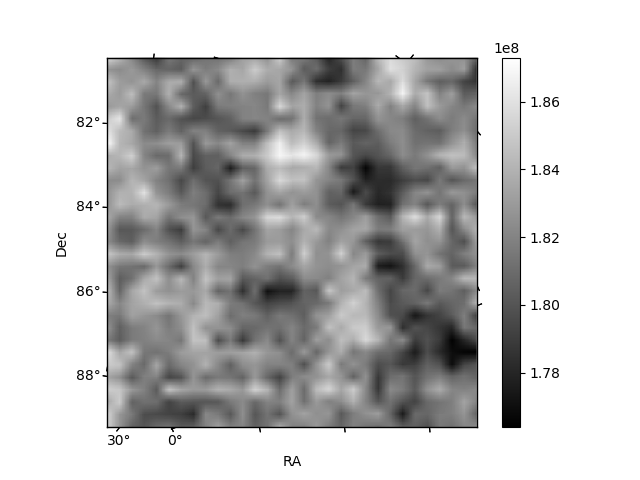
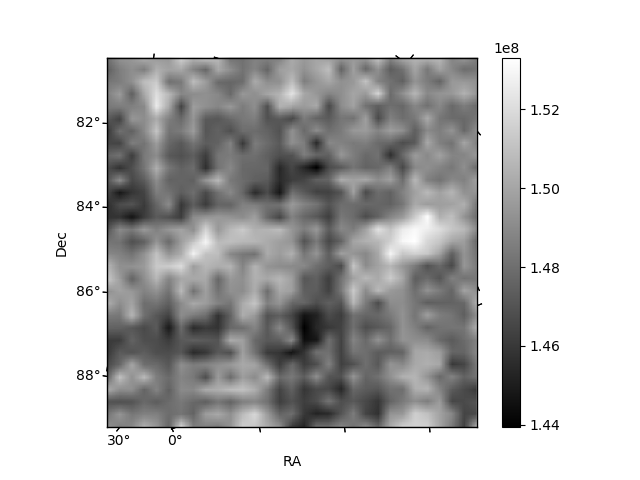
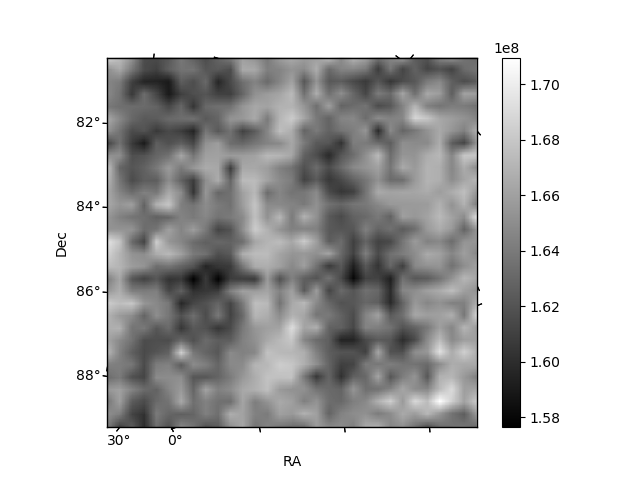
Histogram calculated using DETX and DETY for each event in the final _common_clean file
| Quadrant A | 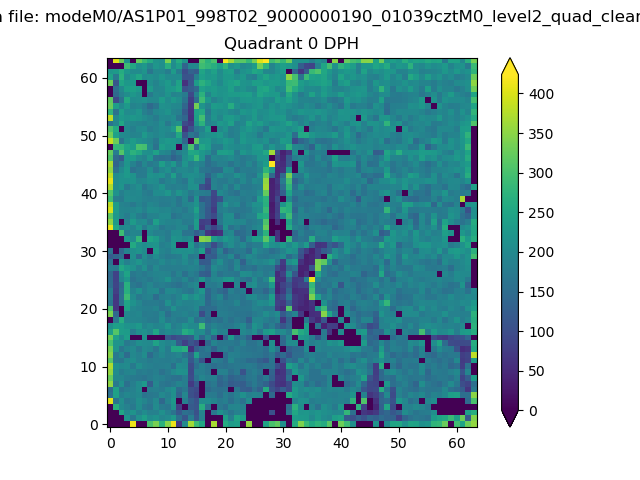 |
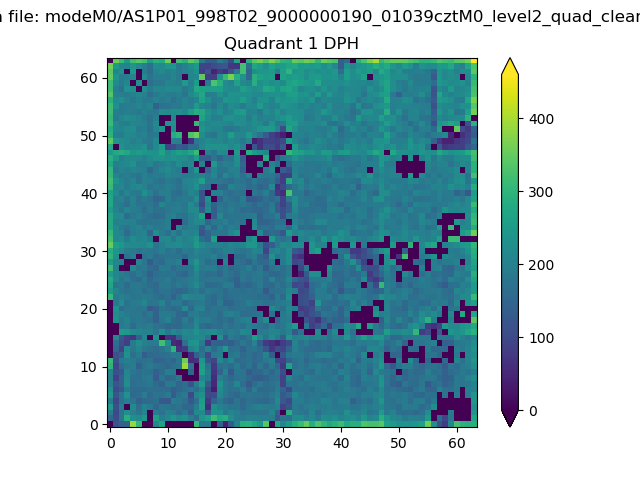 |
Quadrant B |
|---|---|---|---|
| Quadrant D | 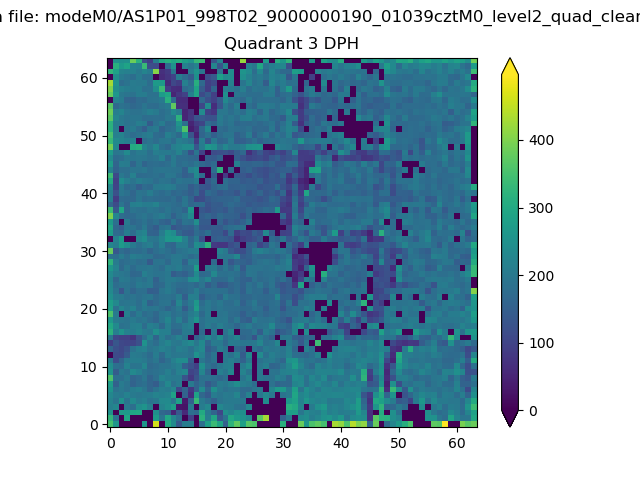 |
 |
Quadrant C |
| Plot type | Count rate plots | Images |
|---|---|---|
| Comparison with Poisson distribution Blue bars denote a histogram of data divided into 1 sec bins. Red curve is a Poisson curve with rate = median count rate of data. |
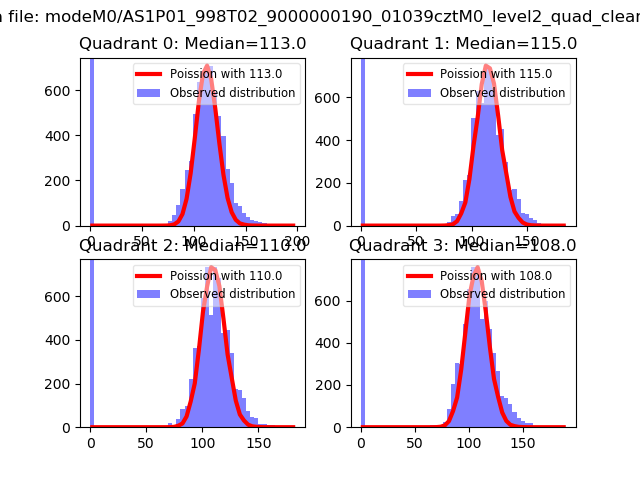 |
 |
| Quadrant-wise count rates Data is divided into 100 sec bins |
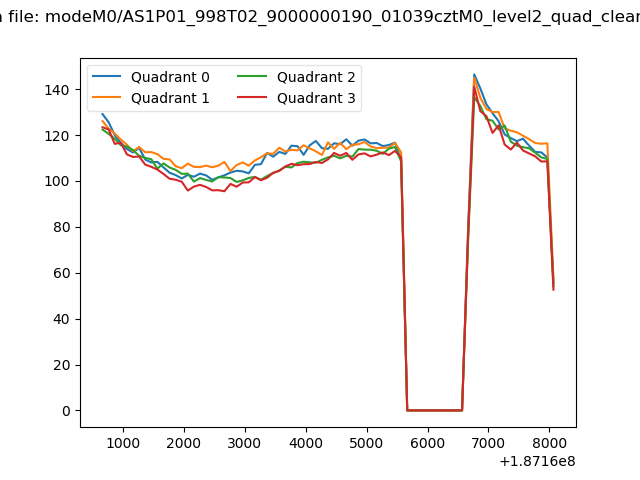 |
|
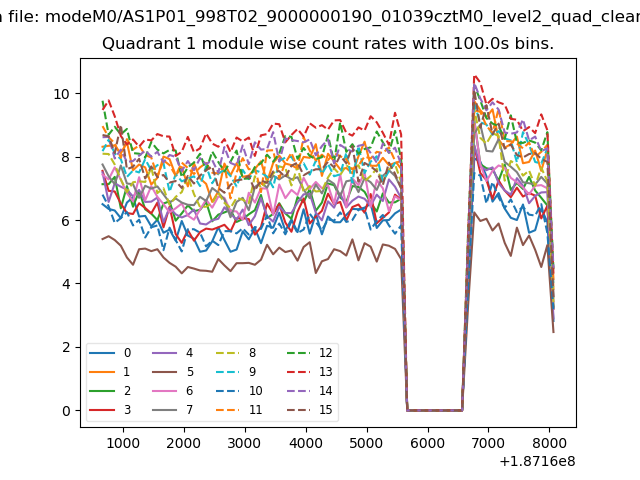
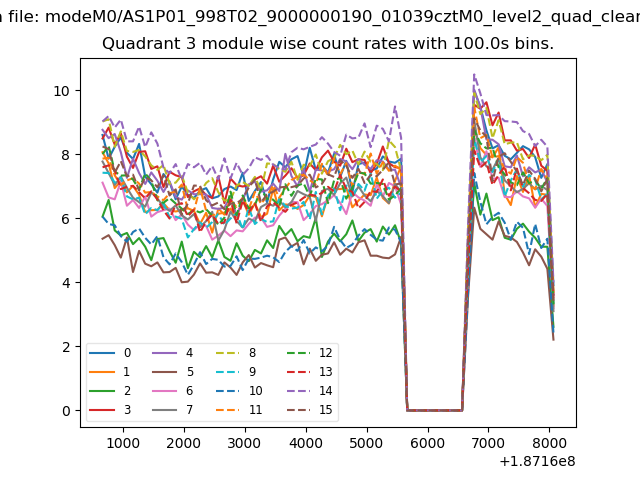
| Module-wise count rates for Quadrant A Data is divided into 100 sec bins |
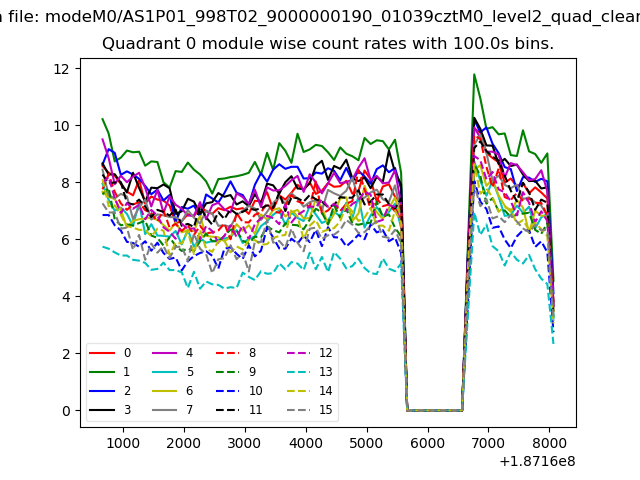 |
 |
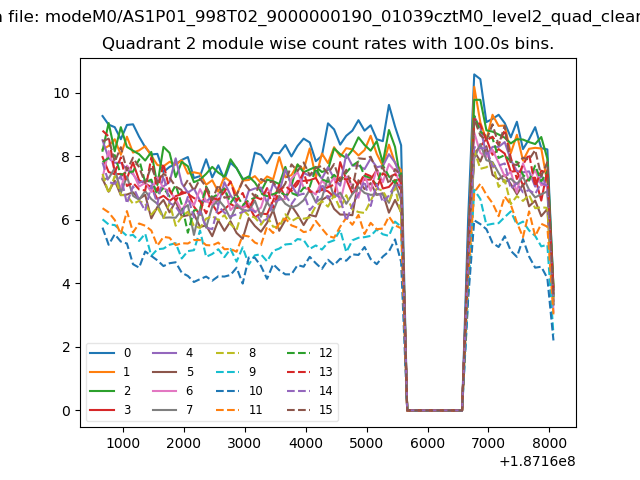
| Module-wise count rates for Quadrant B Data is divided into 100 sec bins |
 |
 |
| Module-wise count rates for Quadrant C Data is divided into 100 sec bins |
 |
 |
| Module-wise count rates for Quadrant D Data is divided into 100 sec bins |
 |
 |
| Parameter | Plot |
|---|---|
| CZT HV Monitor | 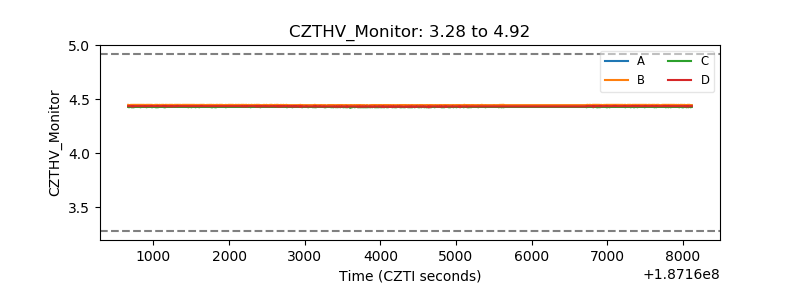 |
| D_VDD | 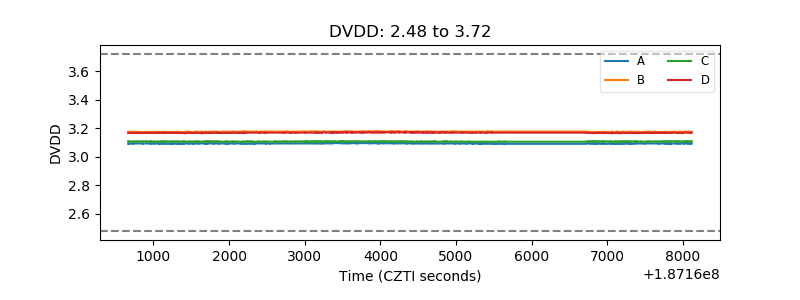 |
| Temperature 1 | 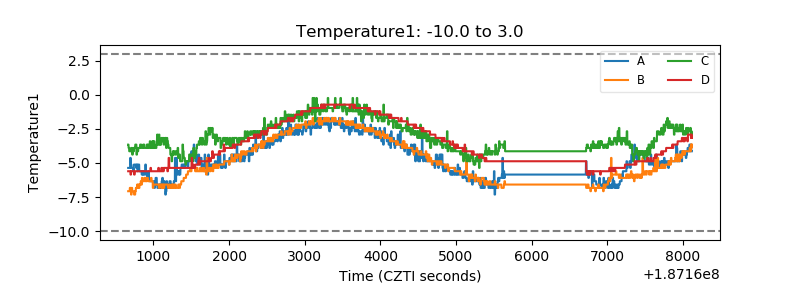 |
| Veto HV Monitor | 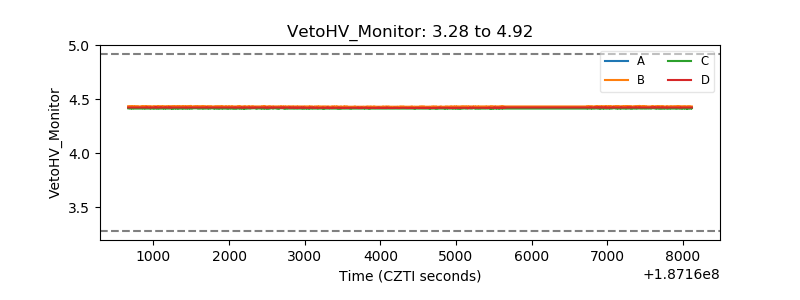 |
| Veto LLD | 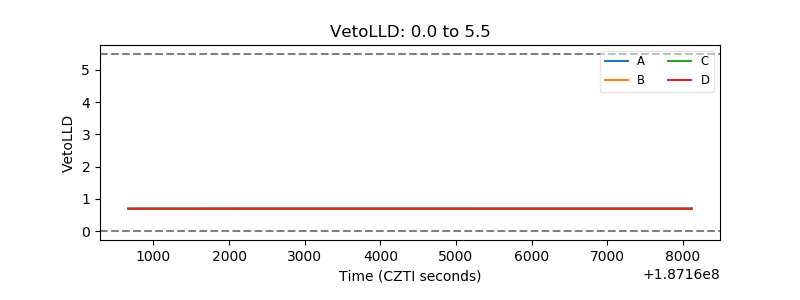 |
| Alpha Counter | 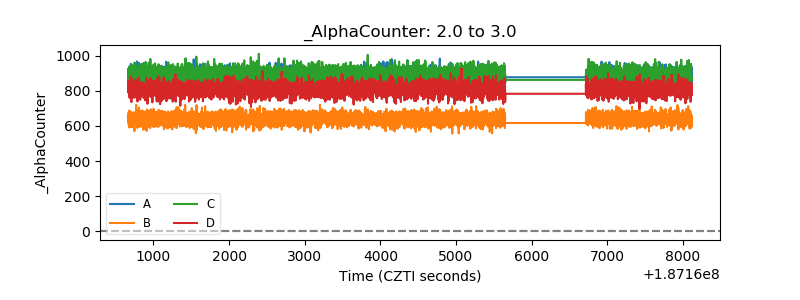 |
| _CPM_Rate | 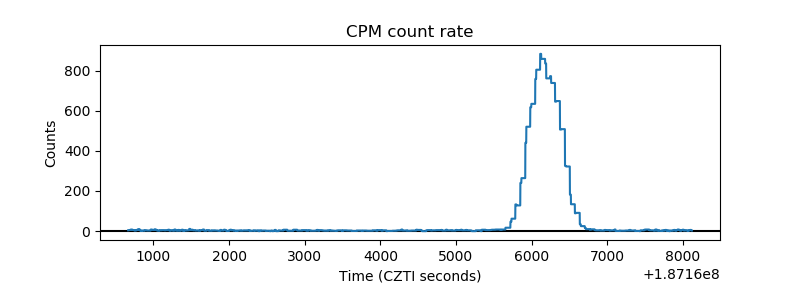 |
| CZT Counter | 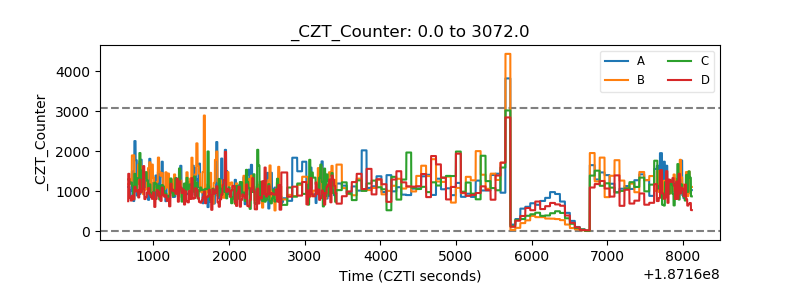 |
| +2.5 Volts monitor |  |
| +5 Volts monitor |  |
| _ROLL_ROT | 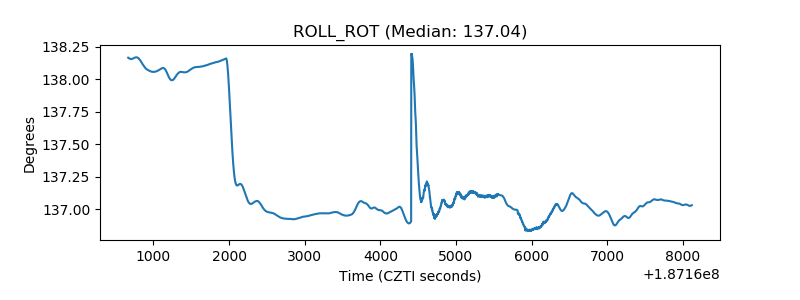 |
| _Roll_DEC | 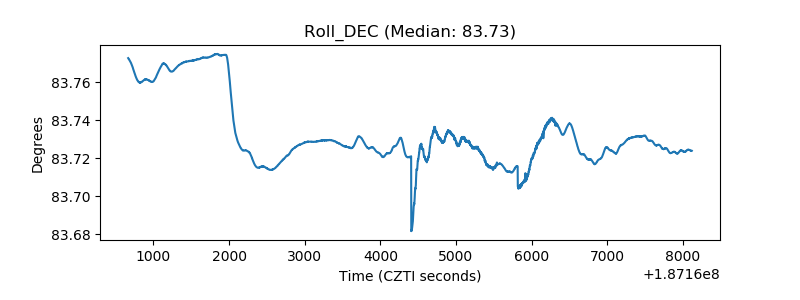 |
| _Roll_RA | 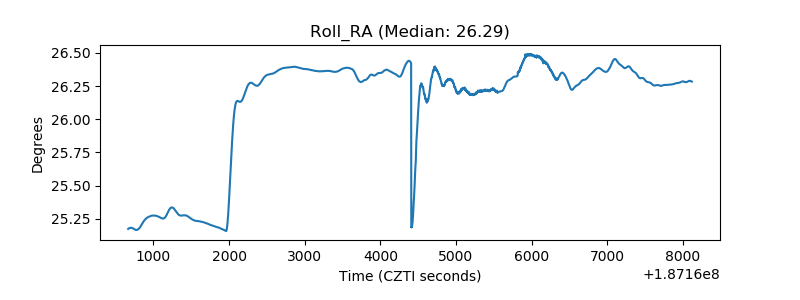 |
| Veto Counter | 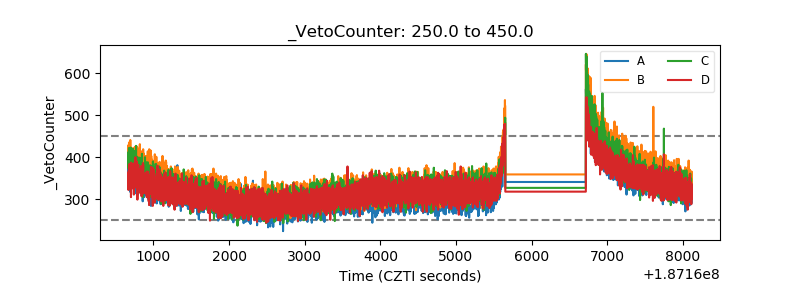 |