| Param | Original file | Final file |
|---|---|---|
| Filename | modeM0/AS1P01_998T02_9000000190_01040cztM0_level2.evt | modeM0/AS1P01_998T02_9000000190_01040cztM0_level2_quad_clean.evt |
| Size (bytes) | 919,198,080 | 104,832,000 |
| Size | 876.6 MB | 100.0 MB |
| Events in quadrant A | 6,969,878 | 703,625 |
| Events in quadrant B | 7,303,608 | 707,221 |
| Events in quadrant C | 6,931,939 | 676,479 |
| Events in quadrant D | 6,240,585 | 675,547 |
| Mode M0 | |||
|---|---|---|---|
| Quadrant | BADHDUFLAG | Total packets | Discarded packets |
| A | 0 | 24894 | 1 |
| B | 0 | 25906 | 4 |
| C | 0 | 24812 | 1 |
| D | 0 | 22794 | 1 |
| Mode SS | |||
|---|---|---|---|
| Quadrant | BADHDUFLAG | Total packets | Discarded packets |
| A | 0 | 118 | 0 |
| B | 0 | 118 | 0 |
| C | 0 | 118 | 0 |
| D | 0 | 118 | 0 |
| Mode M9 | |||
|---|---|---|---|
| Quadrant | BADHDUFLAG | Total packets | Discarded packets |
| A | 0 | 12 | 0 |
| B | 0 | 12 | 0 |
| C | 0 | 12 | 0 |
| D | 0 | 12 | 0 |
| Quadrant | Total seconds | Saturated seconds | Saturation percentage |
|---|---|---|---|
| A | 5905 | 38 | 0.643522% |
| B | 5904 | 54 | 0.914634% |
| C | 5904 | 64 | 1.084011% |
| D | 5905 | 23 | 0.389500% |
Noise dominated data is calculated using 1-second bins in cleaned event files. If a bin has >2000 counts, and if more than 50% of those come from <1% of pixels, then it is considered to be noise-dominated and hence unusable.
| Quadrant | # 1 sec bins | Bins with >0 counts | Bins with >2000 counts | High rate bins dominated by noise | Noise dominated (total time) | Noise dominated (detector-on time) | Marked lightcurve |
|---|---|---|---|---|---|---|---|
| A | 7045 | 5906 | 177 | 177 | 2.51% | 3.00% | 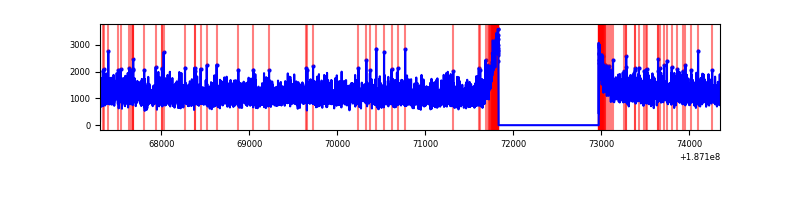 |
| B | 7044 | 5905 | 238 | 238 | 3.38% | 4.03% | 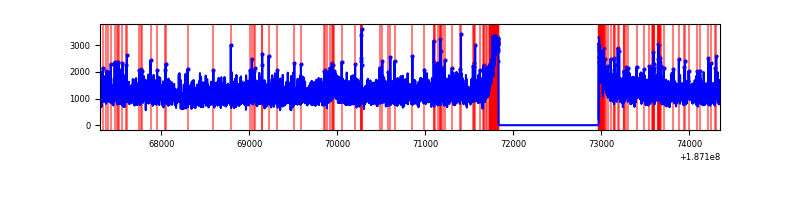 |
| C | 7044 | 5905 | 193 | 193 | 2.74% | 3.27% | 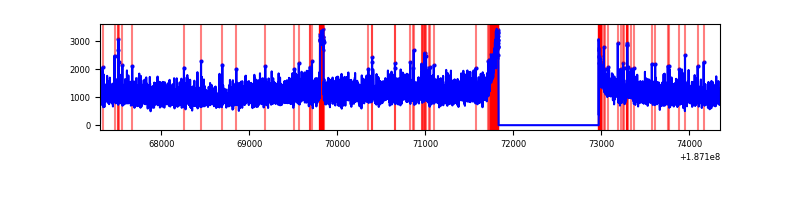 |
| D | 7045 | 5906 | 124 | 124 | 1.76% | 2.10% | 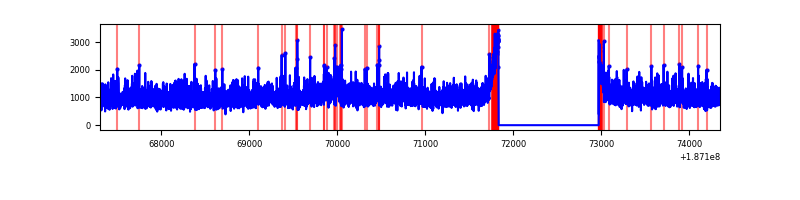 |
Top three noisy pixels from each quadrant. If the there are fewer than three noisy pixels in the level2.evt file, extra rows are filled as -1
| Pixel properties | Quadrant properties | ||||||
|---|---|---|---|---|---|---|---|
| Quadrant | DetID | PixID | Counts | Sigma | Mean | Median | Sigma |
| A | 11 | 79 | 7154 | 12.4 | 1815 | 1827 | 429.5 |
| A | 3 | 111 | 5574 | 8.72 | 1815 | 1827 | 429.5 |
| A | 13 | 9 | 4977 | 7.33 | 1815 | 1827 | 429.5 |
| B | 5 | 249 | 59759 | 131.57 | 1864 | 1874 | 439.9 |
| B | 15 | 22 | 35737 | 76.97 | 1864 | 1874 | 439.9 |
| B | 4 | 232 | 26318 | 55.56 | 1864 | 1874 | 439.9 |
| C | 15 | 241 | 290587 | 625.91 | 1669 | 1727 | 461.5 |
| C | 5 | 234 | 35869 | 73.98 | 1669 | 1727 | 461.5 |
| C | 8 | 208 | 32327 | 66.3 | 1669 | 1727 | 461.5 |
| D | 1 | 83 | 73276 | 141.63 | 1646 | 1703 | 505.4 |
| D | 9 | 64 | 7322 | 11.12 | 1646 | 1703 | 505.4 |
| D | 10 | 125 | 6479 | 9.45 | 1646 | 1703 | 505.4 |
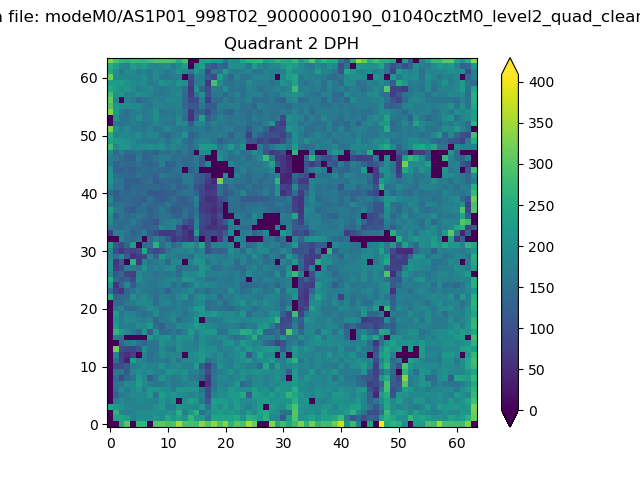
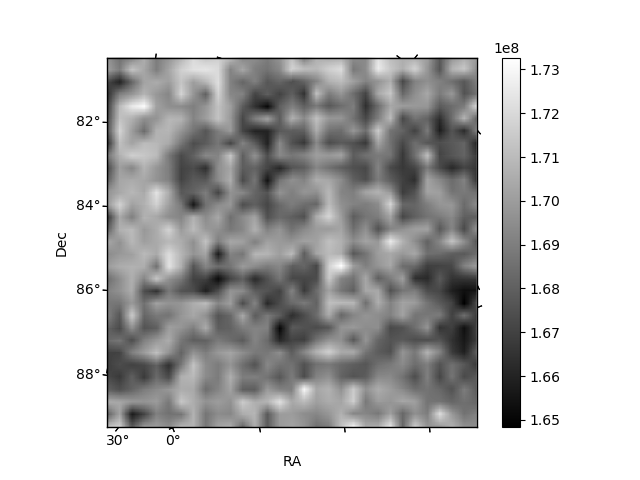
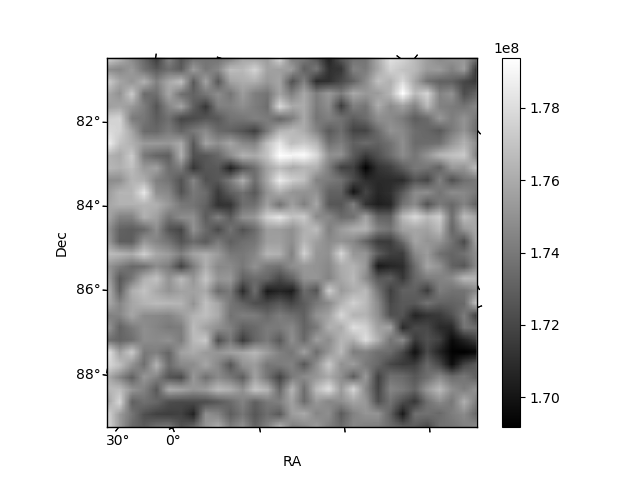
Histogram calculated using DETX and DETY for each event in the final _common_clean file
| Quadrant A | 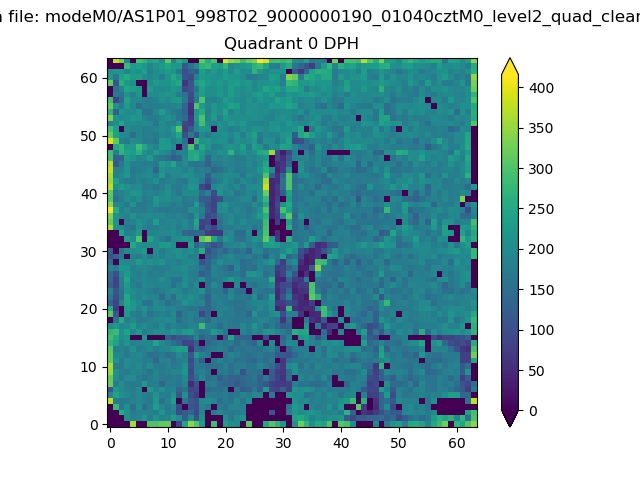 |
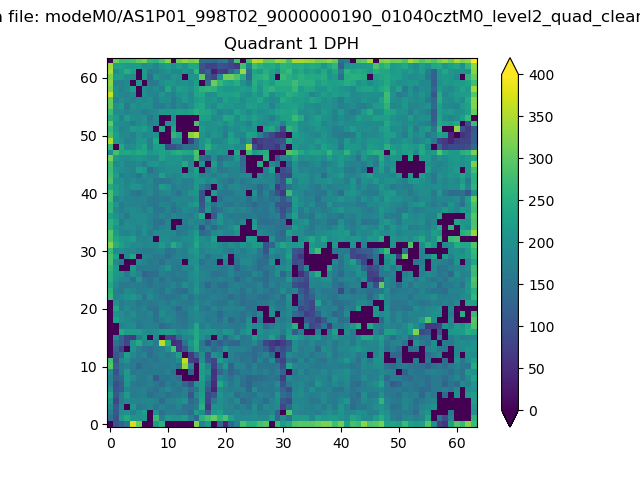 |
Quadrant B |
|---|---|---|---|
| Quadrant D | 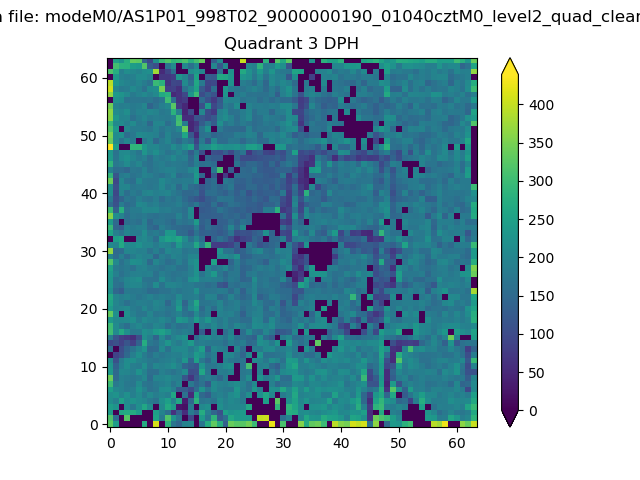 |
 |
Quadrant C |
| Plot type | Count rate plots | Images |
|---|---|---|
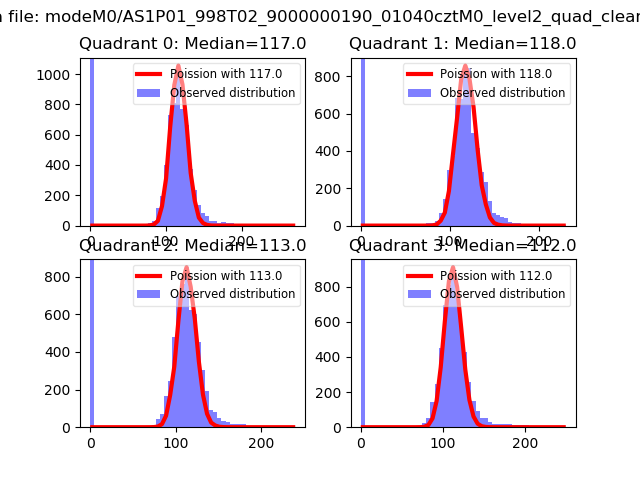
| Comparison with Poisson distribution Blue bars denote a histogram of data divided into 1 sec bins. Red curve is a Poisson curve with rate = median count rate of data. |
 |
 |
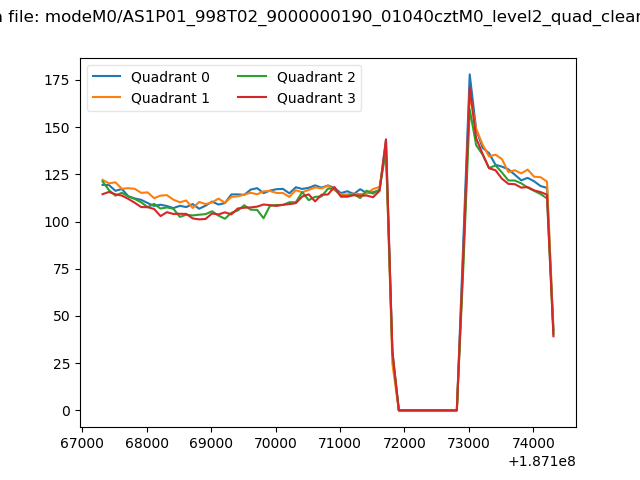
| Quadrant-wise count rates Data is divided into 100 sec bins |
 |
|
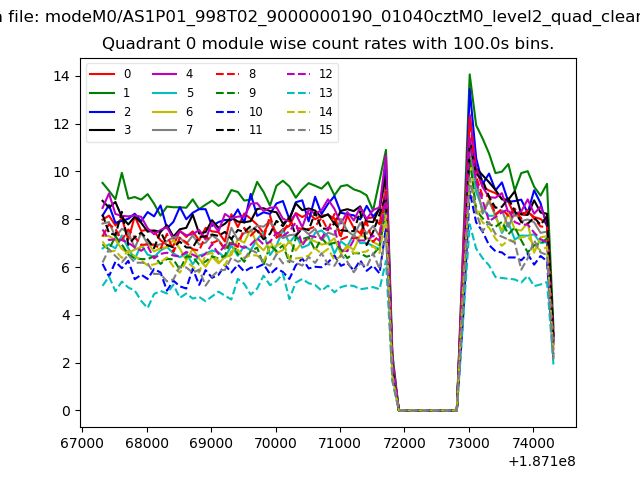
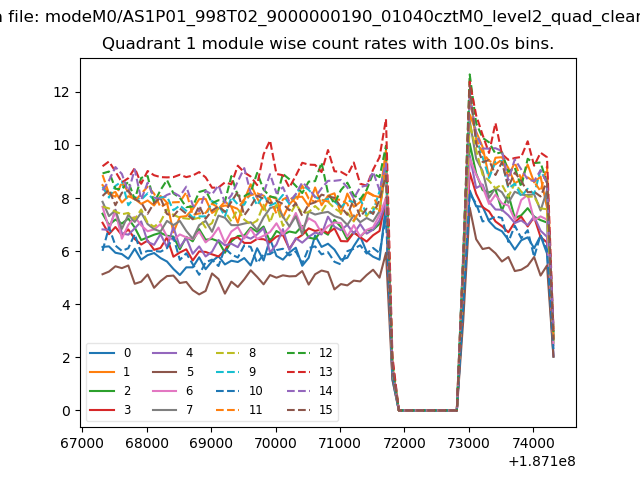
| Module-wise count rates for Quadrant A Data is divided into 100 sec bins |
 |
 |
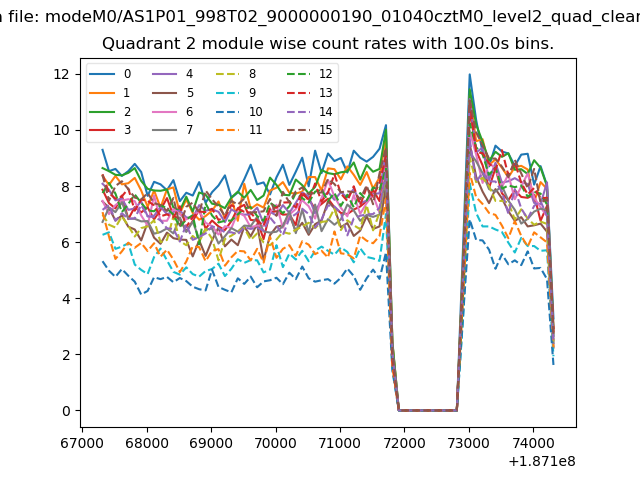
| Module-wise count rates for Quadrant B Data is divided into 100 sec bins |
 |
 |
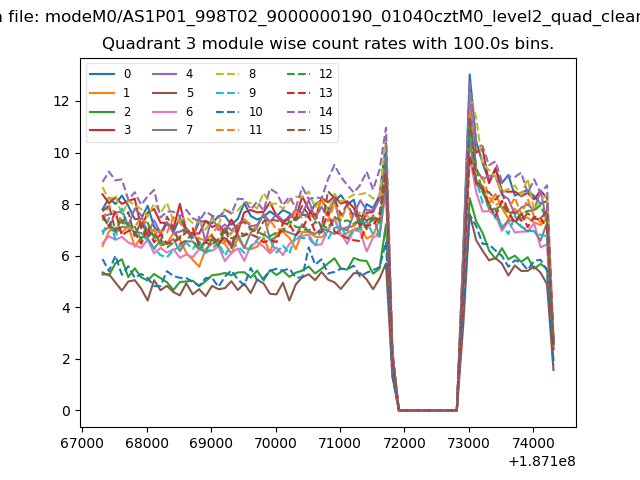
| Module-wise count rates for Quadrant C Data is divided into 100 sec bins |
 |
 |
| Module-wise count rates for Quadrant D Data is divided into 100 sec bins |
 |
 |
| Parameter | Plot |
|---|---|
| CZT HV Monitor | 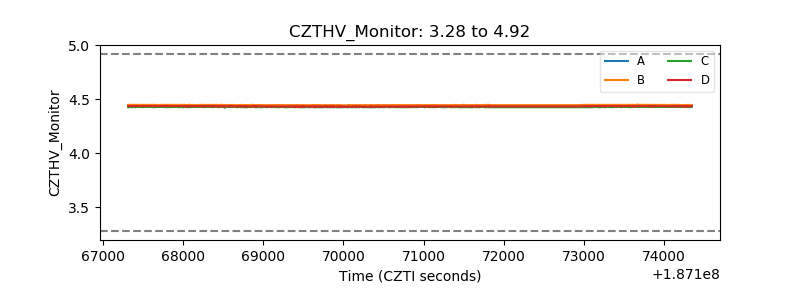 |
| D_VDD | 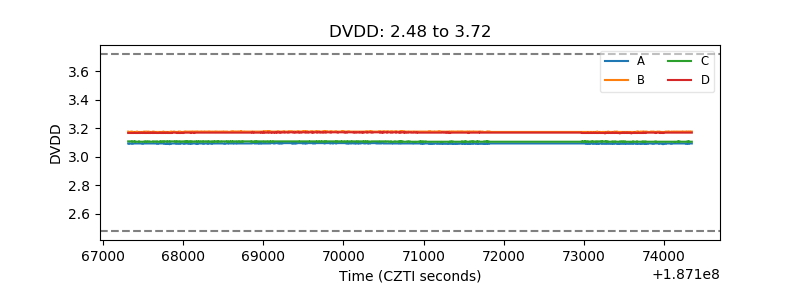 |
| Temperature 1 | 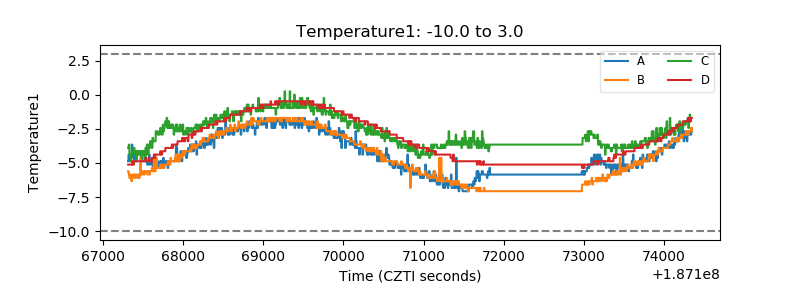 |
| Veto HV Monitor | 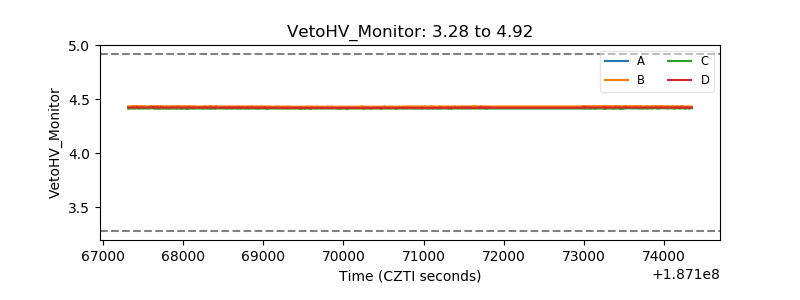 |
| Veto LLD | 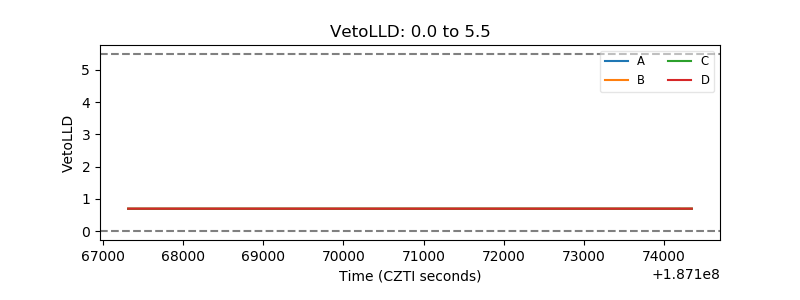 |
| Alpha Counter | 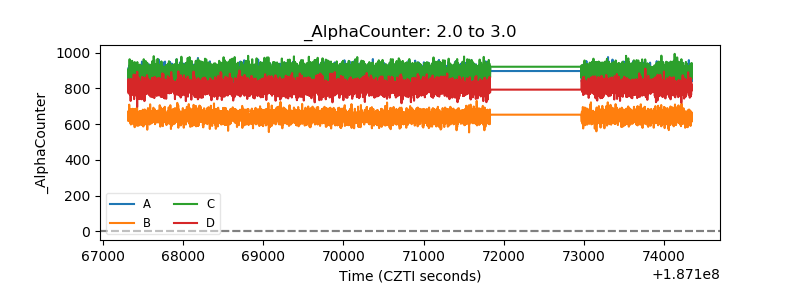 |
| _CPM_Rate | 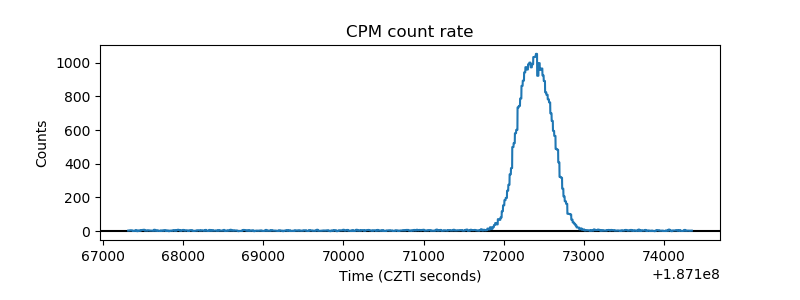 |
| CZT Counter | 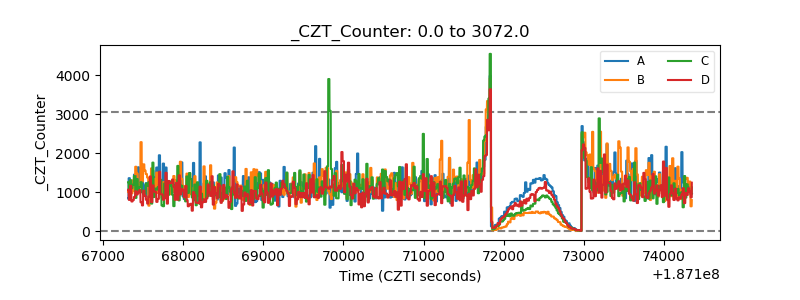 |
| +2.5 Volts monitor |  |
| +5 Volts monitor |  |
| _ROLL_ROT | 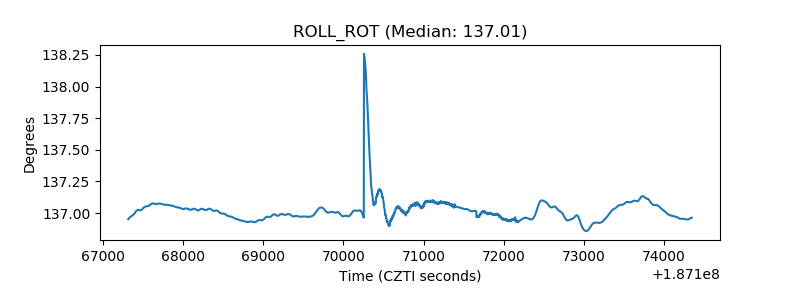 |
| _Roll_DEC | 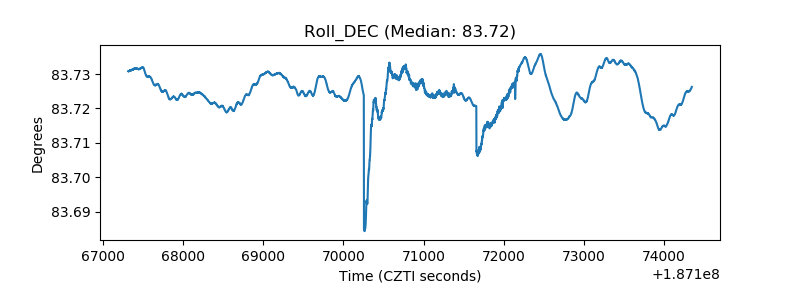 |
| _Roll_RA | 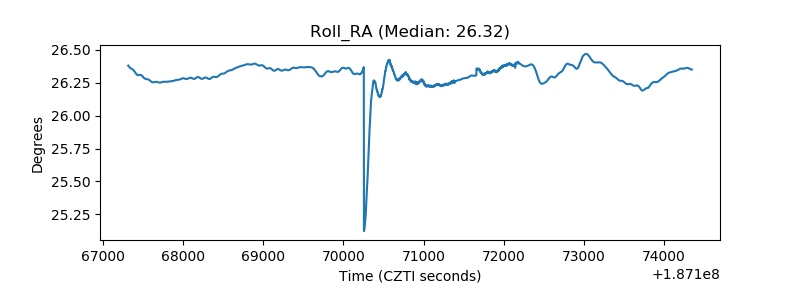 |
| Veto Counter | 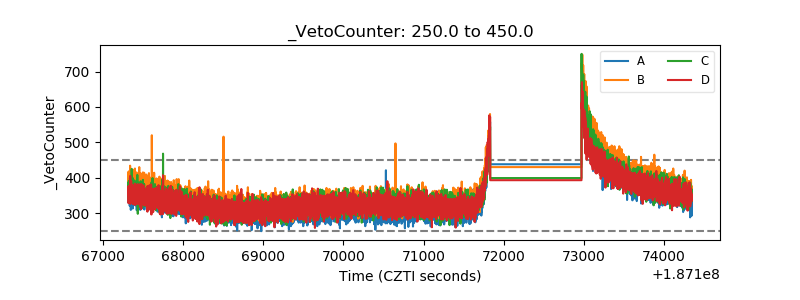 |