| Param | Original file | Final file |
|---|---|---|
| Filename | modeM0/AS1P01_998T02_9000000190_01041cztM0_level2.evt | modeM0/AS1P01_998T02_9000000190_01041cztM0_level2_quad_clean.evt |
| Size (bytes) | 963,869,760 | 108,362,880 |
| Size | 919.2 MB | 103.3 MB |
| Events in quadrant A | 7,203,735 | 731,275 |
| Events in quadrant B | 7,526,325 | 735,399 |
| Events in quadrant C | 7,496,656 | 697,369 |
| Events in quadrant D | 6,563,879 | 696,734 |
| Mode M0 | |||
|---|---|---|---|
| Quadrant | BADHDUFLAG | Total packets | Discarded packets |
| A | 0 | 25647 | 1 |
| B | 0 | 26653 | 1 |
| C | 0 | 26580 | 1 |
| D | 0 | 23779 | 3 |
| Mode SS | |||
|---|---|---|---|
| Quadrant | BADHDUFLAG | Total packets | Discarded packets |
| A | 0 | 122 | 0 |
| B | 0 | 122 | 0 |
| C | 0 | 122 | 0 |
| D | 0 | 122 | 0 |
| Mode M9 | |||
|---|---|---|---|
| Quadrant | BADHDUFLAG | Total packets | Discarded packets |
| A | 0 | 12 | 0 |
| B | 0 | 12 | 0 |
| C | 0 | 12 | 0 |
| D | 0 | 12 | 0 |
| Quadrant | Total seconds | Saturated seconds | Saturation percentage |
|---|---|---|---|
| A | 6032 | 57 | 0.944960% |
| B | 6033 | 55 | 0.911653% |
| C | 6033 | 73 | 1.210012% |
| D | 6032 | 47 | 0.779178% |
Noise dominated data is calculated using 1-second bins in cleaned event files. If a bin has >2000 counts, and if more than 50% of those come from <1% of pixels, then it is considered to be noise-dominated and hence unusable.
| Quadrant | # 1 sec bins | Bins with >0 counts | Bins with >2000 counts | High rate bins dominated by noise | Noise dominated (total time) | Noise dominated (detector-on time) | Marked lightcurve |
|---|---|---|---|---|---|---|---|
| A | 7212 | 6033 | 218 | 218 | 3.02% | 3.61% | 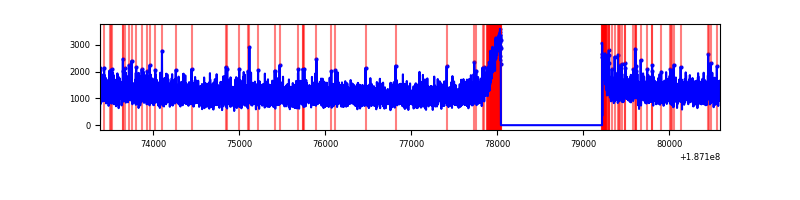 |
| B | 7213 | 6034 | 254 | 254 | 3.52% | 4.21% | 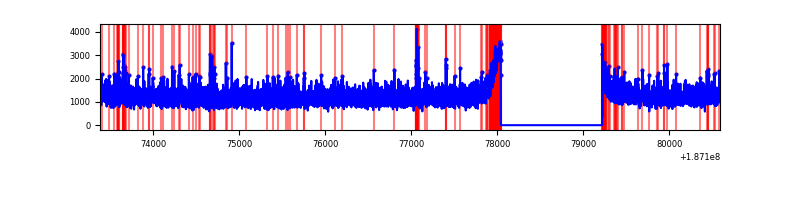 |
| C | 7213 | 6034 | 285 | 285 | 3.95% | 4.72% | 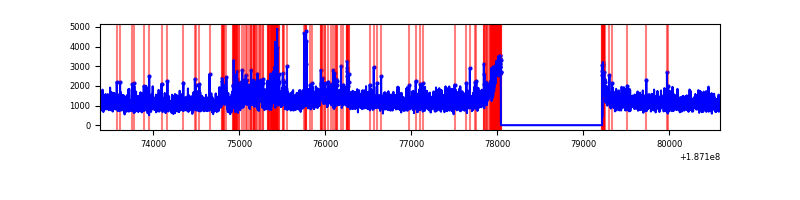 |
| D | 7212 | 6033 | 163 | 163 | 2.26% | 2.70% | 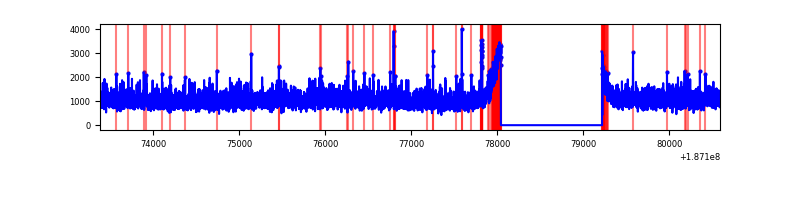 |
Top three noisy pixels from each quadrant. If the there are fewer than three noisy pixels in the level2.evt file, extra rows are filled as -1
| Pixel properties | Quadrant properties | ||||||
|---|---|---|---|---|---|---|---|
| Quadrant | DetID | PixID | Counts | Sigma | Mean | Median | Sigma |
| A | 15 | 127 | 14147 | 27.3 | 1873 | 1885 | 449.2 |
| A | 11 | 79 | 6643 | 10.59 | 1873 | 1885 | 449.2 |
| A | 3 | 111 | 5899 | 8.94 | 1873 | 1885 | 449.2 |
| B | 5 | 249 | 67660 | 145.57 | 1919 | 1921 | 451.6 |
| B | 8 | 234 | 46710 | 99.18 | 1919 | 1921 | 451.6 |
| B | 4 | 232 | 21546 | 43.46 | 1919 | 1921 | 451.6 |
| C | 12 | 4 | 266583 | 553.85 | 1734 | 1791 | 478.1 |
| C | 8 | 208 | 265835 | 552.28 | 1734 | 1791 | 478.1 |
| C | 15 | 241 | 124539 | 256.74 | 1734 | 1791 | 478.1 |
| D | 10 | 125 | 55458 | 102.74 | 1712 | 1773 | 522.5 |
| D | 2 | 16 | 45711 | 84.09 | 1712 | 1773 | 522.5 |
| D | 9 | 64 | 23954 | 42.45 | 1712 | 1773 | 522.5 |
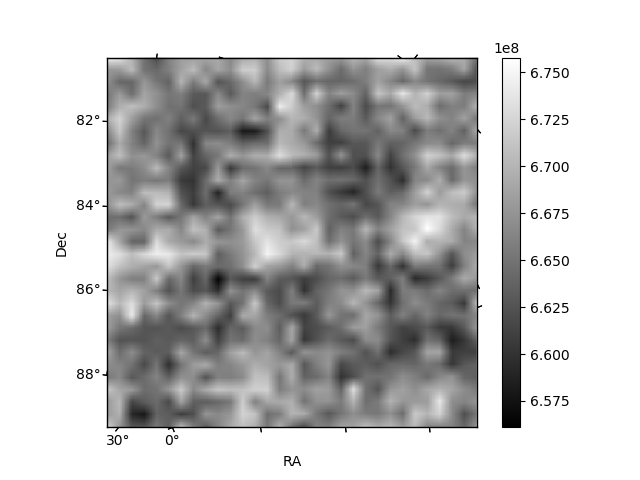
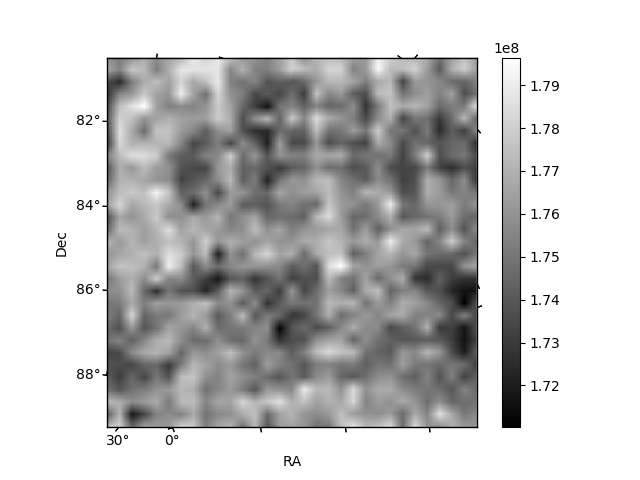
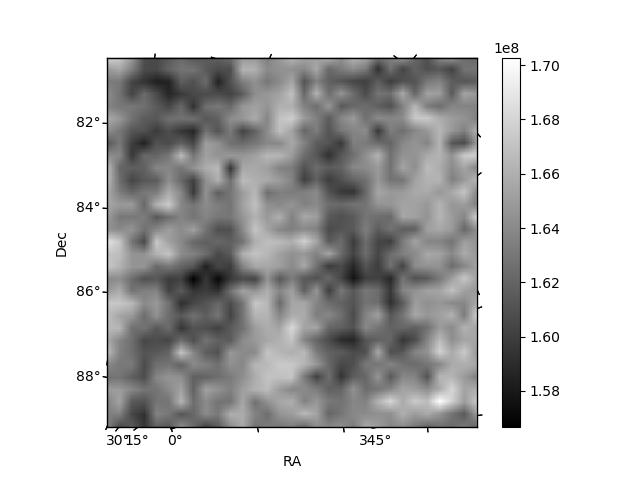
Histogram calculated using DETX and DETY for each event in the final _common_clean file
| Quadrant A | 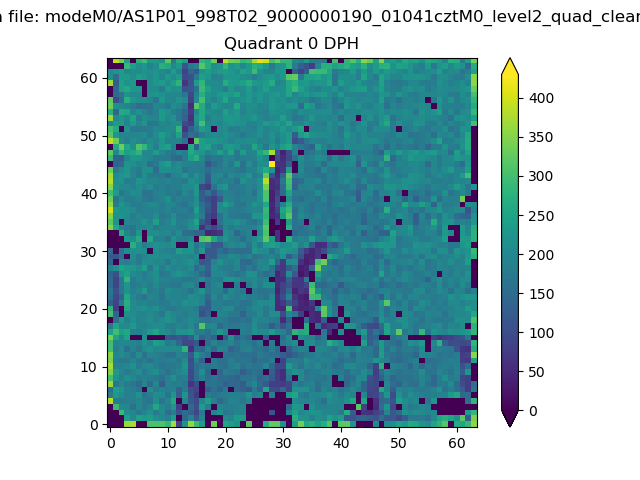 |
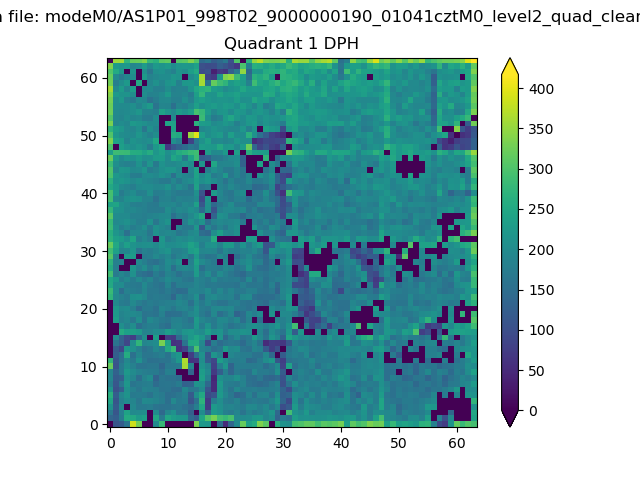 |
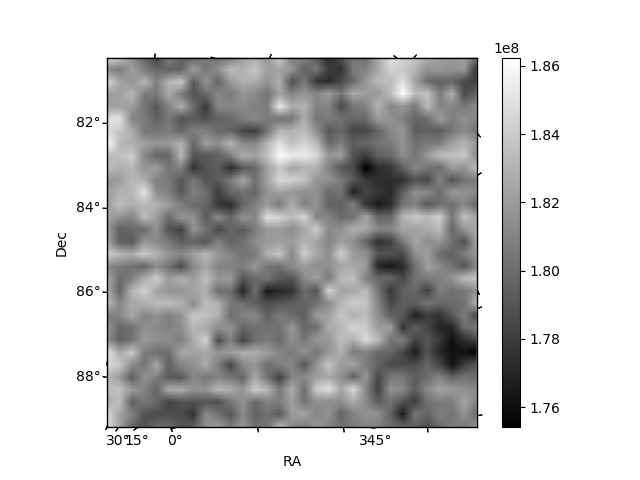
Quadrant B |
|---|---|---|---|
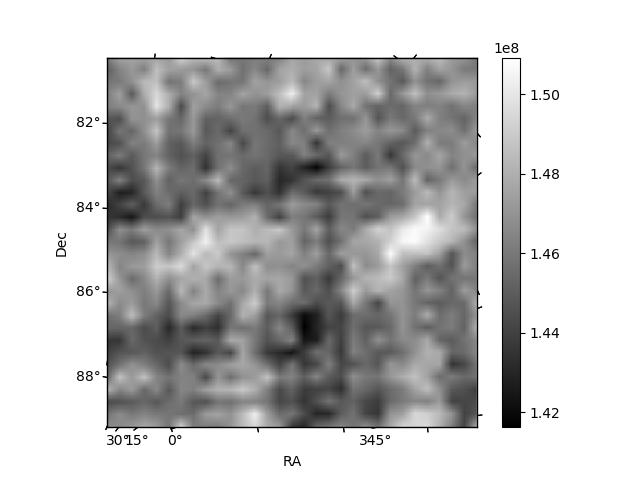
| Quadrant D | 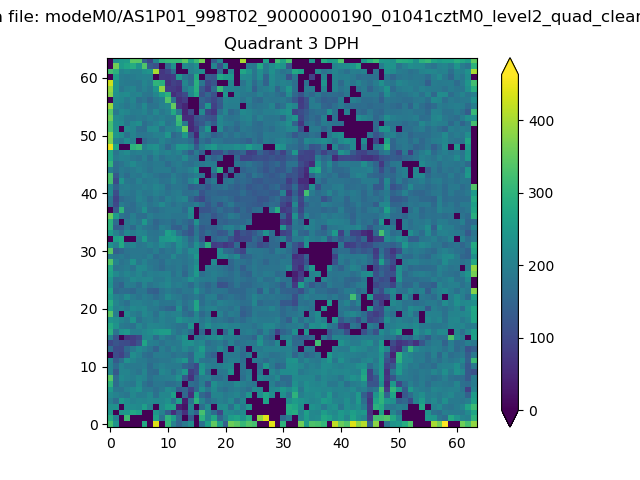 |
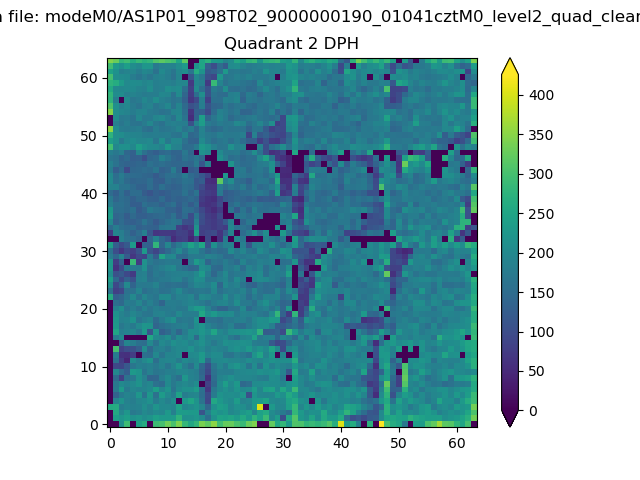 |
Quadrant C |
| Plot type | Count rate plots | Images |
|---|---|---|
| Comparison with Poisson distribution Blue bars denote a histogram of data divided into 1 sec bins. Red curve is a Poisson curve with rate = median count rate of data. |
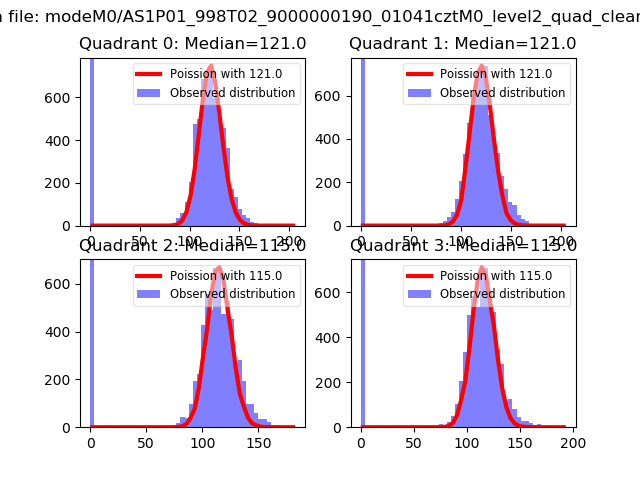 |
 |
| Quadrant-wise count rates Data is divided into 100 sec bins |
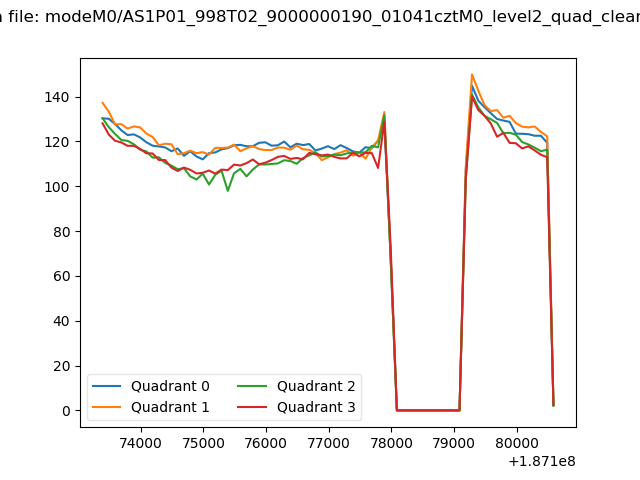 |
|
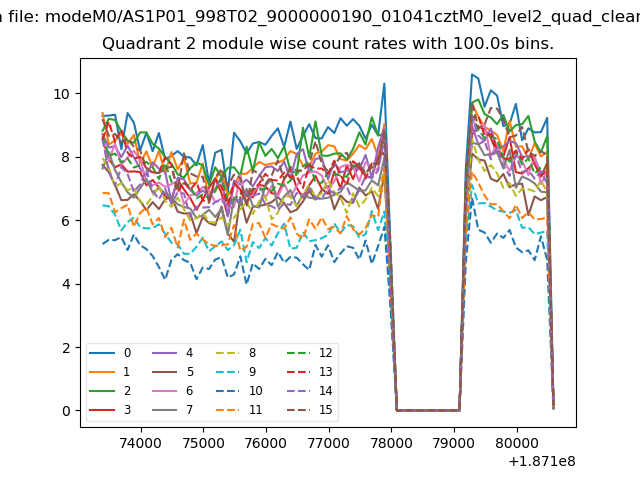
| Module-wise count rates for Quadrant A Data is divided into 100 sec bins |
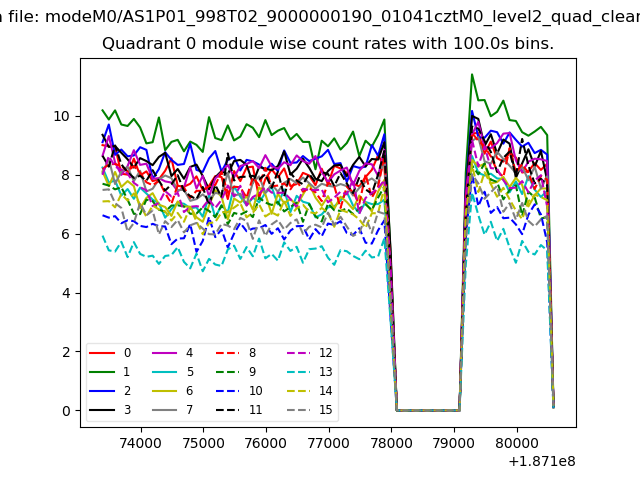 |
 |
| Module-wise count rates for Quadrant B Data is divided into 100 sec bins |
 |
 |
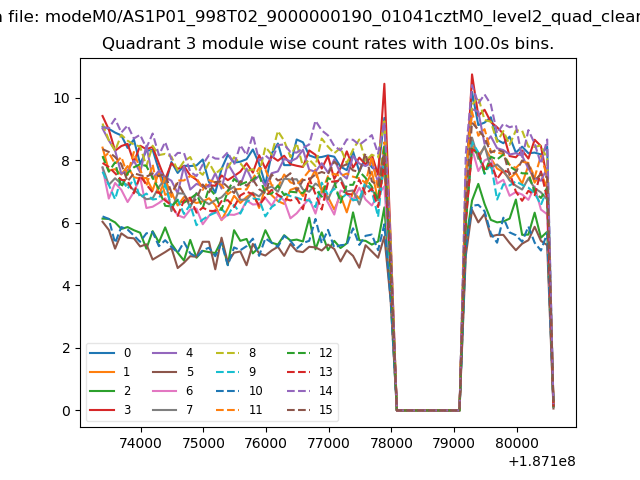
| Module-wise count rates for Quadrant C Data is divided into 100 sec bins |
 |
 |
| Module-wise count rates for Quadrant D Data is divided into 100 sec bins |
 |
 |
| Parameter | Plot |
|---|---|
| CZT HV Monitor | 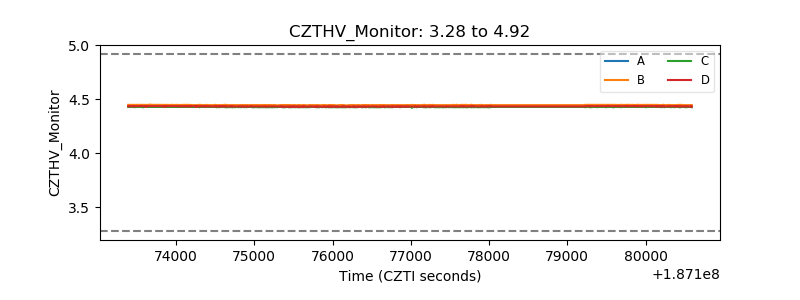 |
| D_VDD | 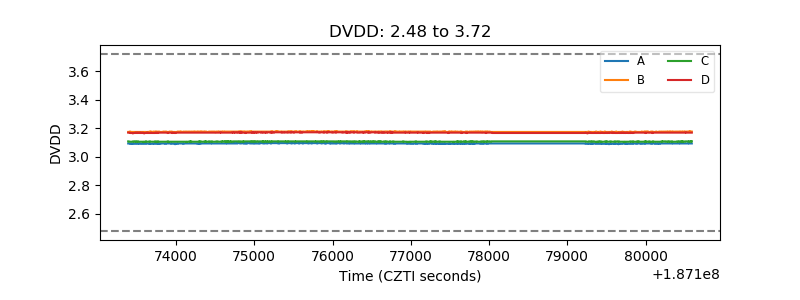 |
| Temperature 1 | 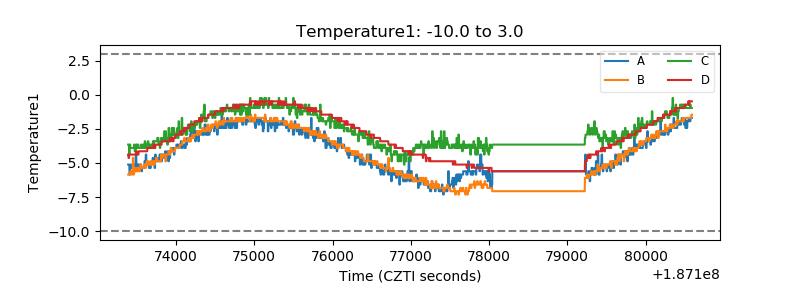 |
| Veto HV Monitor | 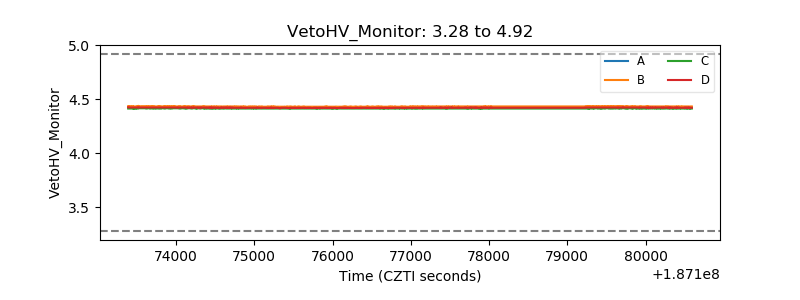 |
| Veto LLD | 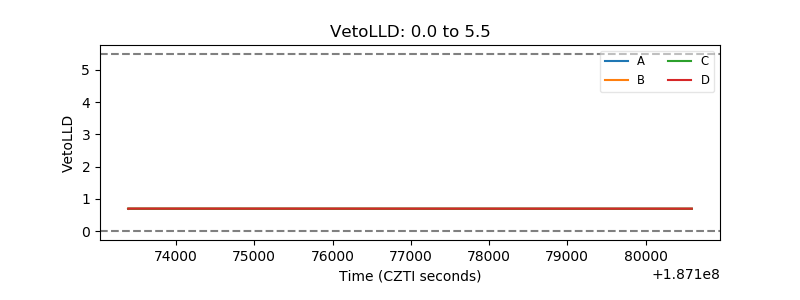 |
| Alpha Counter | 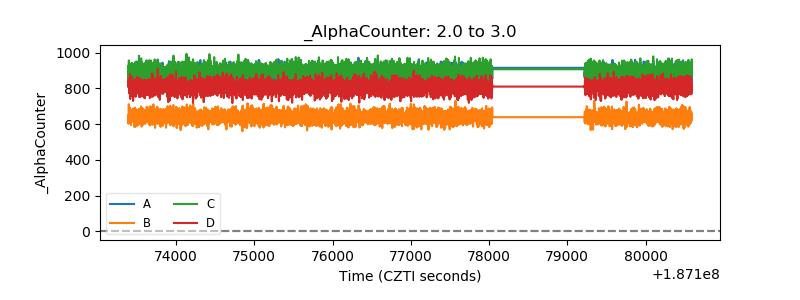 |
| _CPM_Rate | 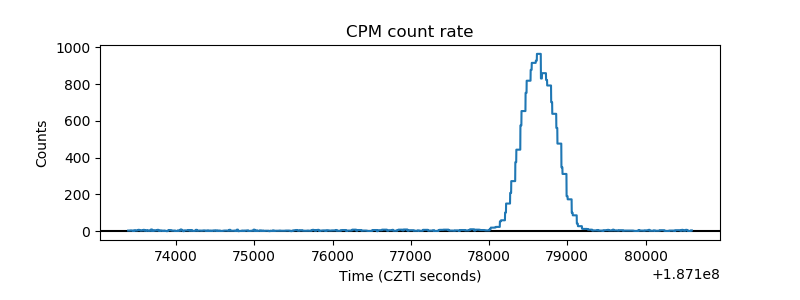 |
| CZT Counter | 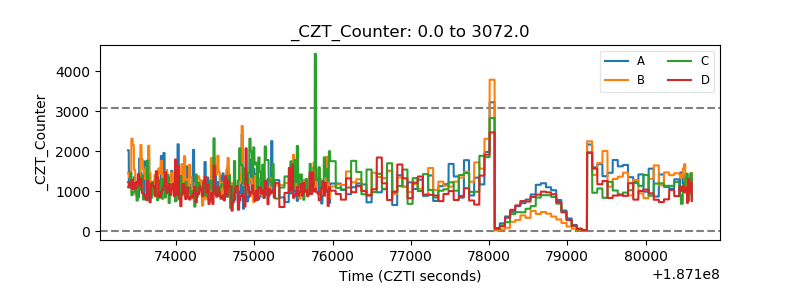 |
| +2.5 Volts monitor |  |
| +5 Volts monitor | 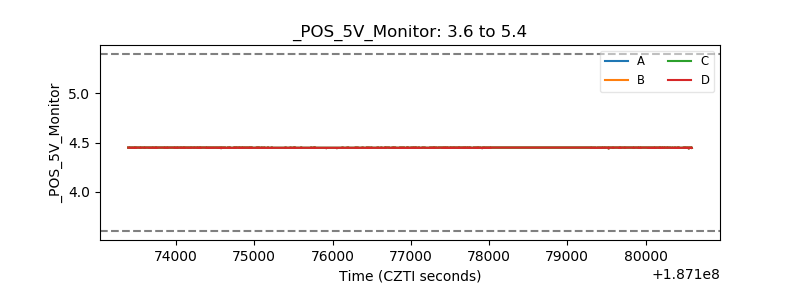 |
| _ROLL_ROT | 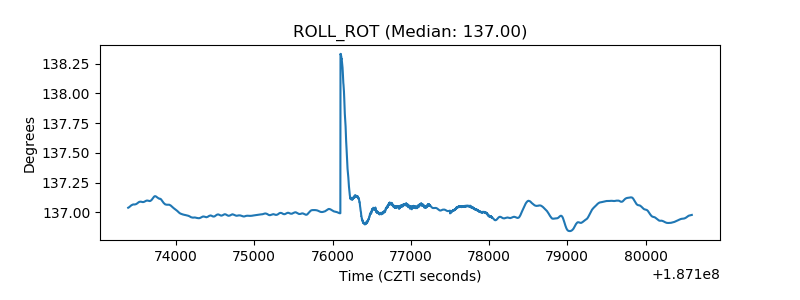 |
| _Roll_DEC | 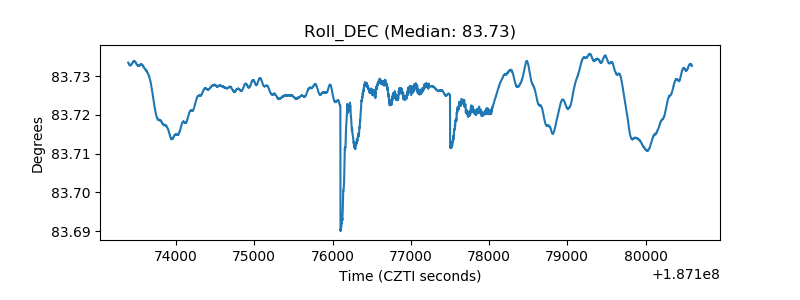 |
| _Roll_RA | 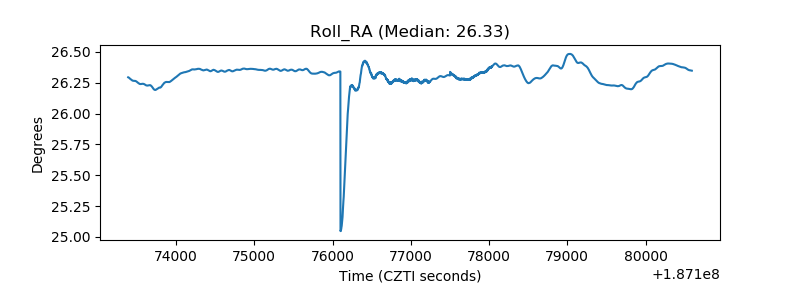 |
| Veto Counter | 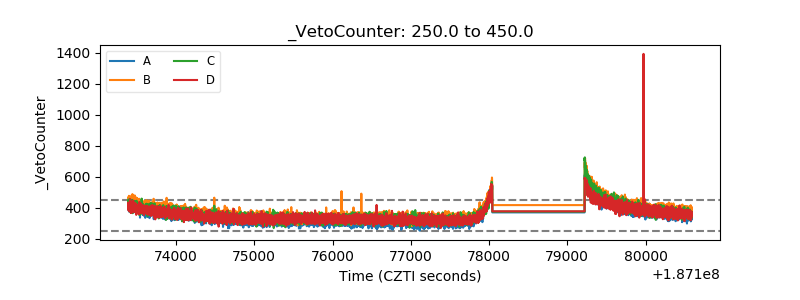 |