| Param | Original file | Final file |
|---|---|---|
| Filename | modeM0/AS1P01_998T02_9000000190_01042cztM0_level2.evt | modeM0/AS1P01_998T02_9000000190_01042cztM0_level2_quad_clean.evt |
| Size (bytes) | 990,167,040 | 109,365,120 |
| Size | 944.3 MB | 104.3 MB |
| Events in quadrant A | 7,282,101 | 738,016 |
| Events in quadrant B | 7,659,330 | 741,538 |
| Events in quadrant C | 7,427,941 | 707,136 |
| Events in quadrant D | 7,214,340 | 700,732 |
| Mode M0 | |||
|---|---|---|---|
| Quadrant | BADHDUFLAG | Total packets | Discarded packets |
| A | 0 | 25950 | 1 |
| B | 0 | 27096 | 1 |
| C | 0 | 26363 | 1 |
| D | 0 | 25769 | 3 |
| Mode SS | |||
|---|---|---|---|
| Quadrant | BADHDUFLAG | Total packets | Discarded packets |
| A | 0 | 124 | 0 |
| B | 0 | 124 | 0 |
| C | 0 | 124 | 0 |
| D | 0 | 124 | 0 |
| Mode M9 | |||
|---|---|---|---|
| Quadrant | BADHDUFLAG | Total packets | Discarded packets |
| A | 0 | 12 | 0 |
| B | 0 | 12 | 0 |
| C | 0 | 12 | 0 |
| D | 0 | 12 | 0 |
| Quadrant | Total seconds | Saturated seconds | Saturation percentage |
|---|---|---|---|
| A | 6083 | 56 | 0.920598% |
| B | 6083 | 77 | 1.265823% |
| C | 6084 | 79 | 1.298488% |
| D | 6083 | 163 | 2.679599% |
Noise dominated data is calculated using 1-second bins in cleaned event files. If a bin has >2000 counts, and if more than 50% of those come from <1% of pixels, then it is considered to be noise-dominated and hence unusable.
| Quadrant | # 1 sec bins | Bins with >0 counts | Bins with >2000 counts | High rate bins dominated by noise | Noise dominated (total time) | Noise dominated (detector-on time) | Marked lightcurve |
|---|---|---|---|---|---|---|---|
| A | 7268 | 6084 | 226 | 226 | 3.11% | 3.71% | 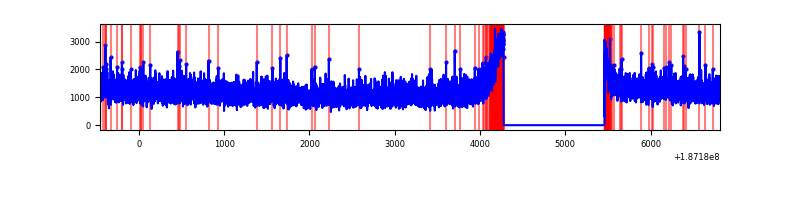 |
| B | 7268 | 6084 | 311 | 311 | 4.28% | 5.11% | 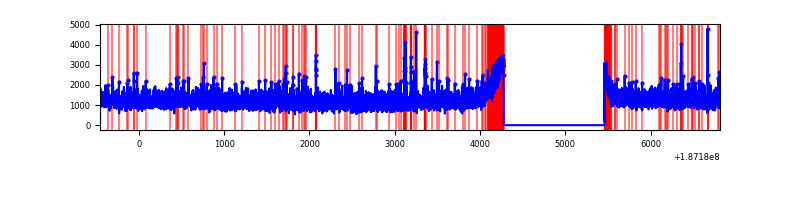 |
| C | 7269 | 6085 | 274 | 274 | 3.77% | 4.50% | 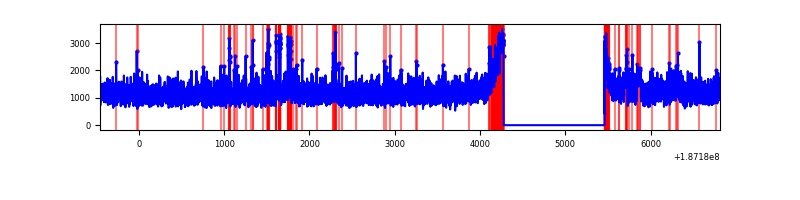 |
| D | 7268 | 6084 | 480 | 480 | 6.60% | 7.89% | 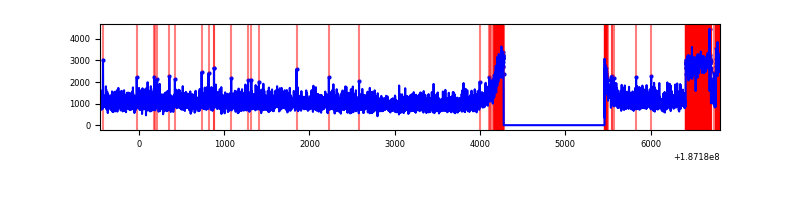 |
Top three noisy pixels from each quadrant. If the there are fewer than three noisy pixels in the level2.evt file, extra rows are filled as -1
| Pixel properties | Quadrant properties | ||||||
|---|---|---|---|---|---|---|---|
| Quadrant | DetID | PixID | Counts | Sigma | Mean | Median | Sigma |
| A | 15 | 127 | 19443 | 38.73 | 1892 | 1902 | 452.9 |
| A | 11 | 79 | 7141 | 11.57 | 1892 | 1902 | 452.9 |
| A | 3 | 111 | 5730 | 8.45 | 1892 | 1902 | 452.9 |
| B | 5 | 249 | 163627 | 353.32 | 1943 | 1946 | 457.6 |
| B | 0 | 220 | 28108 | 57.17 | 1943 | 1946 | 457.6 |
| B | 15 | 154 | 22612 | 45.16 | 1943 | 1946 | 457.6 |
| C | 15 | 241 | 287903 | 586.16 | 1767 | 1832 | 488.0 |
| C | 8 | 208 | 97697 | 196.43 | 1767 | 1832 | 488.0 |
| C | 12 | 4 | 87412 | 175.35 | 1767 | 1832 | 488.0 |
| D | 10 | 119 | 575531 | 1062.62 | 1744 | 1803 | 539.9 |
| D | 12 | 22 | 53858 | 96.41 | 1744 | 1803 | 539.9 |
| D | 10 | 125 | 42847 | 76.02 | 1744 | 1803 | 539.9 |
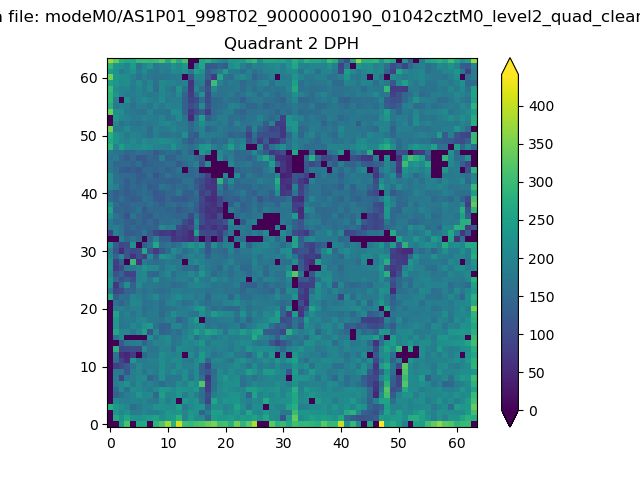
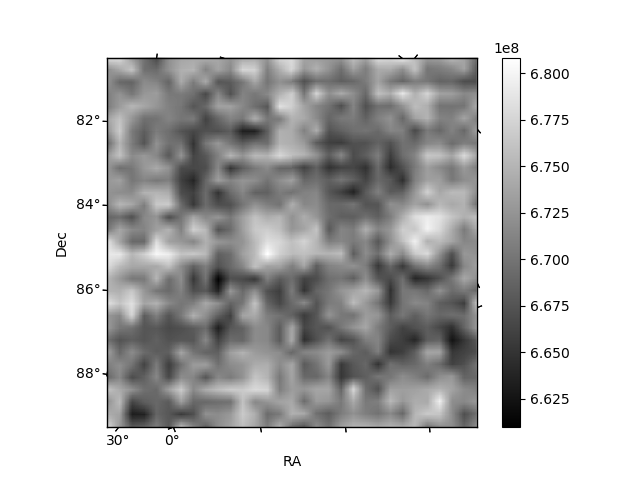
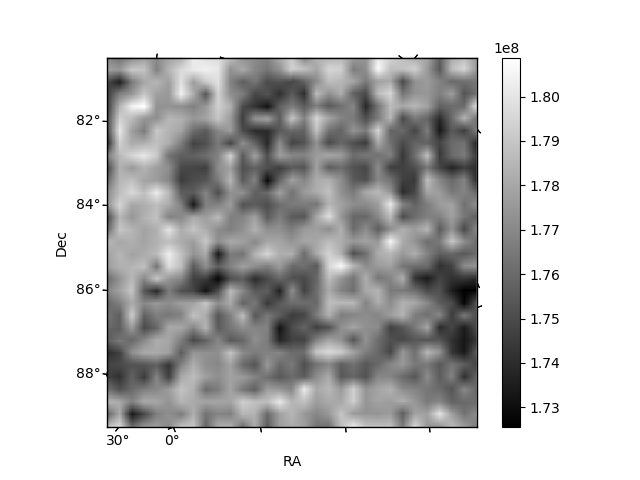
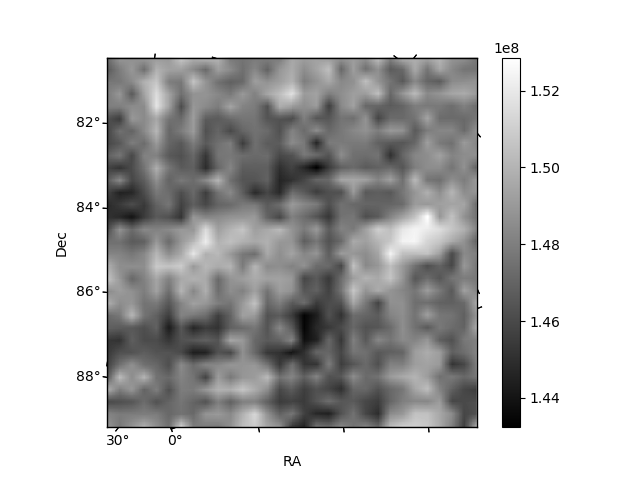
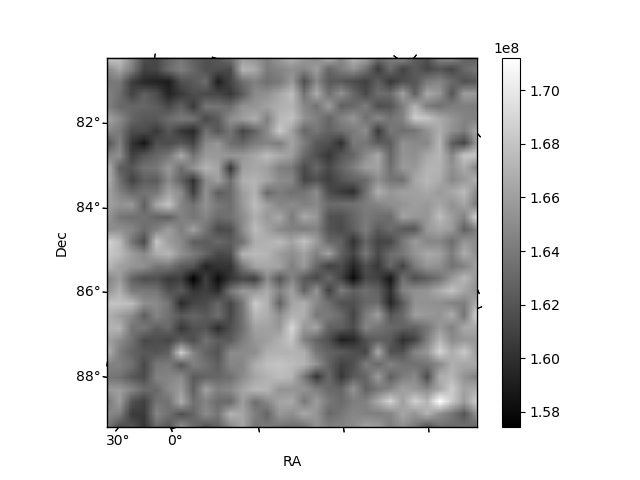
Histogram calculated using DETX and DETY for each event in the final _common_clean file
| Quadrant A | 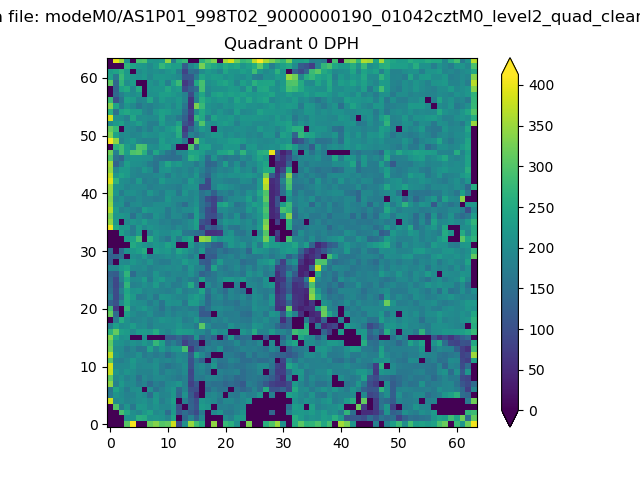 |
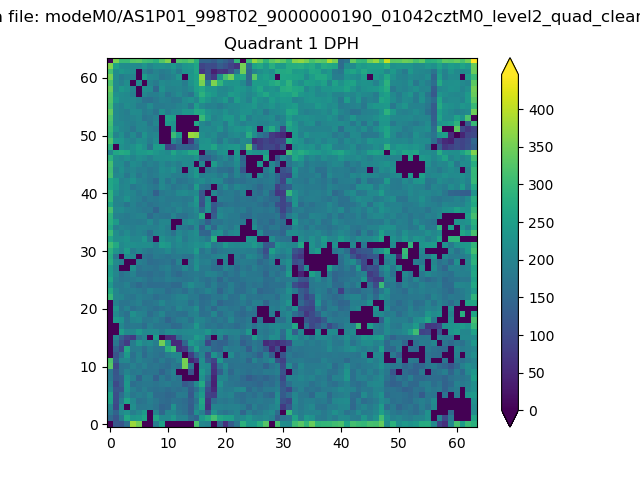 |
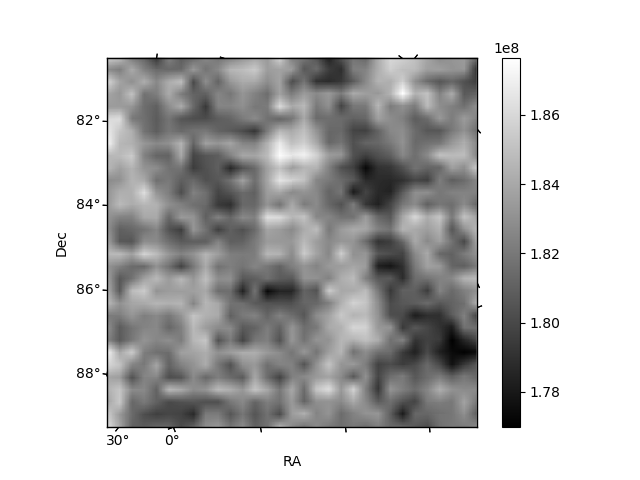
Quadrant B |
|---|---|---|---|
| Quadrant D | 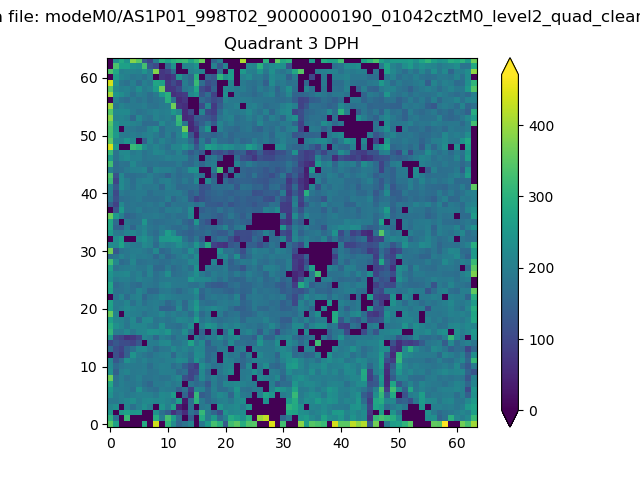 |
 |
Quadrant C |
| Plot type | Count rate plots | Images |
|---|---|---|
| Comparison with Poisson distribution Blue bars denote a histogram of data divided into 1 sec bins. Red curve is a Poisson curve with rate = median count rate of data. |
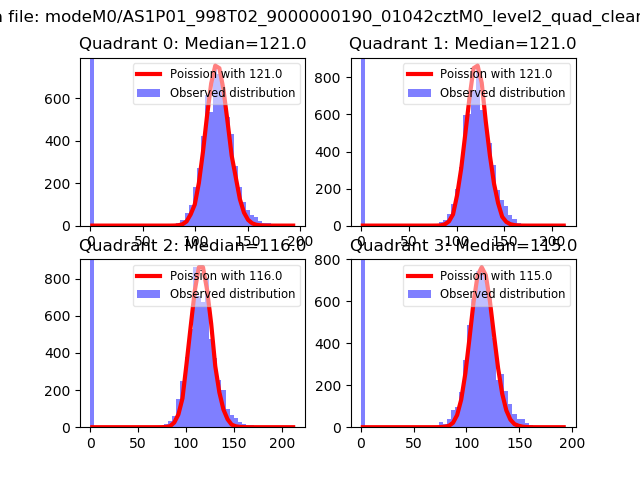 |
 |
| Quadrant-wise count rates Data is divided into 100 sec bins |
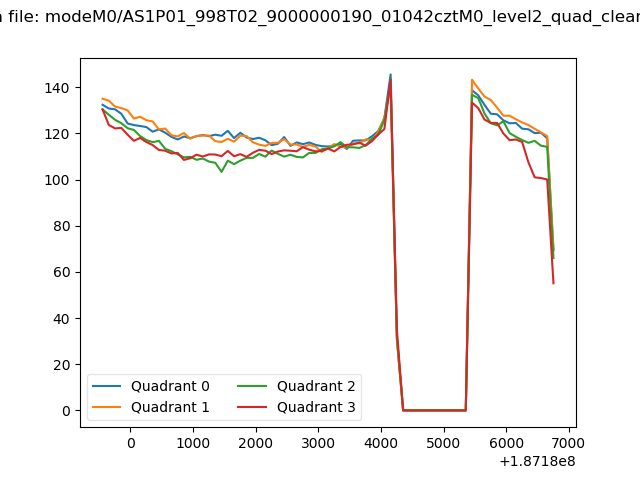 |
|
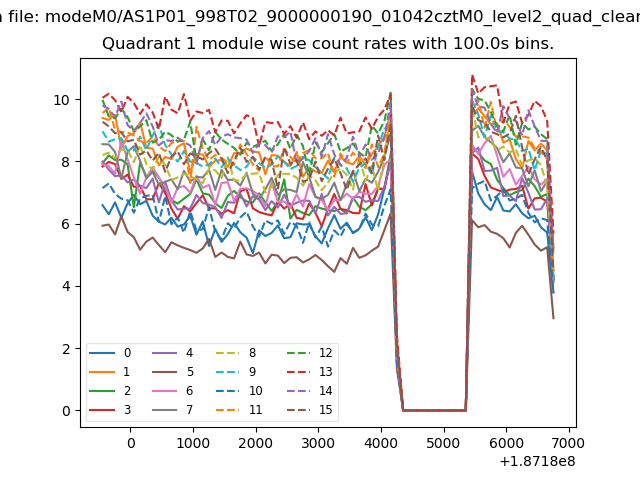
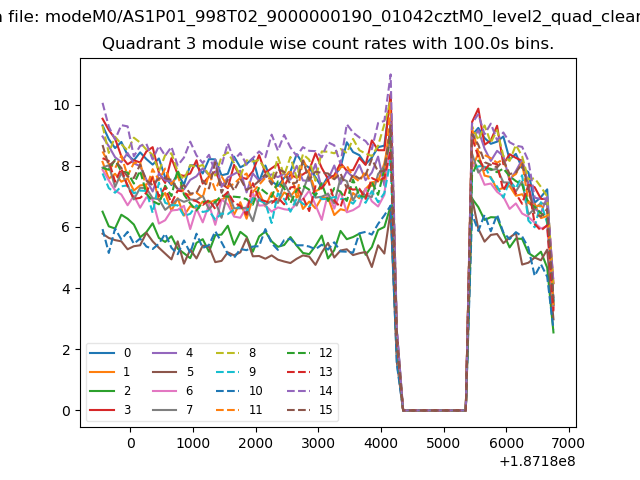
| Module-wise count rates for Quadrant A Data is divided into 100 sec bins |
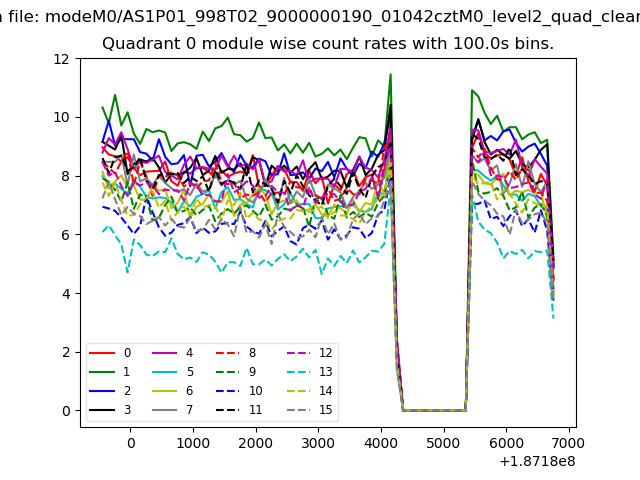 |
 |
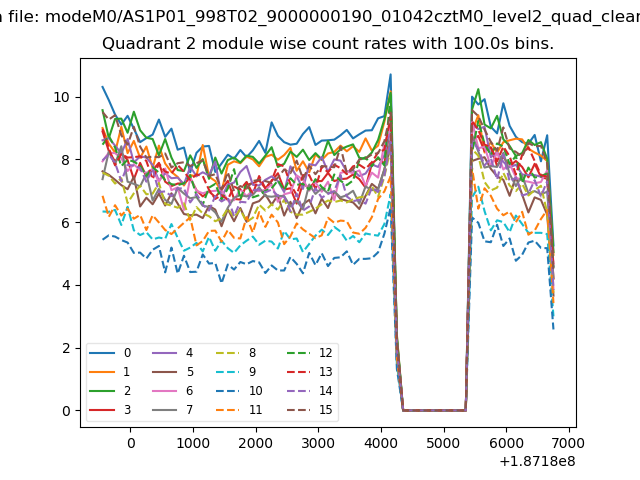
| Module-wise count rates for Quadrant B Data is divided into 100 sec bins |
 |
 |
| Module-wise count rates for Quadrant C Data is divided into 100 sec bins |
 |
 |
| Module-wise count rates for Quadrant D Data is divided into 100 sec bins |
 |
 |
| Parameter | Plot |
|---|---|
| CZT HV Monitor | 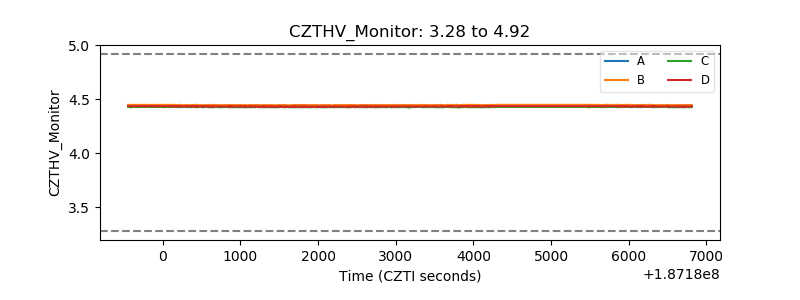 |
| D_VDD | 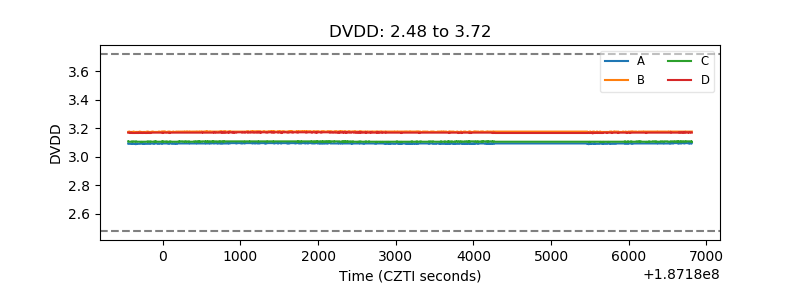 |
| Temperature 1 | 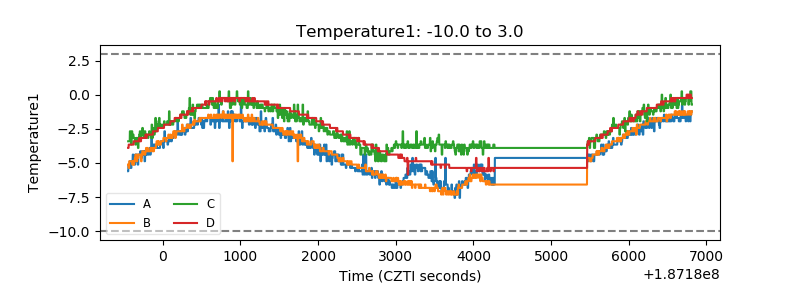 |
| Veto HV Monitor | 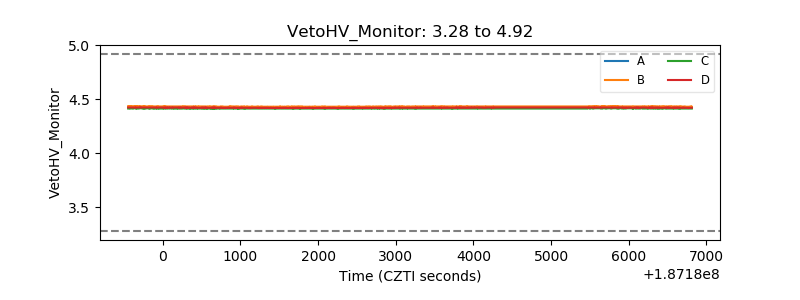 |
| Veto LLD | 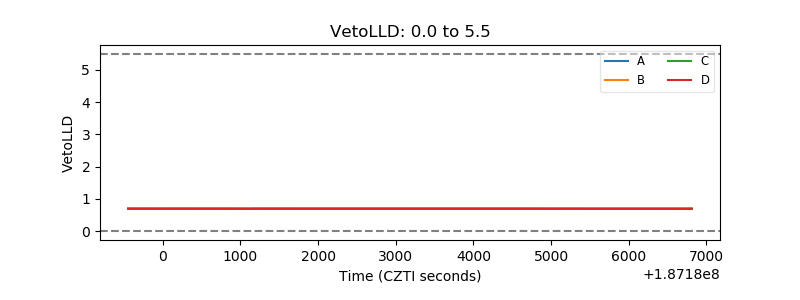 |
| Alpha Counter | 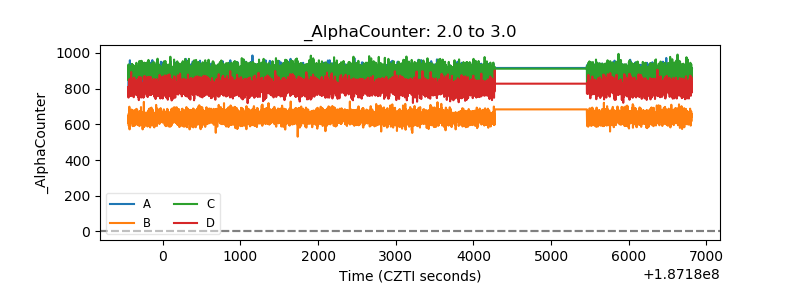 |
| _CPM_Rate | 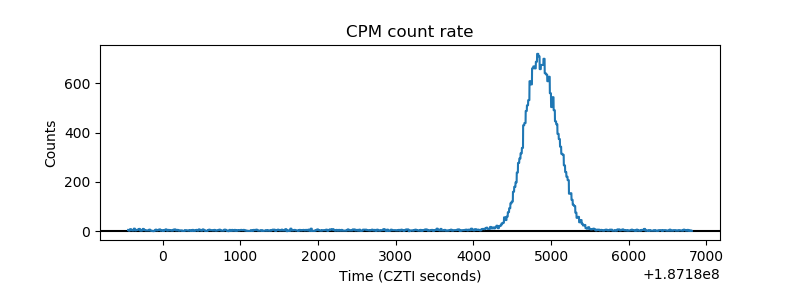 |
| CZT Counter | 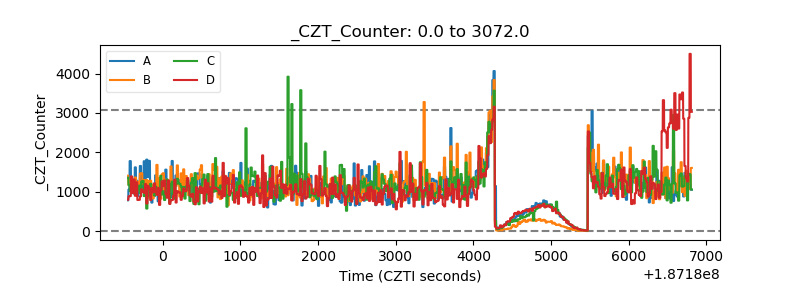 |
| +2.5 Volts monitor |  |
| +5 Volts monitor |  |
| _ROLL_ROT | 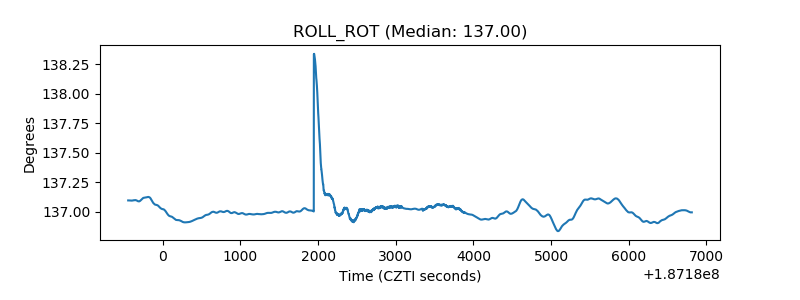 |
| _Roll_DEC | 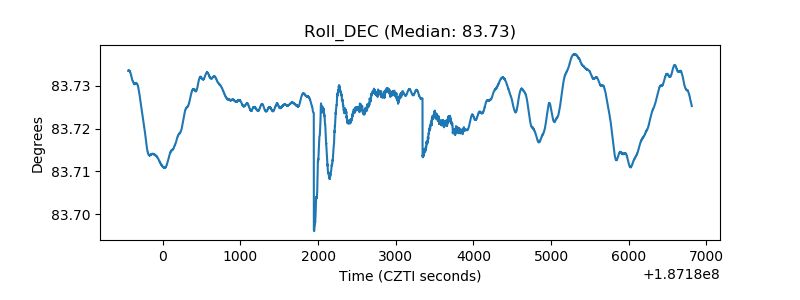 |
| _Roll_RA | 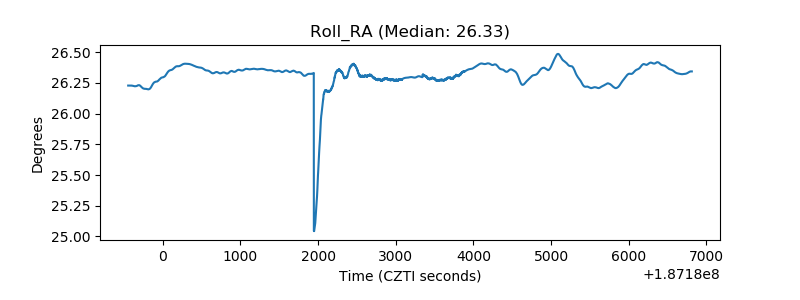 |
| Veto Counter | 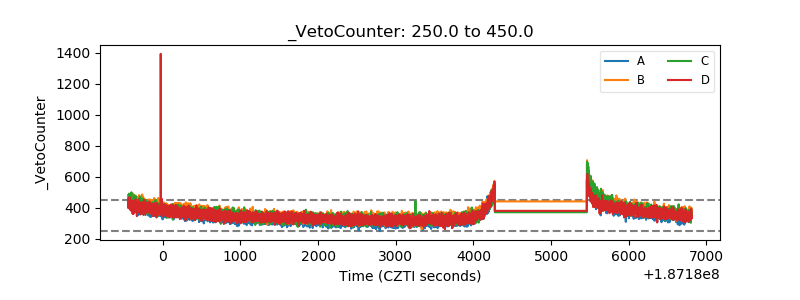 |