| Param | Original file | Final file |
|---|---|---|
| Filename | modeM0/AS1P01_998T02_9000000190_01043cztM0_level2.evt | modeM0/AS1P01_998T02_9000000190_01043cztM0_level2_quad_clean.evt |
| Size (bytes) | 1,178,784,000 | 112,242,240 |
| Size | 1.1 GB | 107.0 MB |
| Events in quadrant A | 7,636,942 | 769,356 |
| Events in quadrant B | 8,047,874 | 766,735 |
| Events in quadrant C | 8,597,963 | 723,965 |
| Events in quadrant D | 10,986,623 | 685,075 |
| Mode M0 | |||
|---|---|---|---|
| Quadrant | BADHDUFLAG | Total packets | Discarded packets |
| A | 0 | 27340 | 1 |
| B | 0 | 28513 | 1 |
| C | 0 | 30184 | 4 |
| D | 0 | 37358 | 1 |
| Mode SS | |||
|---|---|---|---|
| Quadrant | BADHDUFLAG | Total packets | Discarded packets |
| A | 0 | 134 | 0 |
| B | 0 | 134 | 0 |
| C | 0 | 134 | 0 |
| D | 0 | 134 | 0 |
| Mode M9 | |||
|---|---|---|---|
| Quadrant | BADHDUFLAG | Total packets | Discarded packets |
| A | 0 | 11 | 0 |
| B | 0 | 11 | 0 |
| C | 0 | 11 | 0 |
| D | 0 | 11 | 0 |
| Quadrant | Total seconds | Saturated seconds | Saturation percentage |
|---|---|---|---|
| A | 6501 | 19 | 0.292263% |
| B | 6501 | 25 | 0.384556% |
| C | 6500 | 211 | 3.246154% |
| D | 6500 | 867 | 13.338462% |
Noise dominated data is calculated using 1-second bins in cleaned event files. If a bin has >2000 counts, and if more than 50% of those come from <1% of pixels, then it is considered to be noise-dominated and hence unusable.
| Quadrant | # 1 sec bins | Bins with >0 counts | Bins with >2000 counts | High rate bins dominated by noise | Noise dominated (total time) | Noise dominated (detector-on time) | Marked lightcurve |
|---|---|---|---|---|---|---|---|
| A | 7631 | 6502 | 199 | 199 | 2.61% | 3.06% | 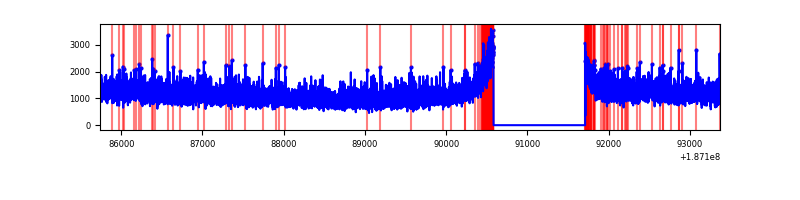 |
| B | 7631 | 6502 | 263 | 263 | 3.45% | 4.04% | 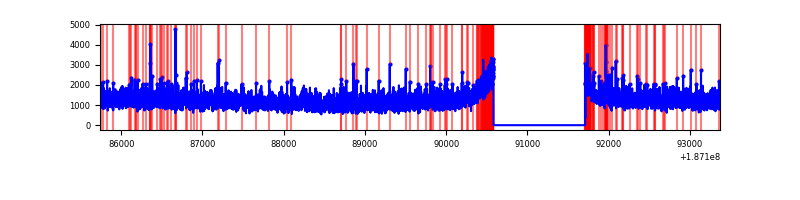 |
| C | 7630 | 6501 | 583 | 583 | 7.64% | 8.97% | 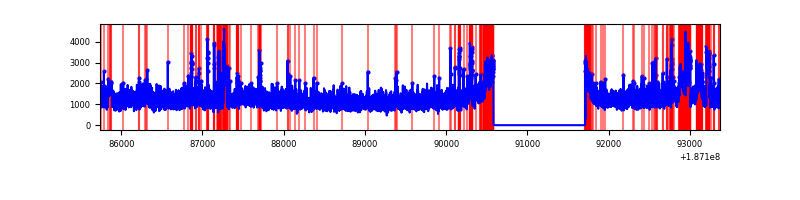 |
| D | 7630 | 6501 | 2064 | 2064 | 27.05% | 31.75% | 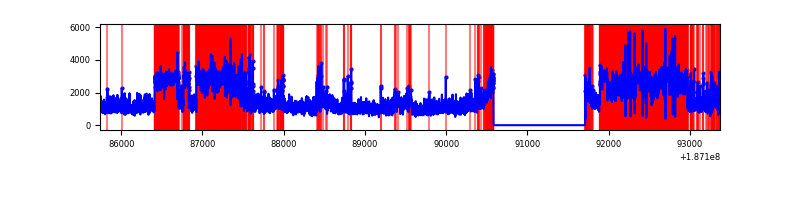 |
Top three noisy pixels from each quadrant. If the there are fewer than three noisy pixels in the level2.evt file, extra rows are filled as -1
| Pixel properties | Quadrant properties | ||||||
|---|---|---|---|---|---|---|---|
| Quadrant | DetID | PixID | Counts | Sigma | Mean | Median | Sigma |
| A | 4 | 33 | 13062 | 23.37 | 1983 | 1994 | 473.5 |
| A | 11 | 79 | 7183 | 10.96 | 1983 | 1994 | 473.5 |
| A | 12 | 243 | 6976 | 10.52 | 1983 | 1994 | 473.5 |
| B | 15 | 154 | 121006 | 247.0 | 2045 | 2050 | 481.6 |
| B | 5 | 249 | 83195 | 168.49 | 2045 | 2050 | 481.6 |
| B | 15 | 22 | 18680 | 34.53 | 2045 | 2050 | 481.6 |
| C | 8 | 208 | 778308 | 1515.79 | 1848 | 1910 | 512.2 |
| C | 15 | 241 | 400997 | 779.15 | 1848 | 1910 | 512.2 |
| C | 12 | 4 | 110330 | 211.67 | 1848 | 1910 | 512.2 |
| D | 12 | 22 | 2652090 | 4892.64 | 1769 | 1836 | 541.7 |
| D | 10 | 119 | 1298316 | 2393.43 | 1769 | 1836 | 541.7 |
| D | 1 | 83 | 243882 | 446.84 | 1769 | 1836 | 541.7 |
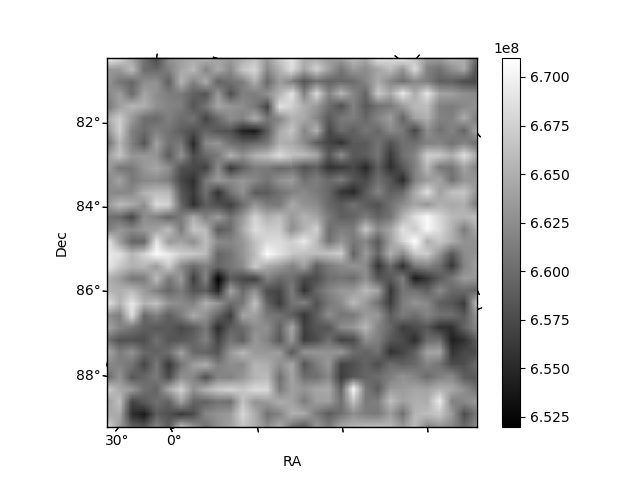
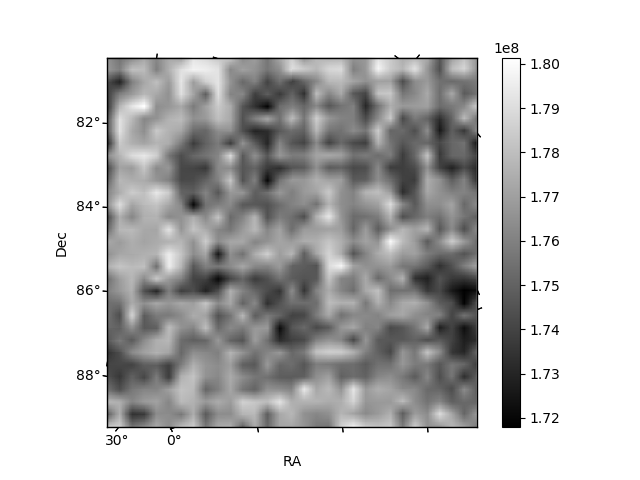
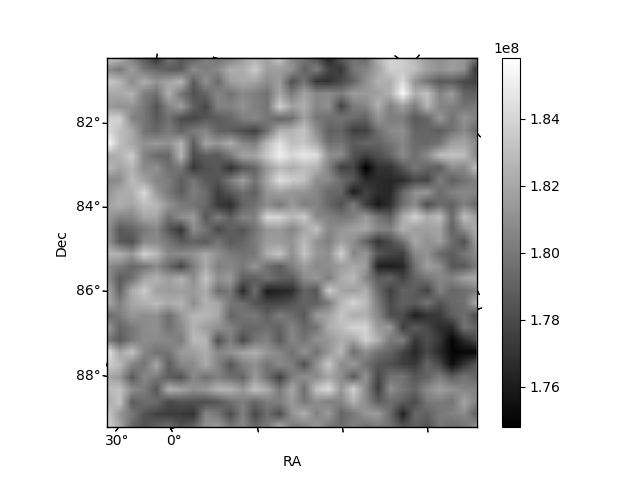
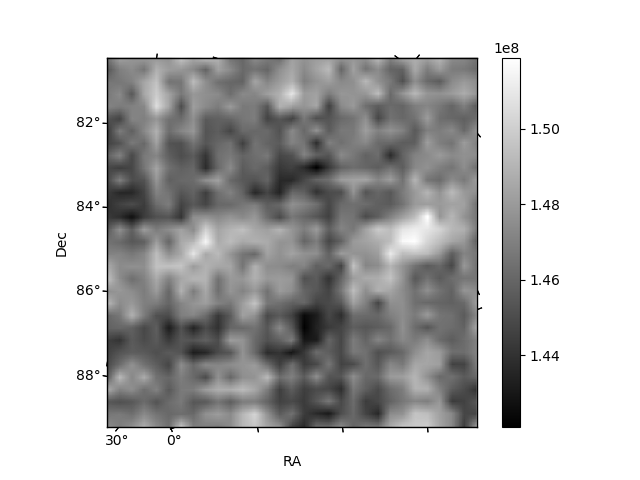
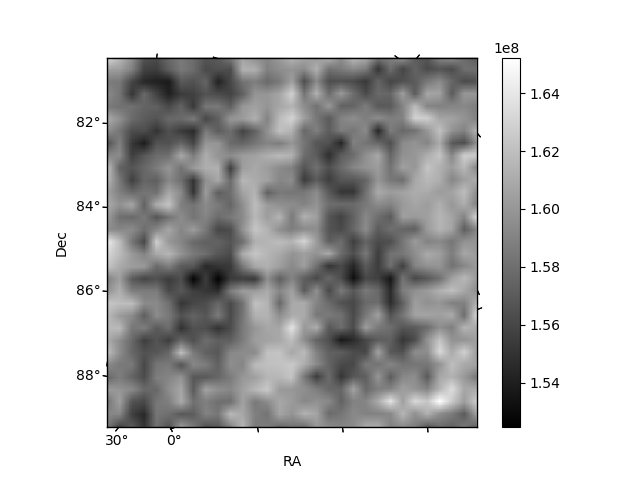
Histogram calculated using DETX and DETY for each event in the final _common_clean file
| Quadrant A | 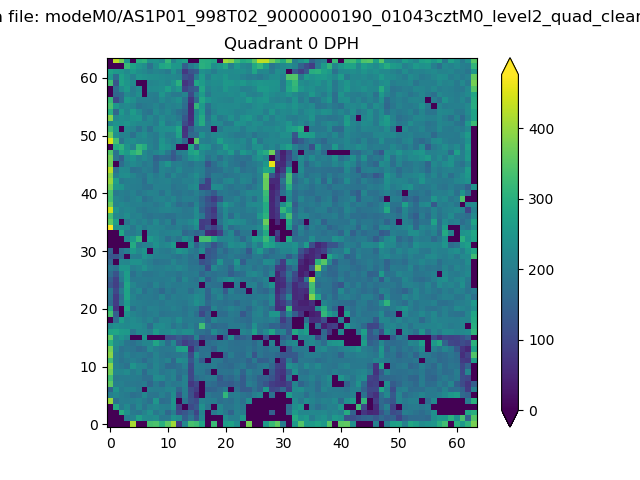 |
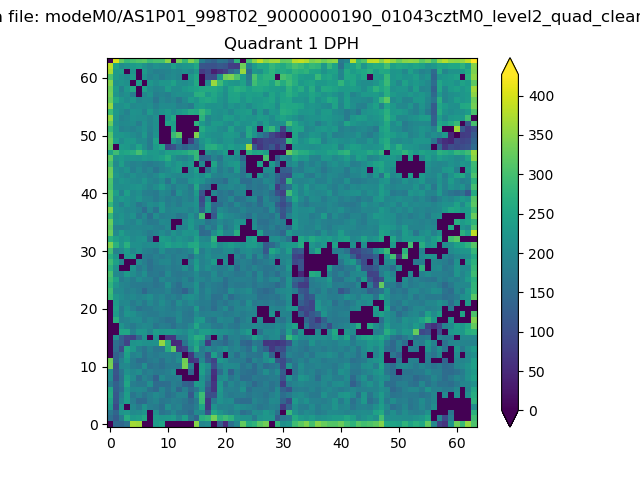 |
Quadrant B |
|---|---|---|---|
| Quadrant D | 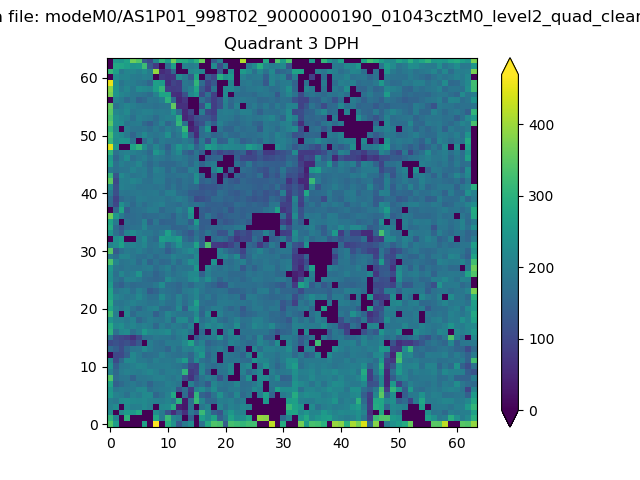 |
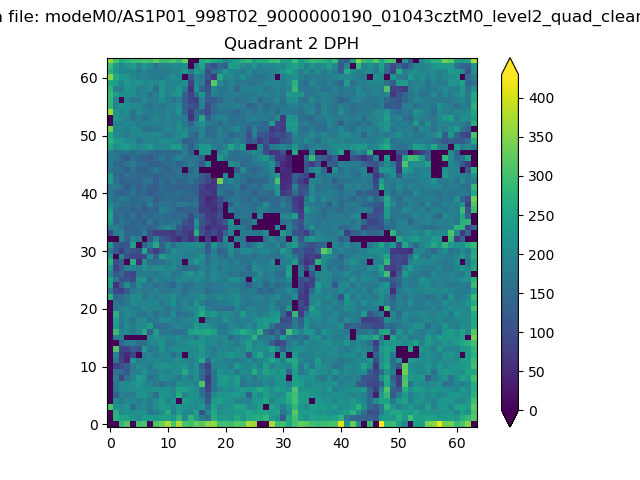 |
Quadrant C |
| Plot type | Count rate plots | Images |
|---|---|---|
| Comparison with Poisson distribution Blue bars denote a histogram of data divided into 1 sec bins. Red curve is a Poisson curve with rate = median count rate of data. |
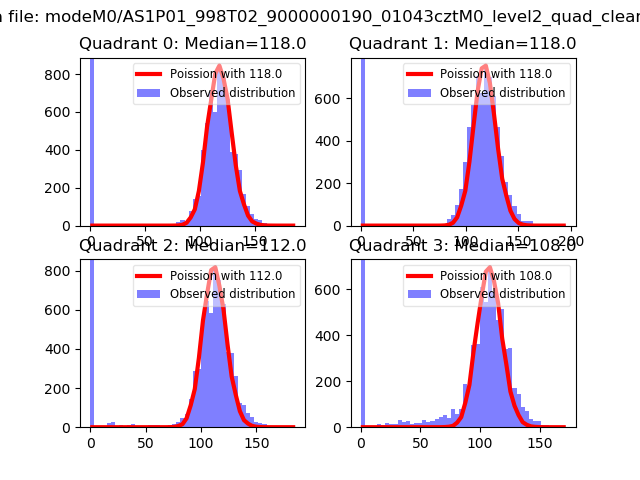 |
 |
| Quadrant-wise count rates Data is divided into 100 sec bins |
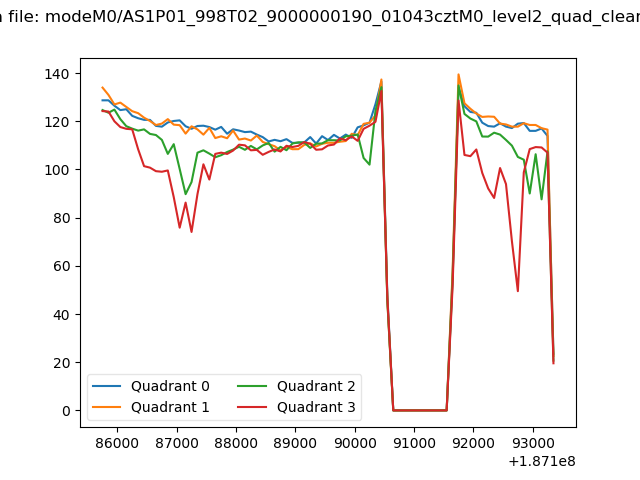 |
|
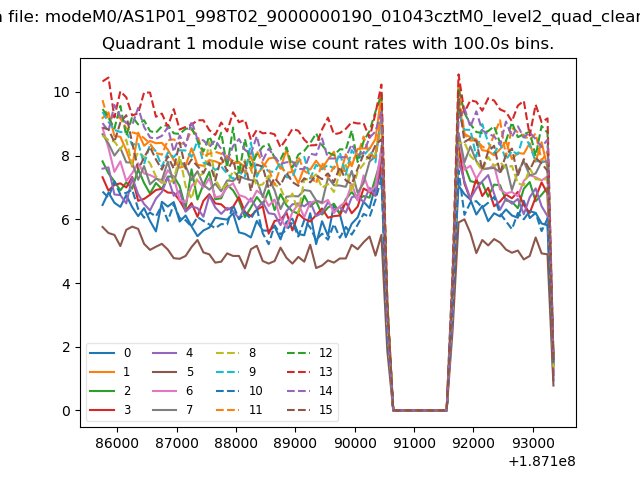
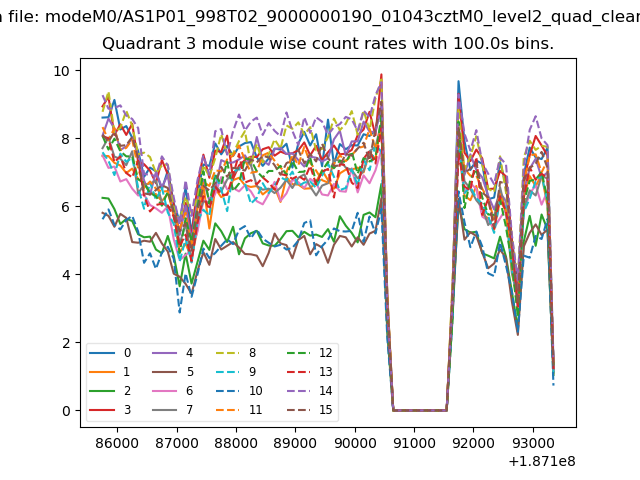
| Module-wise count rates for Quadrant A Data is divided into 100 sec bins |
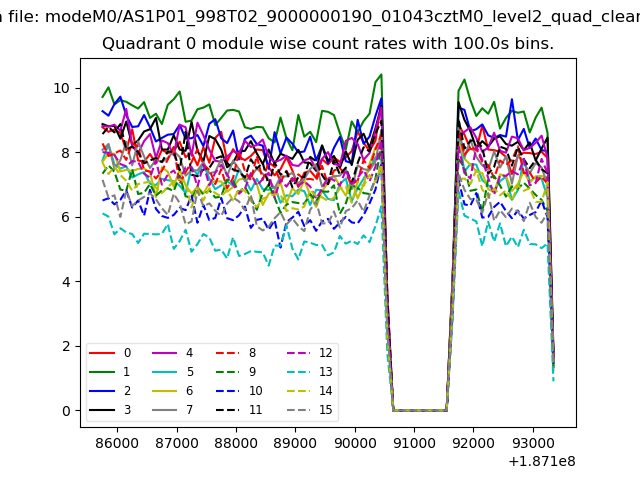 |
 |
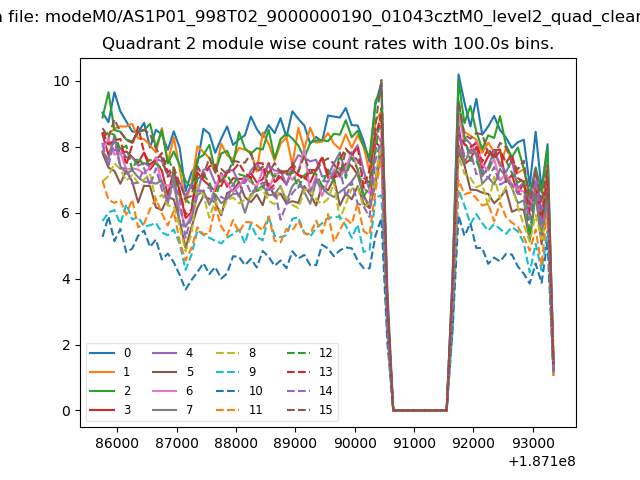
| Module-wise count rates for Quadrant B Data is divided into 100 sec bins |
 |
 |
| Module-wise count rates for Quadrant C Data is divided into 100 sec bins |
 |
 |
| Module-wise count rates for Quadrant D Data is divided into 100 sec bins |
 |
 |
| Parameter | Plot |
|---|---|
| CZT HV Monitor | 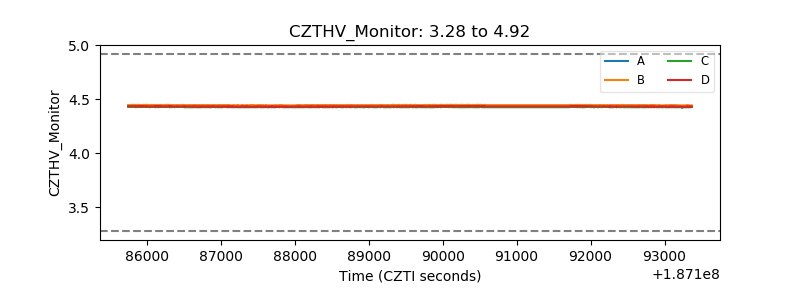 |
| D_VDD | 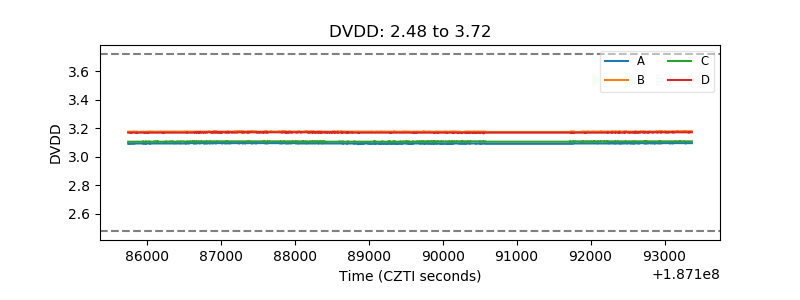 |
| Temperature 1 | 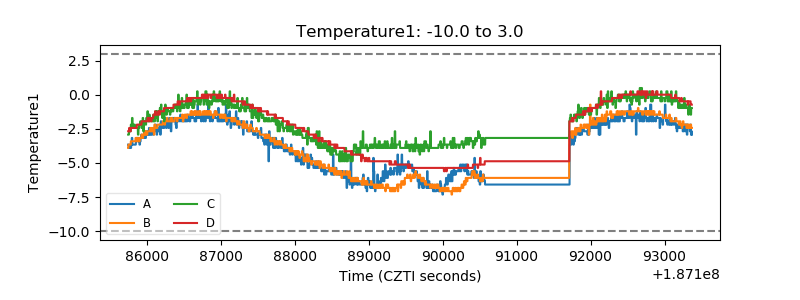 |
| Veto HV Monitor | 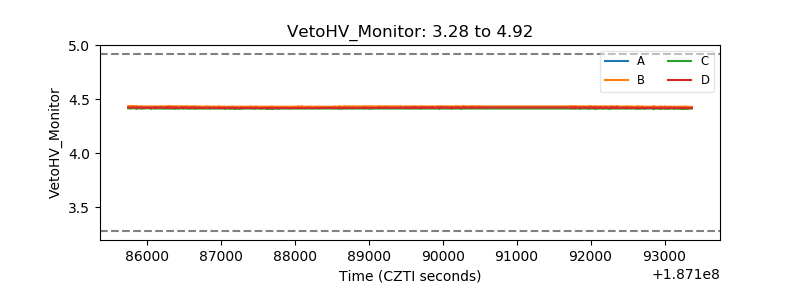 |
| Veto LLD | 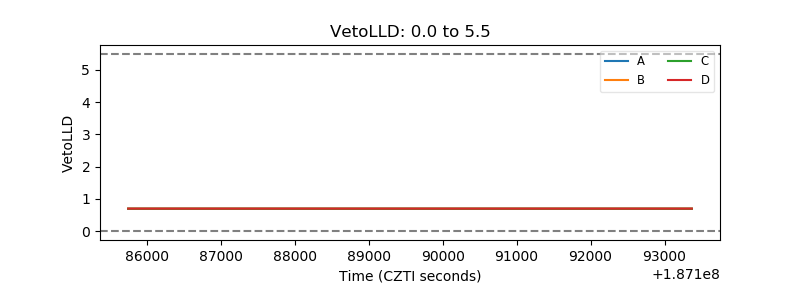 |
| Alpha Counter | 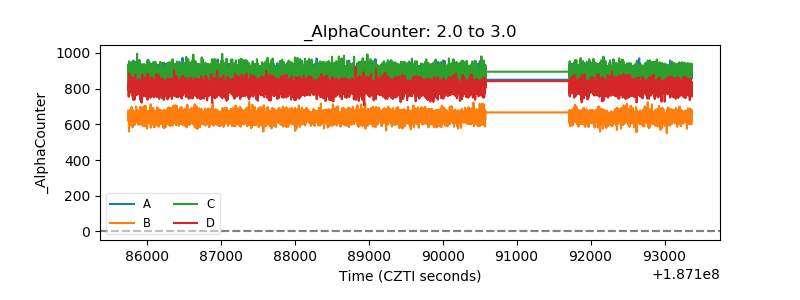 |
| _CPM_Rate | 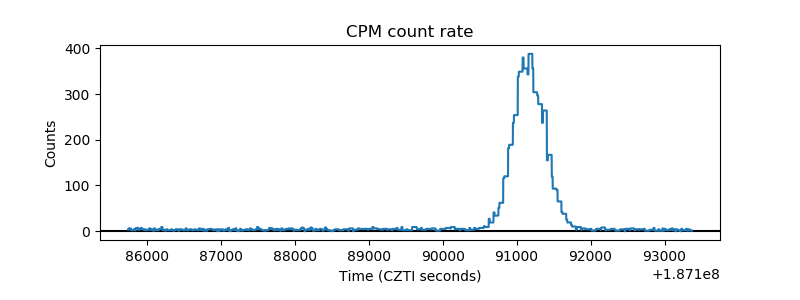 |
| CZT Counter | 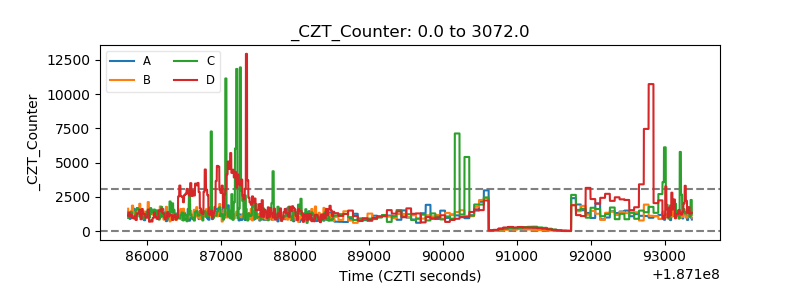 |
| +2.5 Volts monitor | 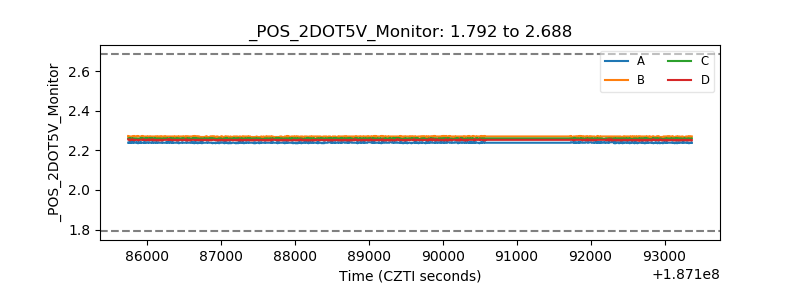 |
| +5 Volts monitor | 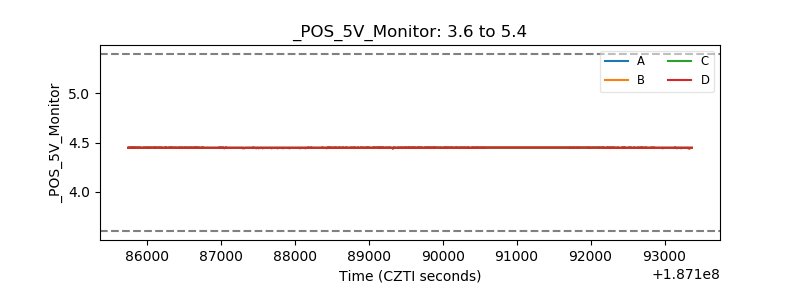 |
| _ROLL_ROT | 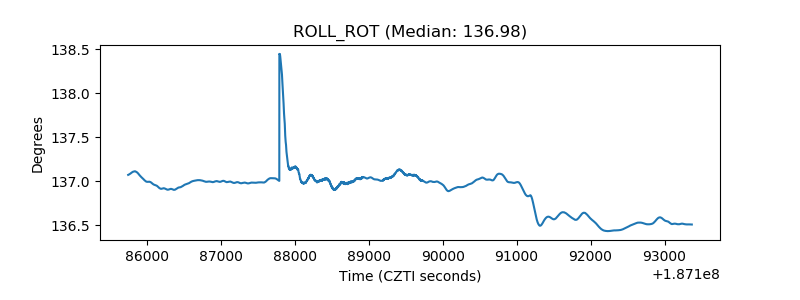 |
| _Roll_DEC | 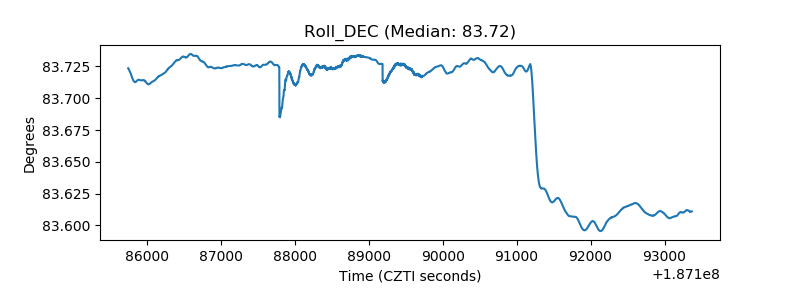 |
| _Roll_RA | 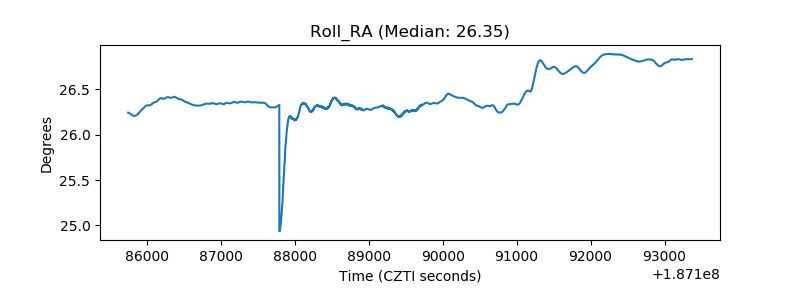 |
| Veto Counter | 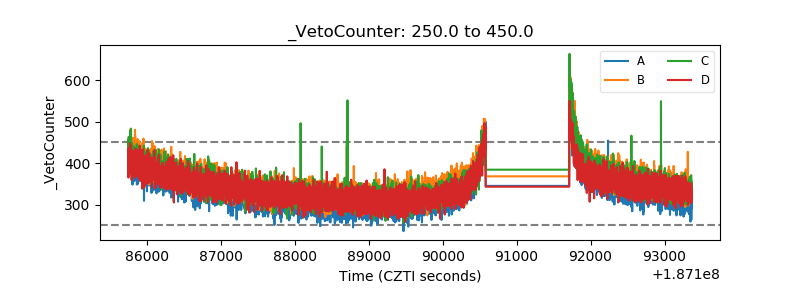 |