| Param | Original file | Final file |
|---|---|---|
| Filename | modeM0/AS1P01_998T02_9000000190_01046cztM0_level2.evt | modeM0/AS1P01_998T02_9000000190_01046cztM0_level2_quad_clean.evt |
| Size (bytes) | 1,237,979,520 | 126,293,760 |
| Size | 1.2 GB | 120.4 MB |
| Events in quadrant A | 8,922,312 | 840,128 |
| Events in quadrant B | 9,442,232 | 846,350 |
| Events in quadrant C | 9,586,873 | 815,146 |
| Events in quadrant D | 9,045,845 | 802,841 |
| Mode M0 | |||
|---|---|---|---|
| Quadrant | BADHDUFLAG | Total packets | Discarded packets |
| A | 0 | 31824 | 1 |
| B | 0 | 33309 | 1 |
| C | 0 | 33801 | 4 |
| D | 0 | 32185 | 1 |
| Mode SS | |||
|---|---|---|---|
| Quadrant | BADHDUFLAG | Total packets | Discarded packets |
| A | 0 | 152 | 0 |
| B | 0 | 152 | 0 |
| C | 0 | 152 | 0 |
| D | 0 | 152 | 0 |
| Mode M9 | |||
|---|---|---|---|
| Quadrant | BADHDUFLAG | Total packets | Discarded packets |
| A | 0 | 1 | 0 |
| B | 0 | 1 | 0 |
| C | 0 | 1 | 0 |
| D | 0 | 1 | 0 |
| Quadrant | Total seconds | Saturated seconds | Saturation percentage |
|---|---|---|---|
| A | 7482 | 10 | 0.133654% |
| B | 7482 | 32 | 0.427693% |
| C | 7481 | 18 | 0.240610% |
| D | 7482 | 76 | 1.015771% |
Noise dominated data is calculated using 1-second bins in cleaned event files. If a bin has >2000 counts, and if more than 50% of those come from <1% of pixels, then it is considered to be noise-dominated and hence unusable.
| Quadrant | # 1 sec bins | Bins with >0 counts | Bins with >2000 counts | High rate bins dominated by noise | Noise dominated (total time) | Noise dominated (detector-on time) | Marked lightcurve |
|---|---|---|---|---|---|---|---|
| A | 7637 | 7483 | 320 | 320 | 4.19% | 4.28% | 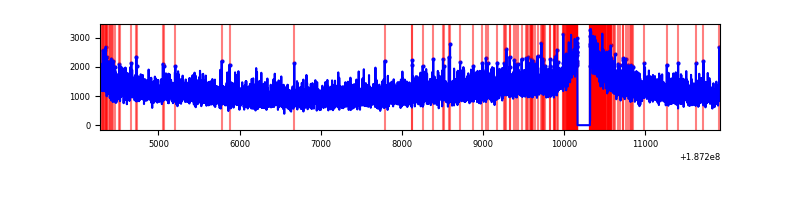 |
| B | 7637 | 7483 | 427 | 427 | 5.59% | 5.71% | 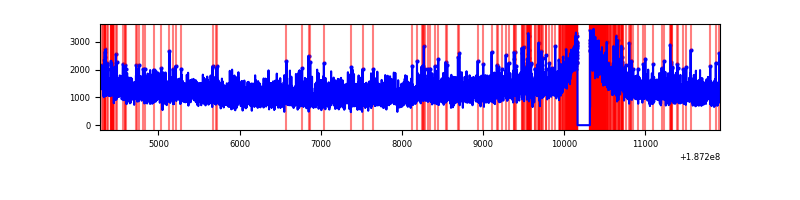 |
| C | 7636 | 7482 | 527 | 527 | 6.90% | 7.04% | 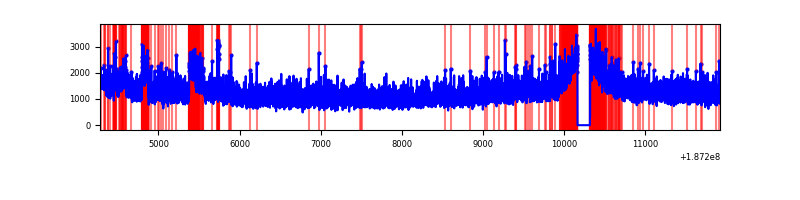 |
| D | 7637 | 7483 | 577 | 577 | 7.56% | 7.71% | 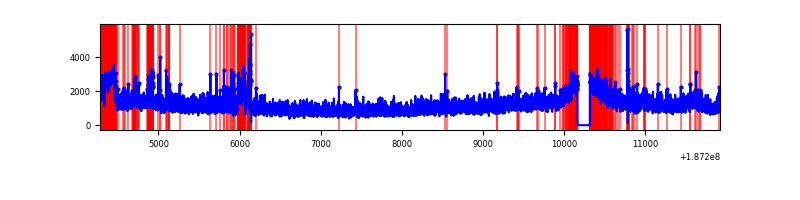 |
Top three noisy pixels from each quadrant. If the there are fewer than three noisy pixels in the level2.evt file, extra rows are filled as -1
| Pixel properties | Quadrant properties | ||||||
|---|---|---|---|---|---|---|---|
| Quadrant | DetID | PixID | Counts | Sigma | Mean | Median | Sigma |
| A | 14 | 111 | 26587 | 43.51 | 2317 | 2330 | 557.5 |
| A | 11 | 79 | 8968 | 11.91 | 2317 | 2330 | 557.5 |
| A | 3 | 111 | 6939 | 8.27 | 2317 | 2330 | 557.5 |
| B | 8 | 234 | 66150 | 111.67 | 2413 | 2415 | 570.7 |
| B | 15 | 22 | 55623 | 93.23 | 2413 | 2415 | 570.7 |
| B | 5 | 249 | 53841 | 90.11 | 2413 | 2415 | 570.7 |
| C | 8 | 208 | 406188 | 648.6 | 2227 | 2307 | 622.7 |
| C | 15 | 241 | 377130 | 601.94 | 2227 | 2307 | 622.7 |
| C | 3 | 79 | 48949 | 74.9 | 2227 | 2307 | 622.7 |
| D | 1 | 83 | 398726 | 615.7 | 2210 | 2260 | 643.9 |
| D | 12 | 22 | 241129 | 370.96 | 2210 | 2260 | 643.9 |
| D | 10 | 125 | 78393 | 118.23 | 2210 | 2260 | 643.9 |
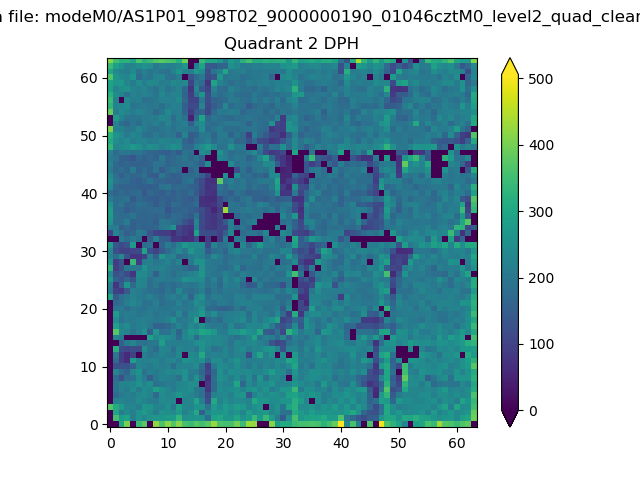
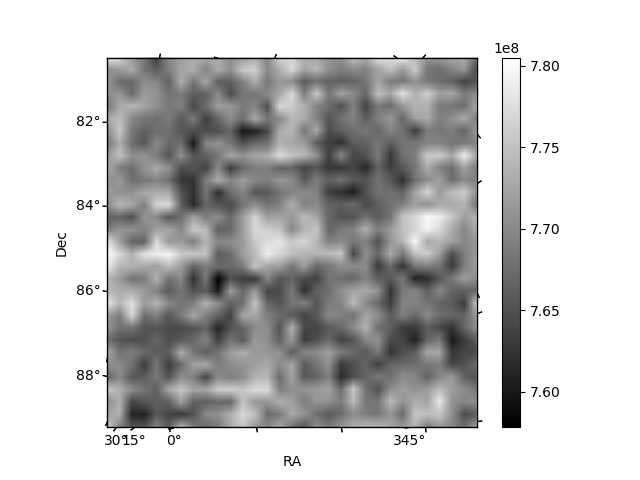
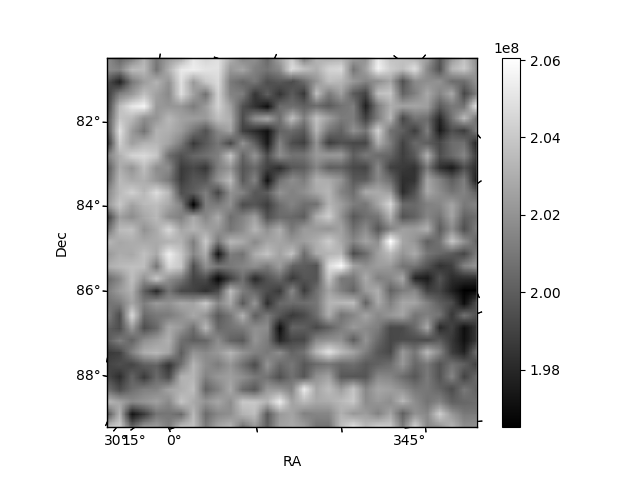
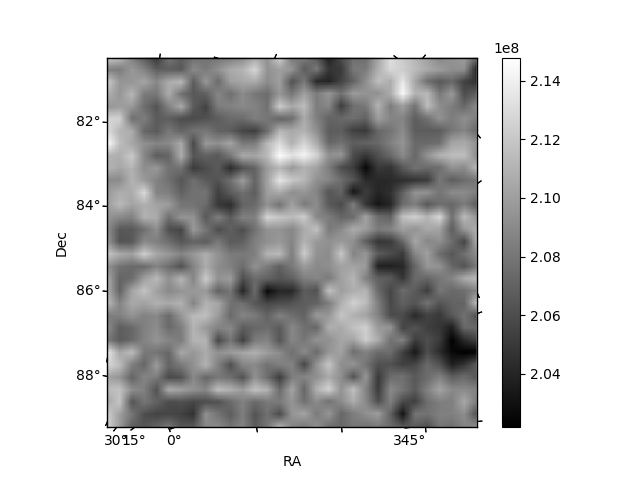
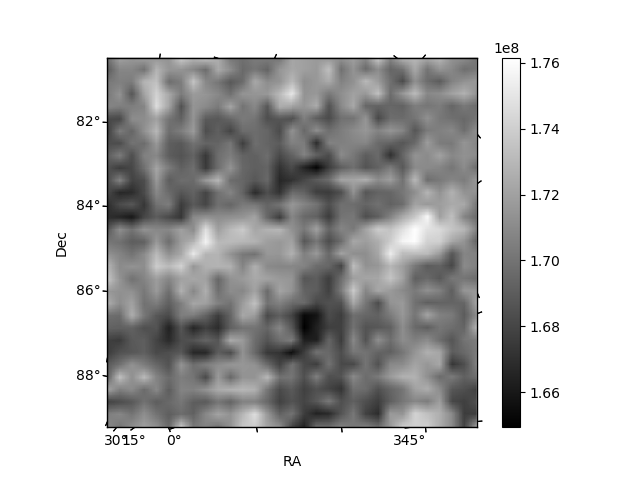
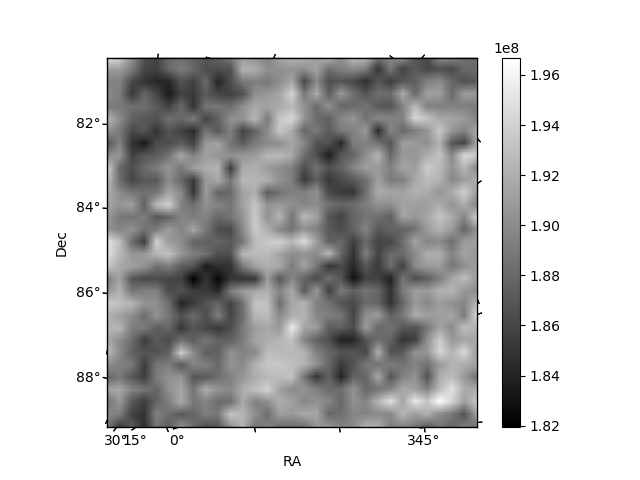
Histogram calculated using DETX and DETY for each event in the final _common_clean file
| Quadrant A | 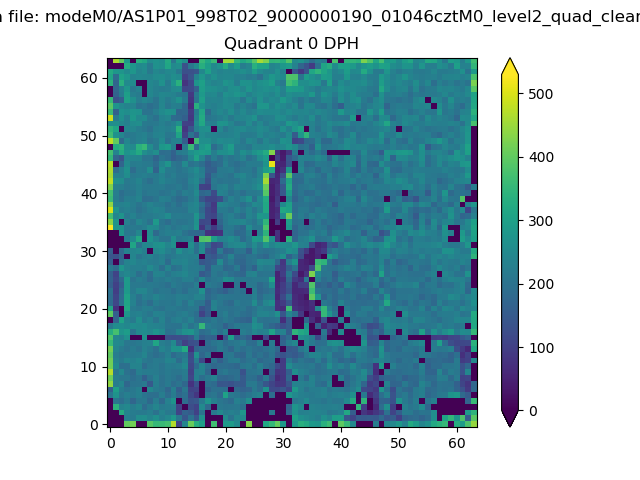 |
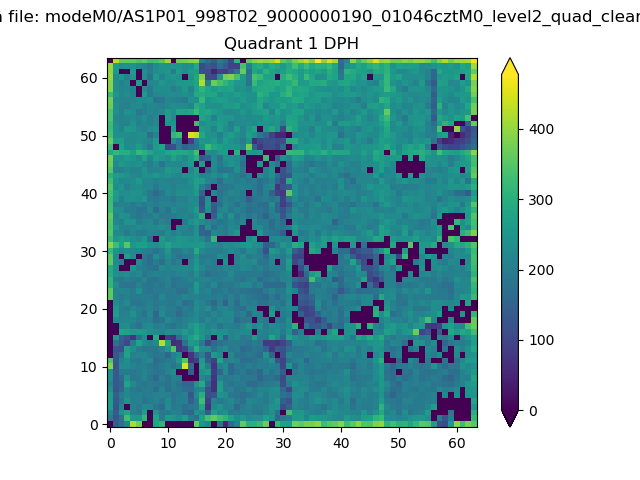 |
Quadrant B |
|---|---|---|---|
| Quadrant D | 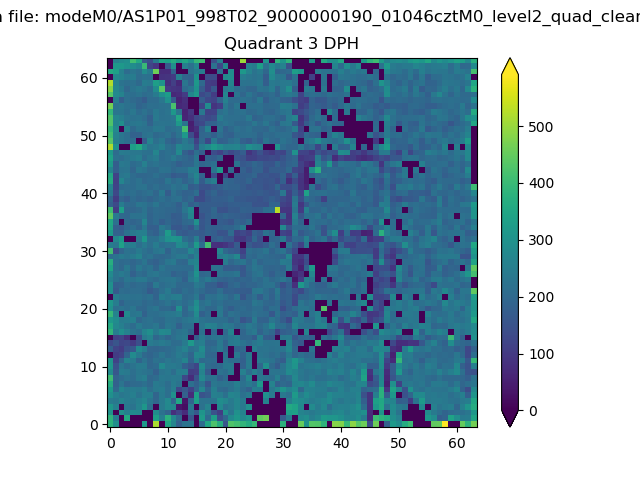 |
 |
Quadrant C |
| Plot type | Count rate plots | Images |
|---|---|---|
| Comparison with Poisson distribution Blue bars denote a histogram of data divided into 1 sec bins. Red curve is a Poisson curve with rate = median count rate of data. |
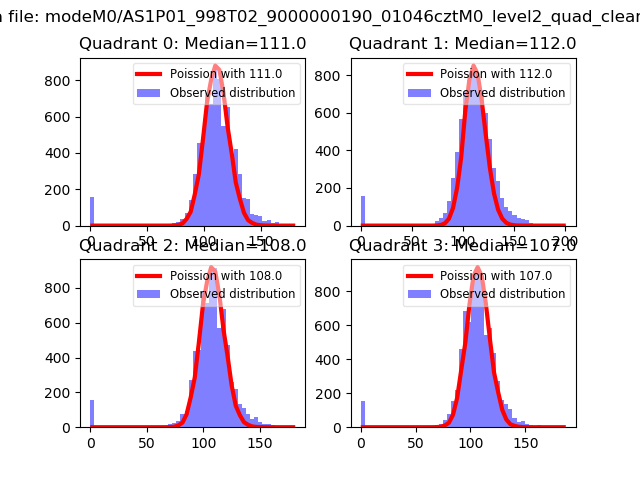 |
 |
| Quadrant-wise count rates Data is divided into 100 sec bins |
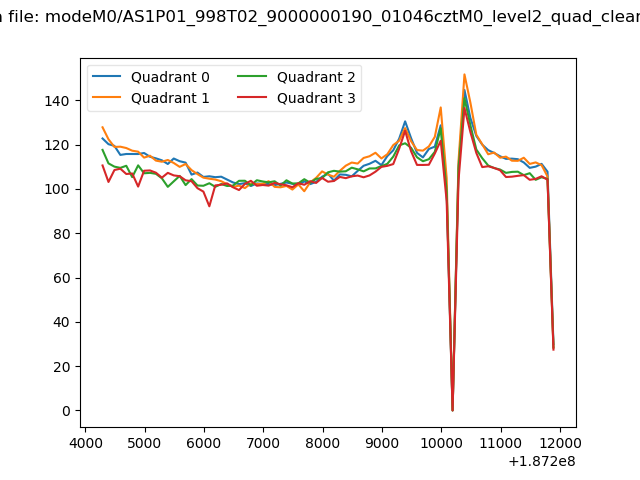 |
|
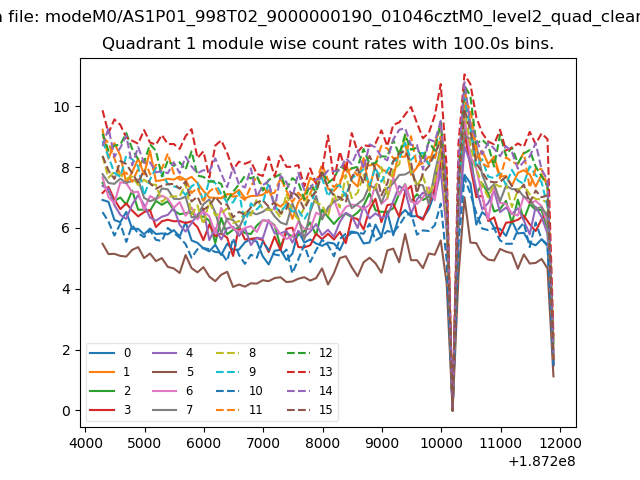
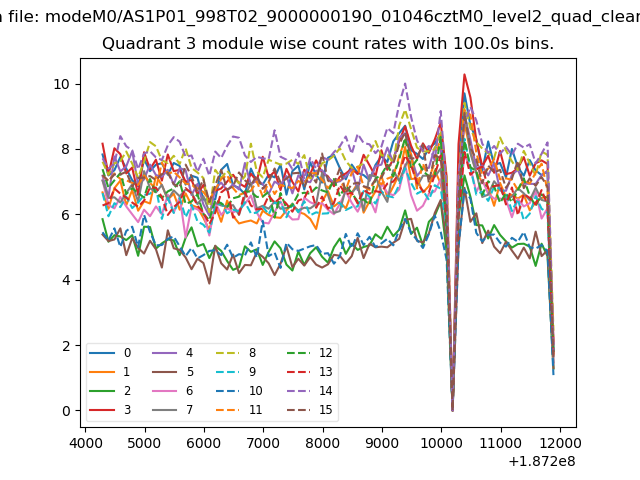
| Module-wise count rates for Quadrant A Data is divided into 100 sec bins |
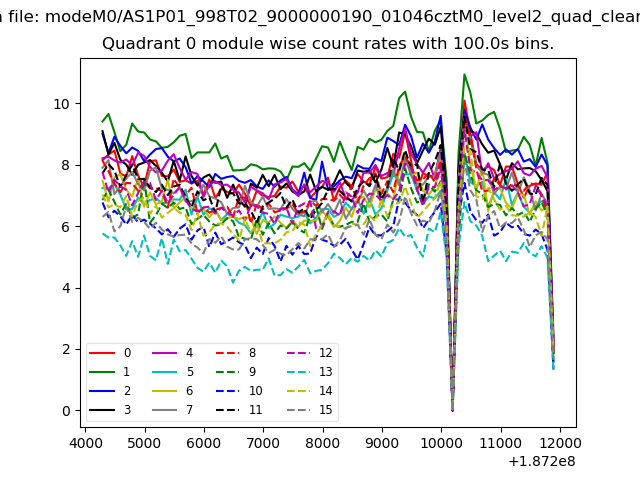 |
 |
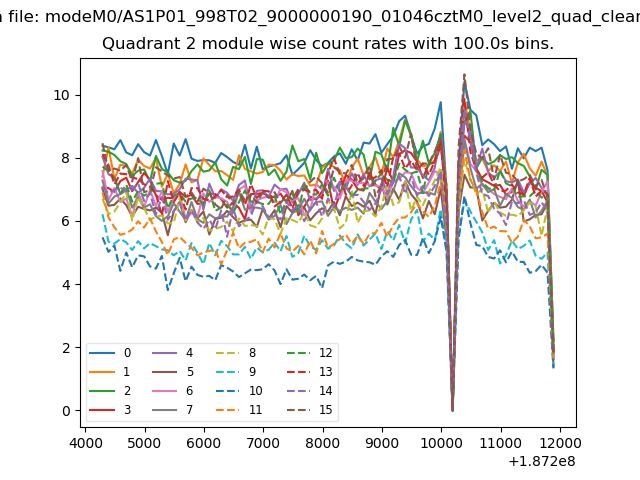
| Module-wise count rates for Quadrant B Data is divided into 100 sec bins |
 |
 |
| Module-wise count rates for Quadrant C Data is divided into 100 sec bins |
 |
 |
| Module-wise count rates for Quadrant D Data is divided into 100 sec bins |
 |
 |
| Parameter | Plot |
|---|---|
| CZT HV Monitor | 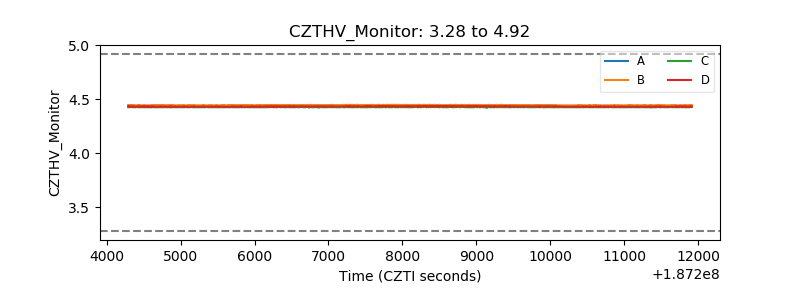 |
| D_VDD | 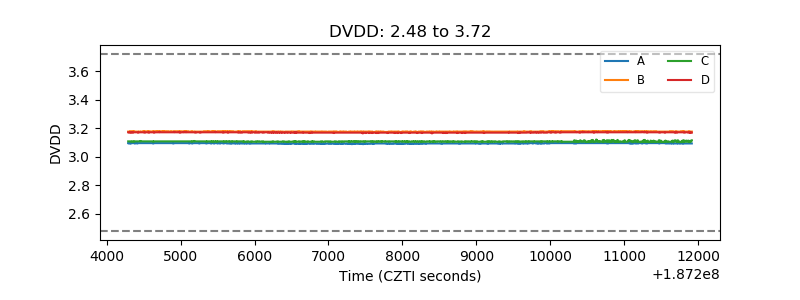 |
| Temperature 1 | 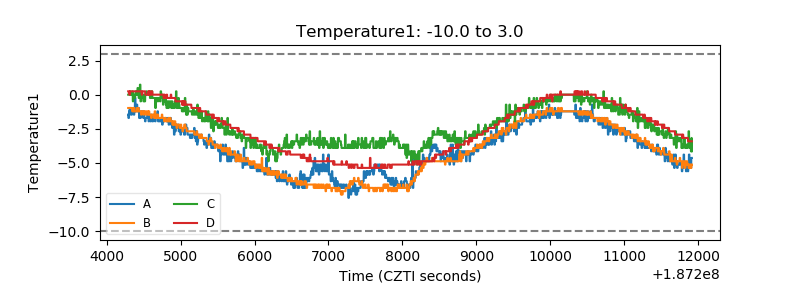 |
| Veto HV Monitor | 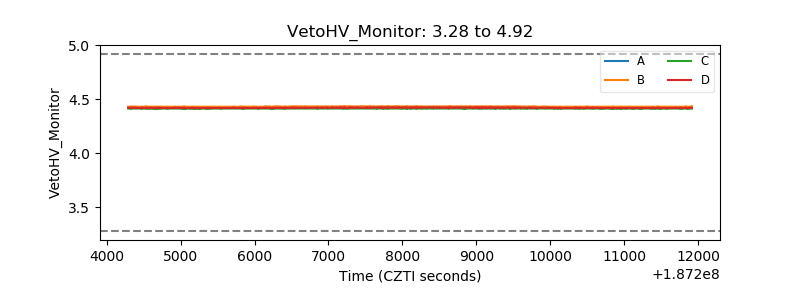 |
| Veto LLD | 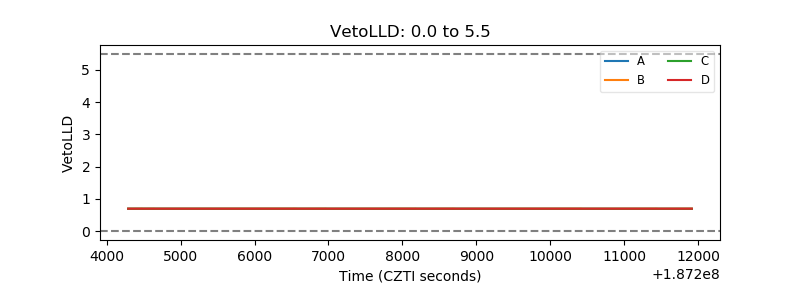 |
| Alpha Counter | 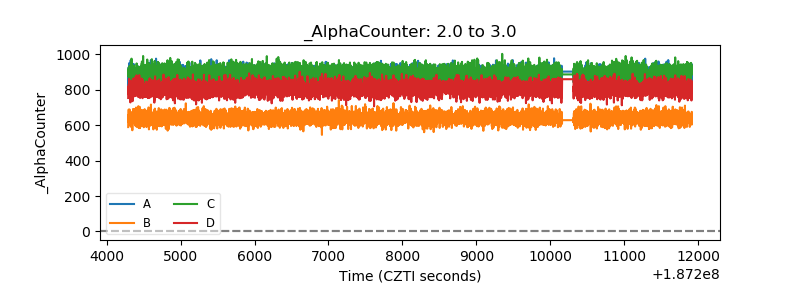 |
| _CPM_Rate | 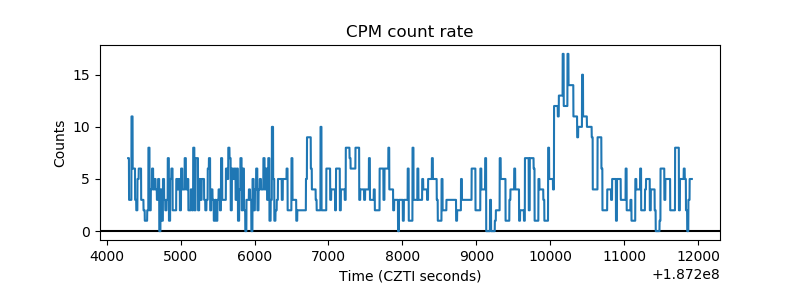 |
| CZT Counter | 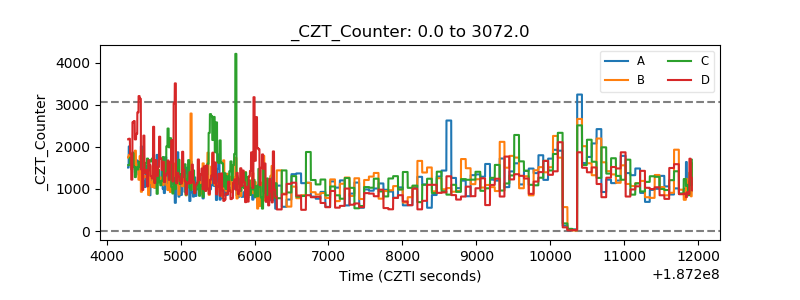 |
| +2.5 Volts monitor |  |
| +5 Volts monitor |  |
| _ROLL_ROT | 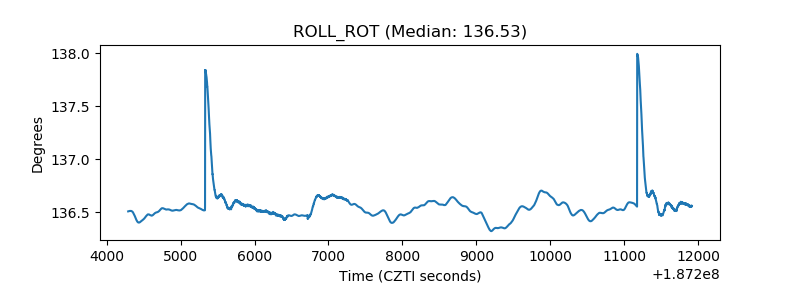 |
| _Roll_DEC | 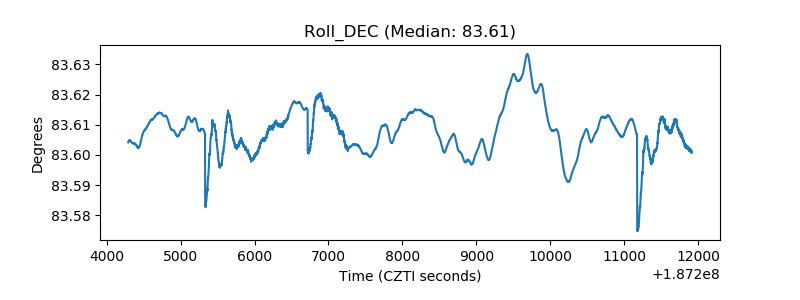 |
| _Roll_RA | 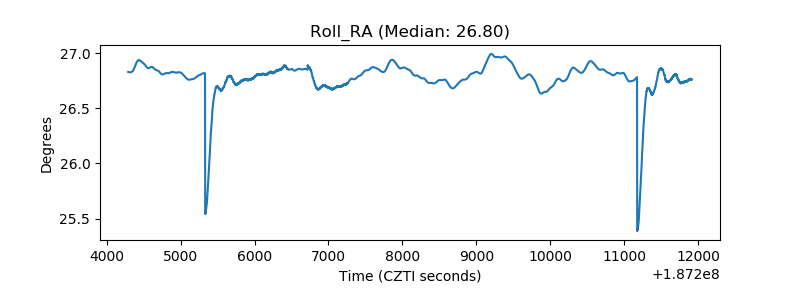 |
| Veto Counter | 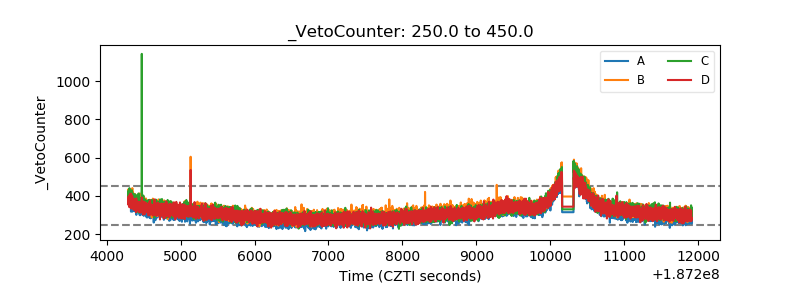 |