| Param | Original file | Final file |
|---|---|---|
| Filename | modeM0/AS1P01_998T02_9000000190_01047cztM0_level2.evt | modeM0/AS1P01_998T02_9000000190_01047cztM0_level2_quad_clean.evt |
| Size (bytes) | 1,276,727,040 | 123,171,840 |
| Size | 1.2 GB | 117.5 MB |
| Events in quadrant A | 8,708,049 | 832,617 |
| Events in quadrant B | 9,329,054 | 834,796 |
| Events in quadrant C | 9,148,989 | 809,827 |
| Events in quadrant D | 10,986,255 | 733,960 |
| Mode M0 | |||
|---|---|---|---|
| Quadrant | BADHDUFLAG | Total packets | Discarded packets |
| A | 0 | 31213 | 1 |
| B | 0 | 32998 | 1 |
| C | 0 | 32524 | 4 |
| D | 0 | 38074 | 1 |
| Mode SS | |||
|---|---|---|---|
| Quadrant | BADHDUFLAG | Total packets | Discarded packets |
| A | 0 | 152 | 0 |
| B | 0 | 152 | 0 |
| C | 0 | 152 | 0 |
| D | 0 | 152 | 0 |
| Mode M9 | |||
|---|---|---|---|
| Quadrant | BADHDUFLAG | Total packets | Discarded packets |
| A | 0 | 1 | 0 |
| B | 0 | 1 | 0 |
| C | 0 | 1 | 0 |
| D | 0 | 1 | 0 |
| Quadrant | Total seconds | Saturated seconds | Saturation percentage |
|---|---|---|---|
| A | 7455 | 6 | 0.080483% |
| B | 7456 | 53 | 0.710837% |
| C | 7455 | 58 | 0.778001% |
| D | 7455 | 913 | 12.246814% |
Noise dominated data is calculated using 1-second bins in cleaned event files. If a bin has >2000 counts, and if more than 50% of those come from <1% of pixels, then it is considered to be noise-dominated and hence unusable.
| Quadrant | # 1 sec bins | Bins with >0 counts | Bins with >2000 counts | High rate bins dominated by noise | Noise dominated (total time) | Noise dominated (detector-on time) | Marked lightcurve |
|---|---|---|---|---|---|---|---|
| A | 7585 | 7456 | 286 | 286 | 3.77% | 3.84% | 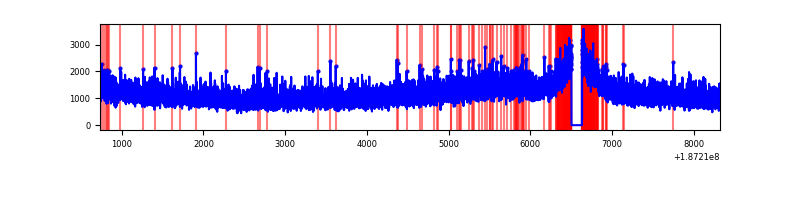 |
| B | 7586 | 7457 | 418 | 418 | 5.51% | 5.61% | 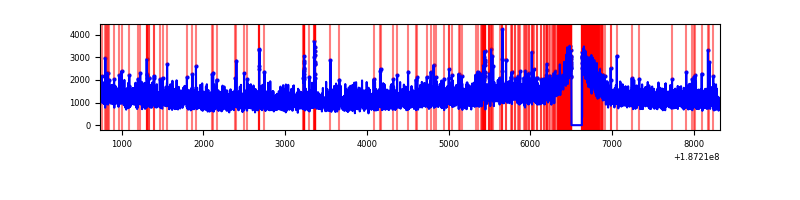 |
| C | 7585 | 7456 | 393 | 393 | 5.18% | 5.27% | 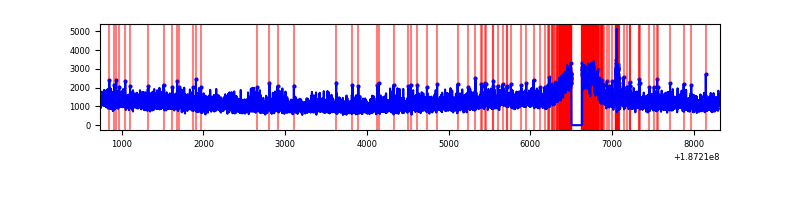 |
| D | 7585 | 7455 | 1268 | 1268 | 16.72% | 17.01% | 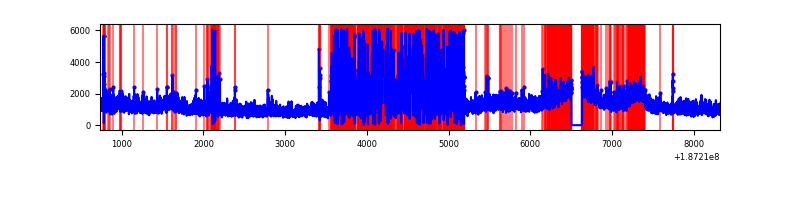 |
Top three noisy pixels from each quadrant. If the there are fewer than three noisy pixels in the level2.evt file, extra rows are filled as -1
| Pixel properties | Quadrant properties | ||||||
|---|---|---|---|---|---|---|---|
| Quadrant | DetID | PixID | Counts | Sigma | Mean | Median | Sigma |
| A | 11 | 79 | 8245 | 10.94 | 2268 | 2283 | 544.9 |
| A | 3 | 111 | 6999 | 8.65 | 2268 | 2283 | 544.9 |
| A | 15 | 233 | 6918 | 8.51 | 2268 | 2283 | 544.9 |
| B | 5 | 249 | 83375 | 144.82 | 2372 | 2381 | 559.3 |
| B | 8 | 234 | 64397 | 110.89 | 2372 | 2381 | 559.3 |
| B | 15 | 22 | 55641 | 95.23 | 2372 | 2381 | 559.3 |
| C | 15 | 241 | 358374 | 584.59 | 2180 | 2259 | 609.2 |
| C | 8 | 208 | 187918 | 304.77 | 2180 | 2259 | 609.2 |
| C | 3 | 79 | 41888 | 65.05 | 2180 | 2259 | 609.2 |
| D | 1 | 83 | 521949 | 888.11 | 2034 | 2095 | 585.3 |
| D | 10 | 125 | 166463 | 280.8 | 2034 | 2095 | 585.3 |
| D | 2 | 14 | 46979 | 76.68 | 2034 | 2095 | 585.3 |
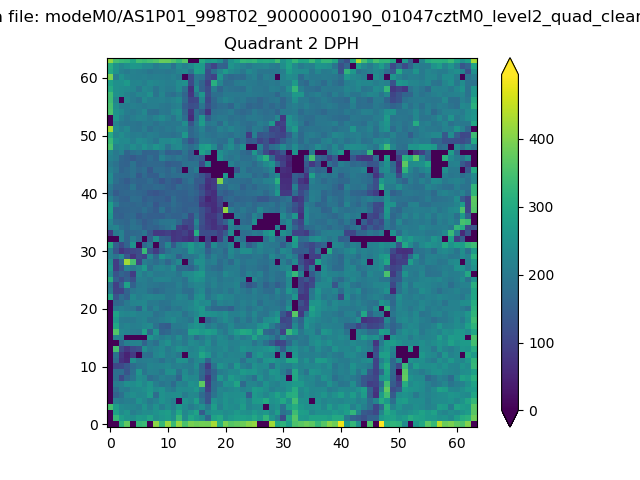
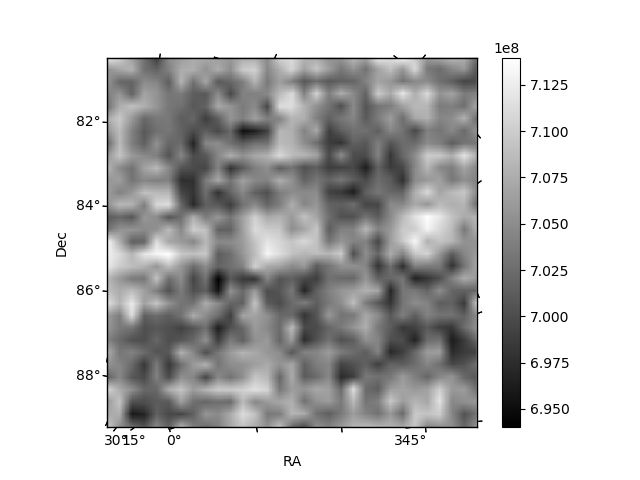
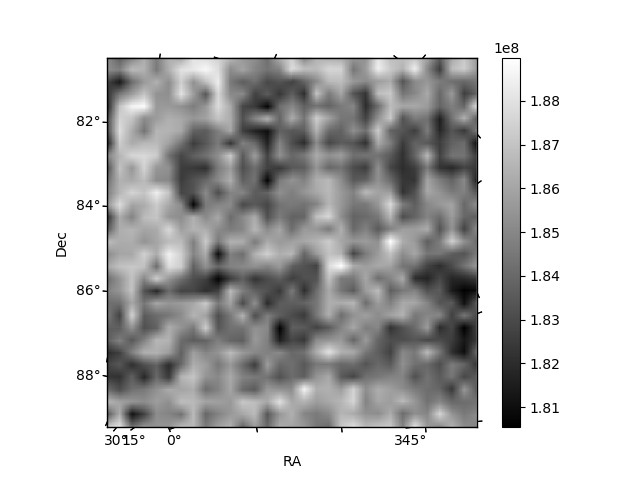
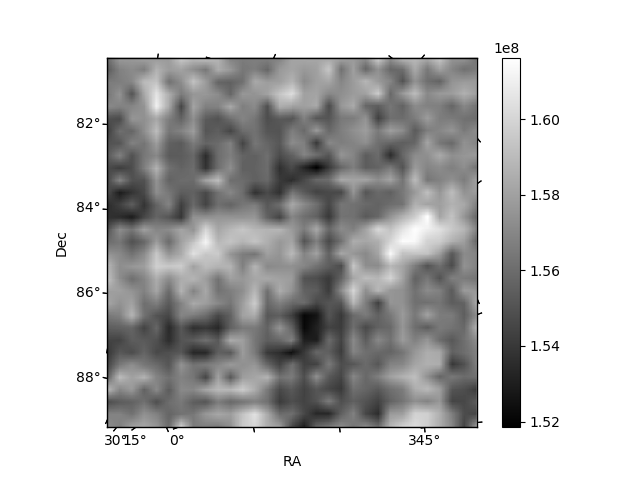
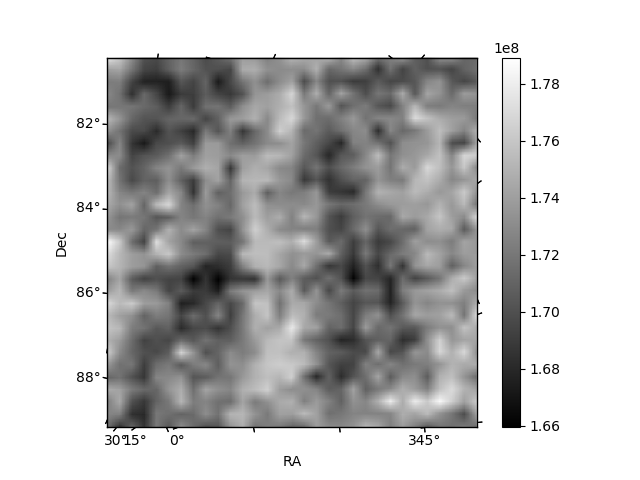
Histogram calculated using DETX and DETY for each event in the final _common_clean file
| Quadrant A | 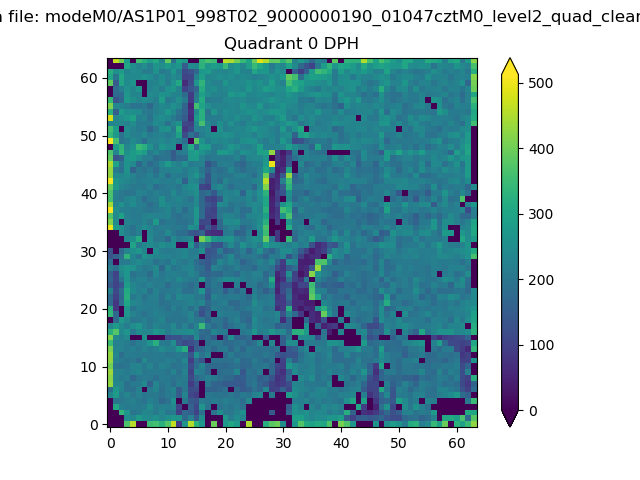 |
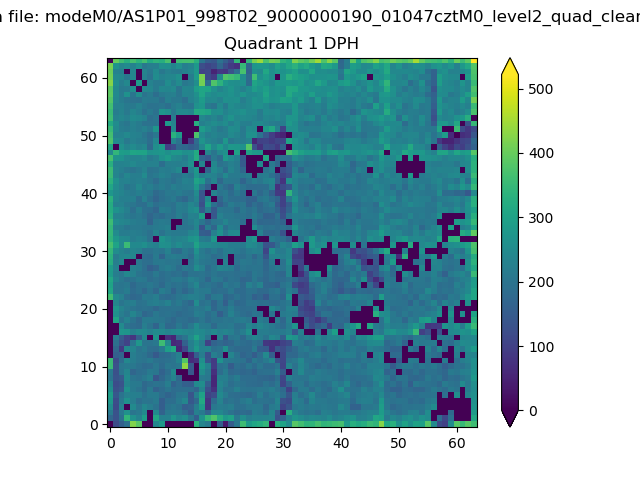 |
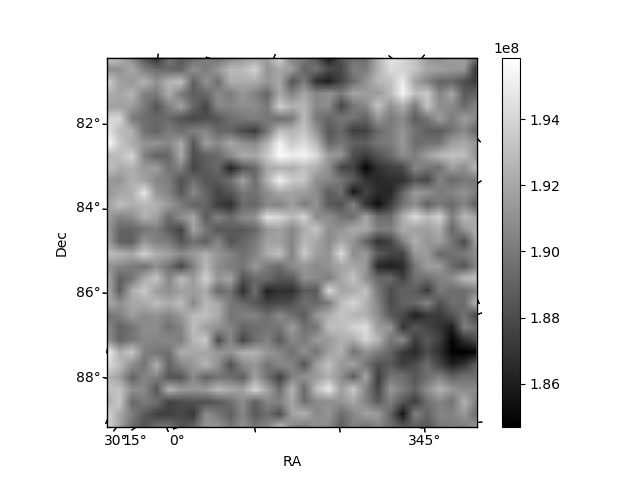
Quadrant B |
|---|---|---|---|
| Quadrant D | 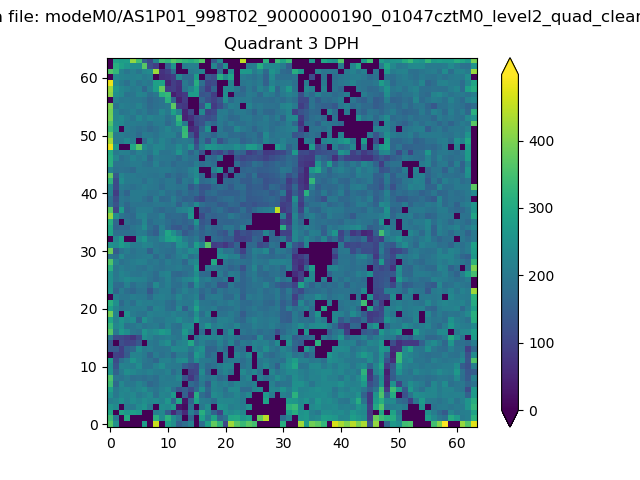 |
 |
Quadrant C |
| Plot type | Count rate plots | Images |
|---|---|---|
| Comparison with Poisson distribution Blue bars denote a histogram of data divided into 1 sec bins. Red curve is a Poisson curve with rate = median count rate of data. |
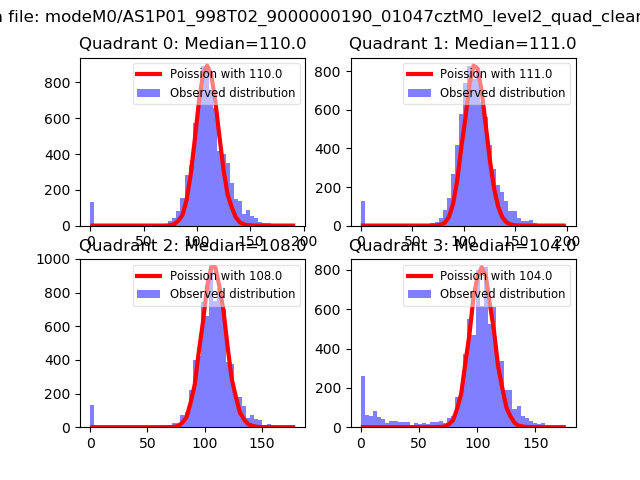 |
 |
| Quadrant-wise count rates Data is divided into 100 sec bins |
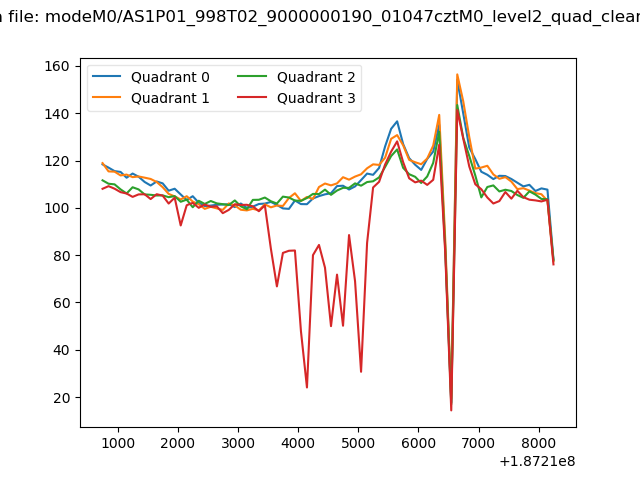 |
|
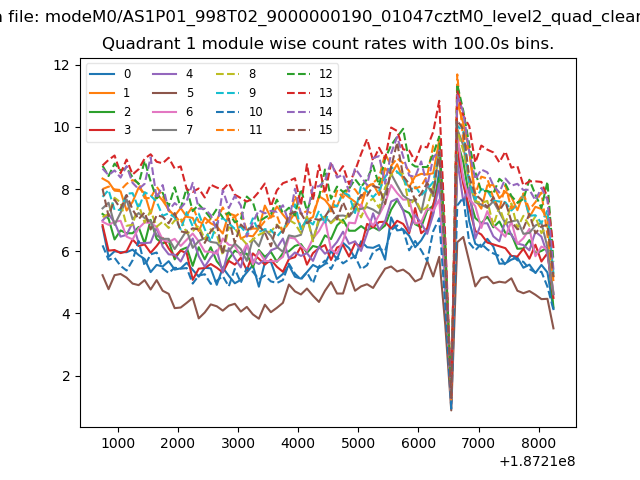
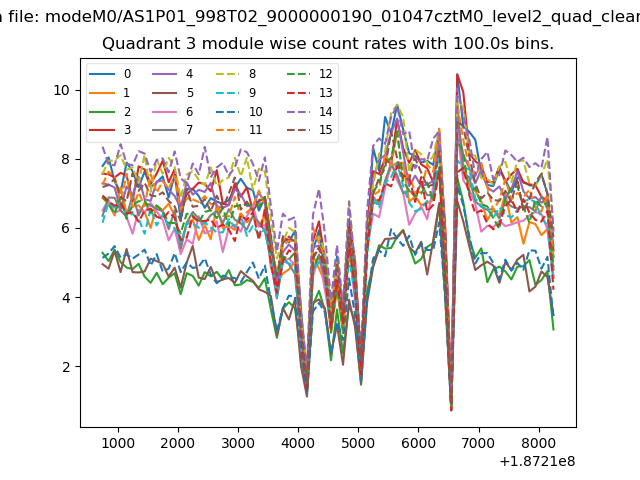
| Module-wise count rates for Quadrant A Data is divided into 100 sec bins |
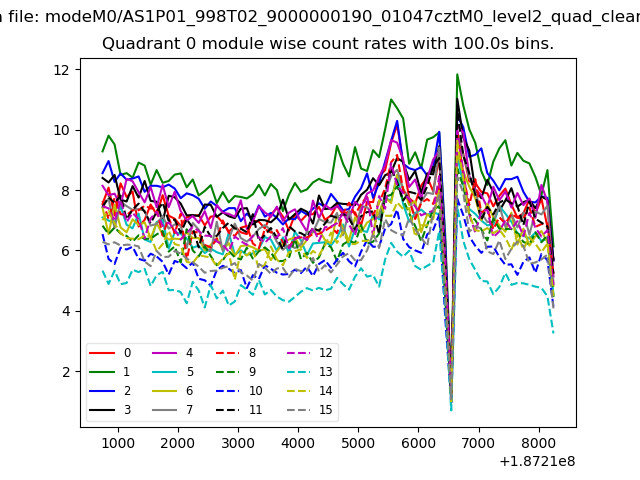 |
 |
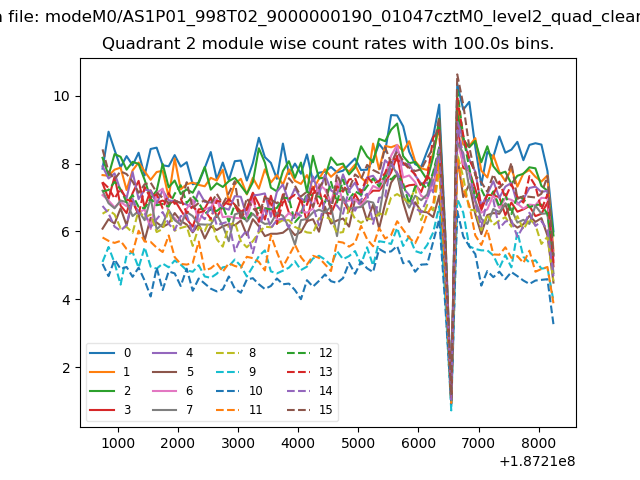
| Module-wise count rates for Quadrant B Data is divided into 100 sec bins |
 |
 |
| Module-wise count rates for Quadrant C Data is divided into 100 sec bins |
 |
 |
| Module-wise count rates for Quadrant D Data is divided into 100 sec bins |
 |
 |
| Parameter | Plot |
|---|---|
| CZT HV Monitor | 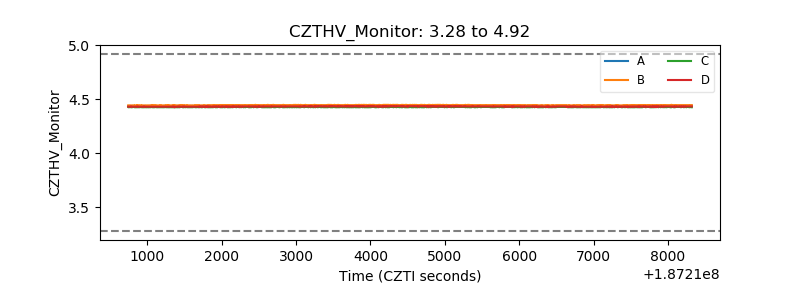 |
| D_VDD | 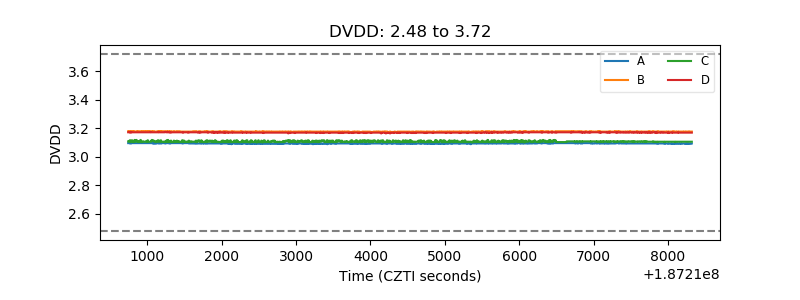 |
| Temperature 1 | 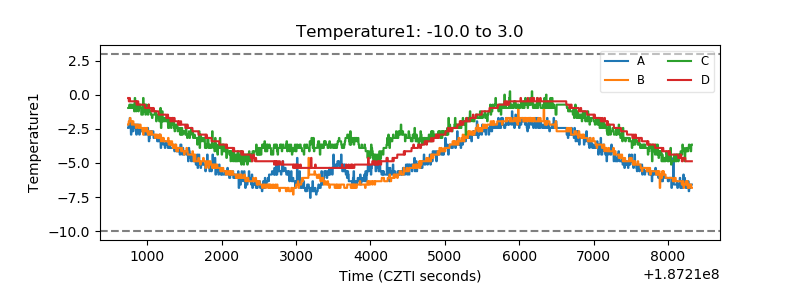 |
| Veto HV Monitor |  |
| Veto LLD |  |
| Alpha Counter | 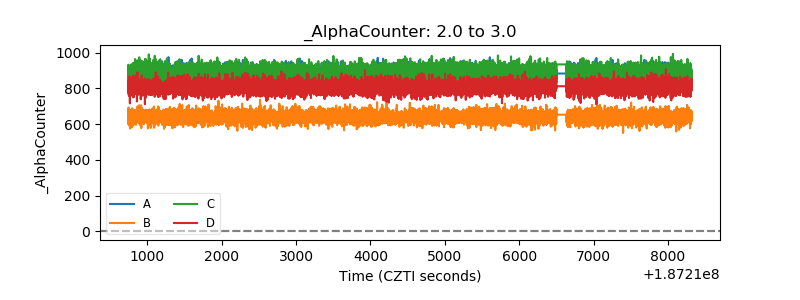 |
| _CPM_Rate | 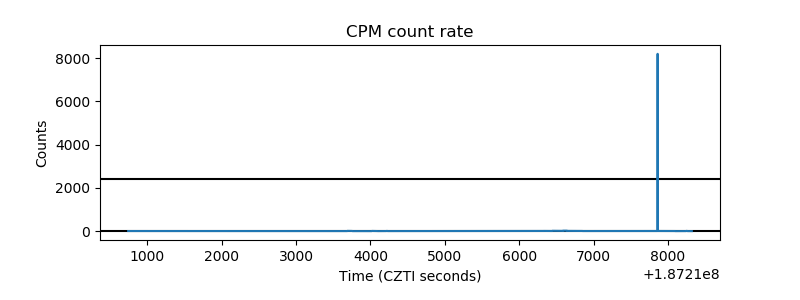 |
| CZT Counter |  |
| +2.5 Volts monitor |  |
| +5 Volts monitor |  |
| _ROLL_ROT | 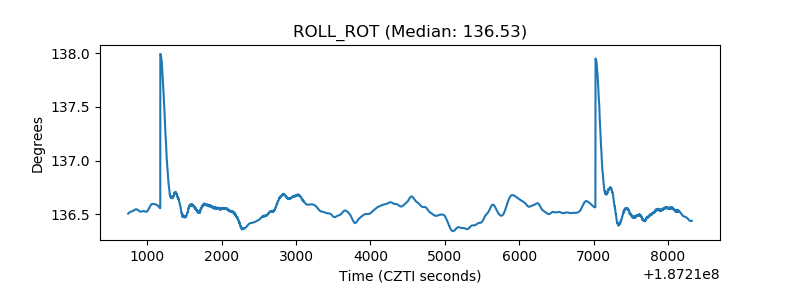 |
| _Roll_DEC | 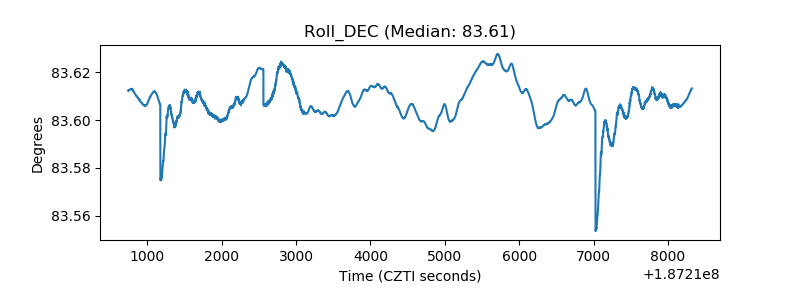 |
| _Roll_RA | 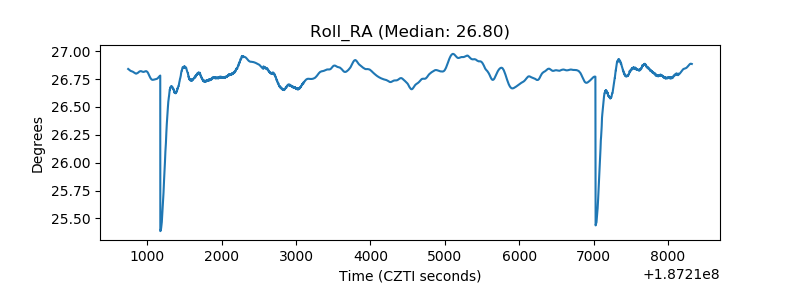 |
| Veto Counter | 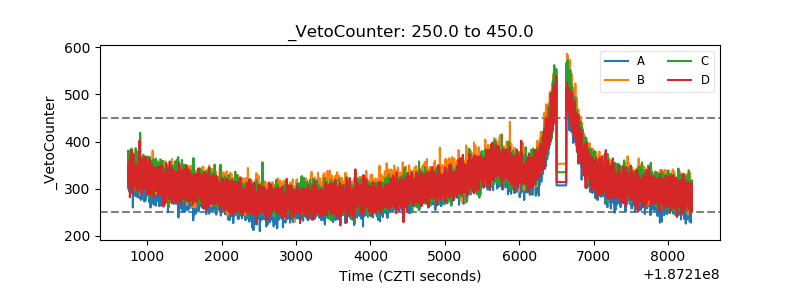 |