| Param | Original file | Final file |
|---|---|---|
| Filename | modeM0/AS1P01_998T02_9000000190_01048cztM0_level2.evt | modeM0/AS1P01_998T02_9000000190_01048cztM0_level2_quad_clean.evt |
| Size (bytes) | 1,239,655,680 | 127,984,320 |
| Size | 1.2 GB | 122.1 MB |
| Events in quadrant A | 8,936,394 | 849,050 |
| Events in quadrant B | 9,679,699 | 851,553 |
| Events in quadrant C | 9,571,504 | 828,082 |
| Events in quadrant D | 8,851,450 | 818,038 |
| Mode M0 | |||
|---|---|---|---|
| Quadrant | BADHDUFLAG | Total packets | Discarded packets |
| A | 0 | 31970 | 2 |
| B | 0 | 34155 | 2 |
| C | 0 | 33862 | 3 |
| D | 0 | 31728 | 2 |
| Mode SS | |||
|---|---|---|---|
| Quadrant | BADHDUFLAG | Total packets | Discarded packets |
| A | 0 | 156 | 0 |
| B | 0 | 156 | 0 |
| C | 0 | 156 | 0 |
| D | 0 | 156 | 0 |
| Mode M9 | |||
|---|---|---|---|
| Quadrant | BADHDUFLAG | Total packets | Discarded packets |
| A | 0 | 6 | 0 |
| B | 0 | 6 | 0 |
| C | 0 | 6 | 0 |
| D | 0 | 6 | 0 |
| Quadrant | Total seconds | Saturated seconds | Saturation percentage |
|---|---|---|---|
| A | 7616 | 6 | 0.078782% |
| B | 7616 | 86 | 1.129202% |
| C | 7615 | 63 | 0.827315% |
| D | 7615 | 26 | 0.341431% |
Noise dominated data is calculated using 1-second bins in cleaned event files. If a bin has >2000 counts, and if more than 50% of those come from <1% of pixels, then it is considered to be noise-dominated and hence unusable.
| Quadrant | # 1 sec bins | Bins with >0 counts | Bins with >2000 counts | High rate bins dominated by noise | Noise dominated (total time) | Noise dominated (detector-on time) | Marked lightcurve |
|---|---|---|---|---|---|---|---|
| A | 8196 | 7618 | 295 | 295 | 3.60% | 3.87% | 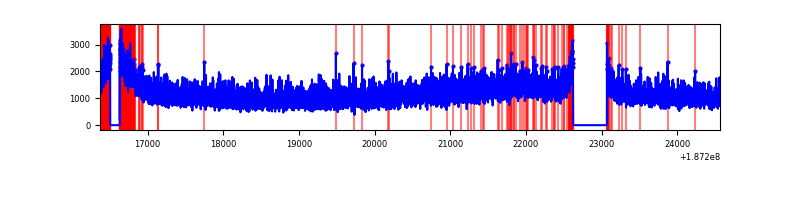 |
| B | 8196 | 7618 | 541 | 541 | 6.60% | 7.10% | 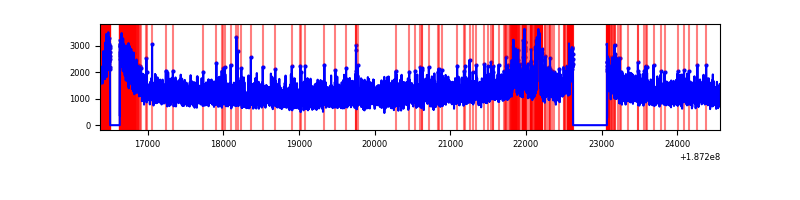 |
| C | 8195 | 7617 | 522 | 522 | 6.37% | 6.85% | 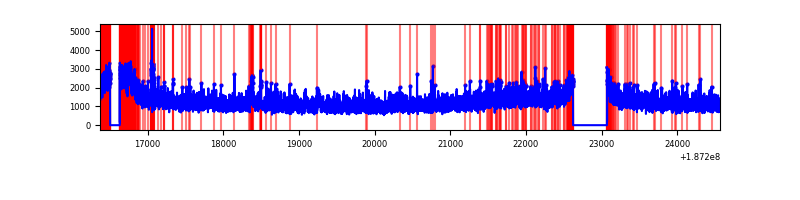 |
| D | 8195 | 7617 | 390 | 390 | 4.76% | 5.12% | 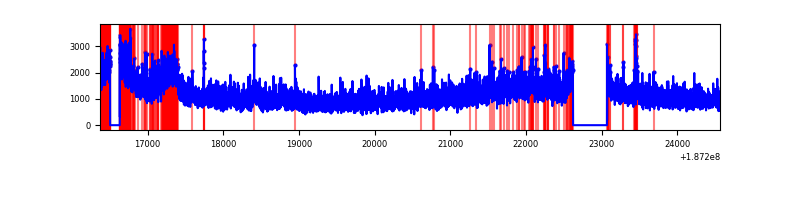 |
Top three noisy pixels from each quadrant. If the there are fewer than three noisy pixels in the level2.evt file, extra rows are filled as -1
| Pixel properties | Quadrant properties | ||||||
|---|---|---|---|---|---|---|---|
| Quadrant | DetID | PixID | Counts | Sigma | Mean | Median | Sigma |
| A | 11 | 79 | 8276 | 10.56 | 2327 | 2343 | 561.9 |
| A | 3 | 111 | 7263 | 8.76 | 2327 | 2343 | 561.9 |
| A | 13 | 9 | 6965 | 8.23 | 2327 | 2343 | 561.9 |
| B | 15 | 22 | 226196 | 388.41 | 2448 | 2456 | 576.0 |
| B | 8 | 234 | 45228 | 74.25 | 2448 | 2456 | 576.0 |
| B | 5 | 249 | 36817 | 59.65 | 2448 | 2456 | 576.0 |
| C | 15 | 241 | 362633 | 572.95 | 2254 | 2337 | 628.8 |
| C | 8 | 208 | 317420 | 501.05 | 2254 | 2337 | 628.8 |
| C | 3 | 111 | 32568 | 48.07 | 2254 | 2337 | 628.8 |
| D | 1 | 83 | 528277 | 787.8 | 2165 | 2243 | 667.7 |
| D | 10 | 125 | 97602 | 142.81 | 2165 | 2243 | 667.7 |
| D | 10 | 85 | 42723 | 60.62 | 2165 | 2243 | 667.7 |
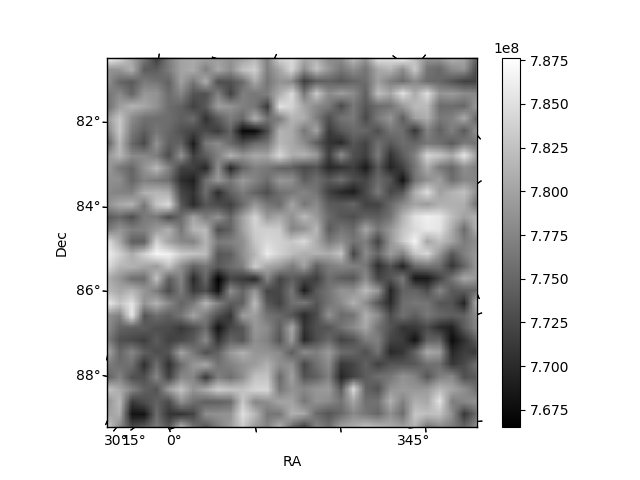
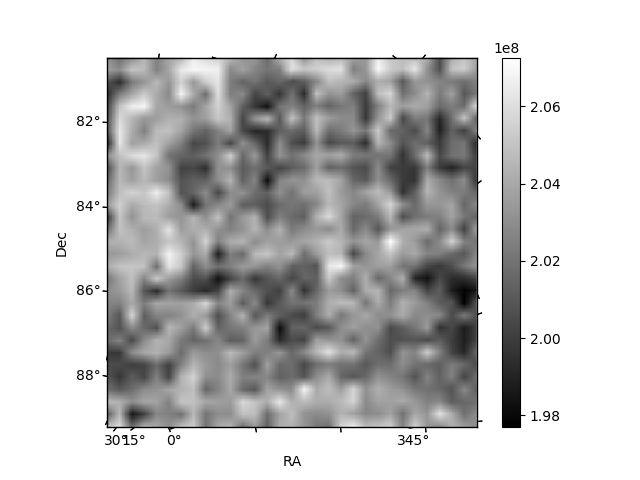
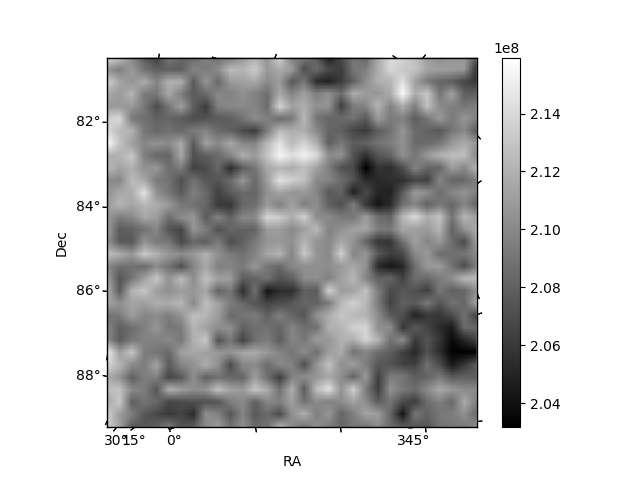
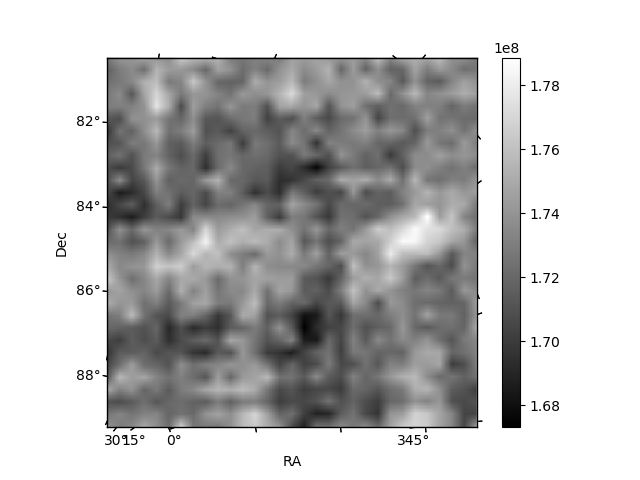
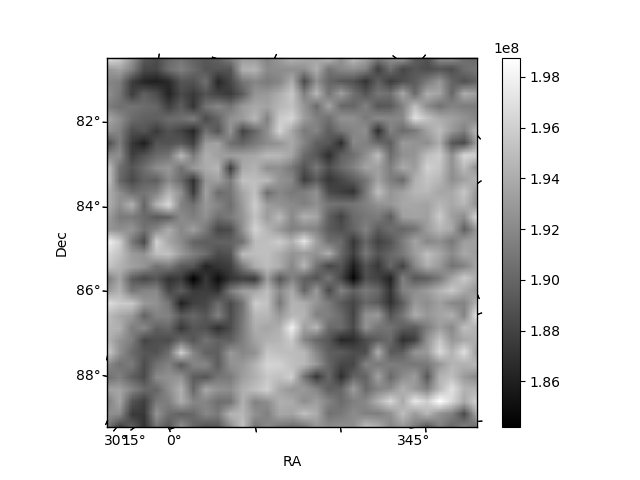
Histogram calculated using DETX and DETY for each event in the final _common_clean file
| Quadrant A | 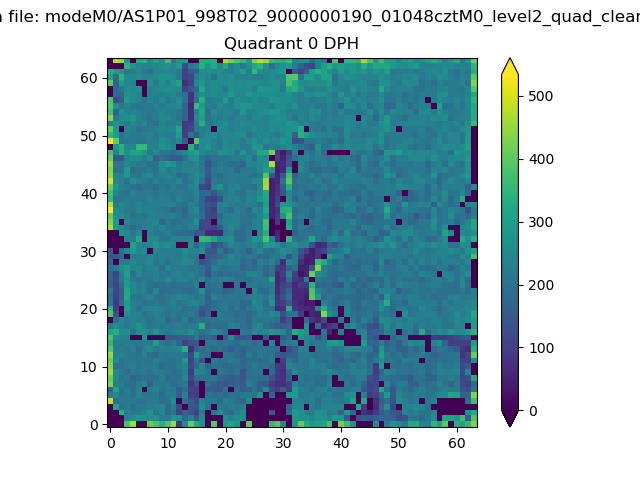 |
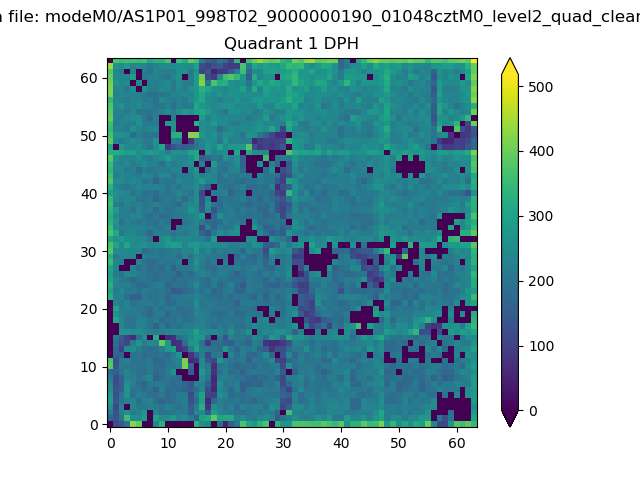 |
Quadrant B |
|---|---|---|---|
| Quadrant D | 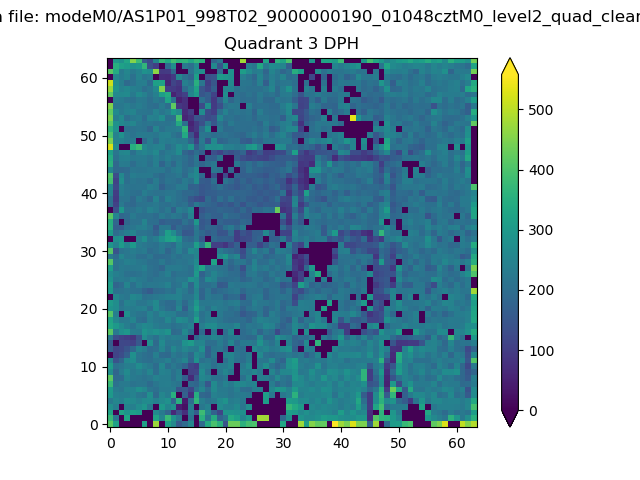 |
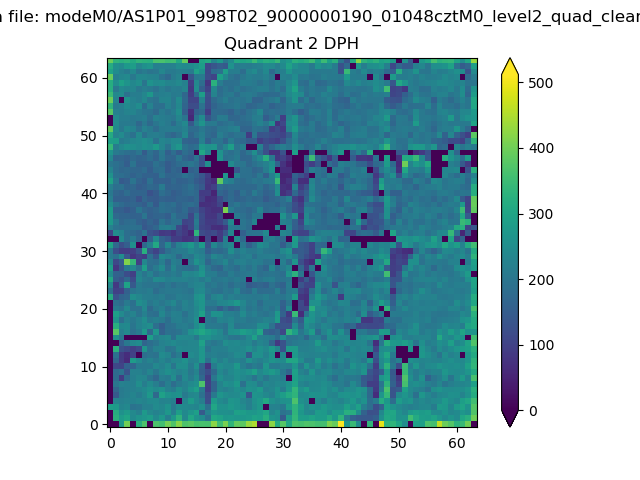 |
Quadrant C |
| Plot type | Count rate plots | Images |
|---|---|---|
| Comparison with Poisson distribution Blue bars denote a histogram of data divided into 1 sec bins. Red curve is a Poisson curve with rate = median count rate of data. |
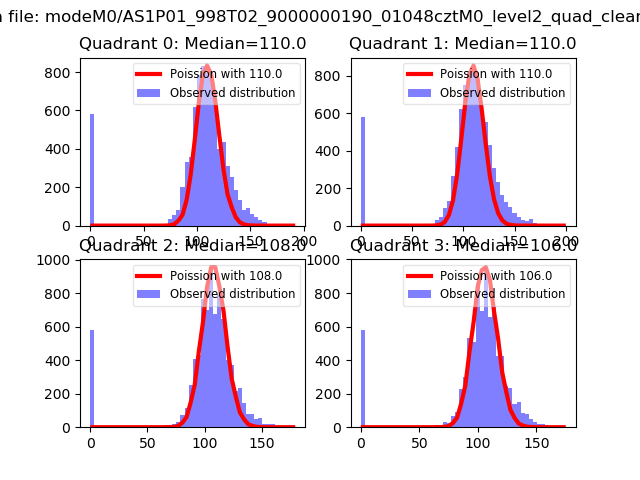 |
 |
| Quadrant-wise count rates Data is divided into 100 sec bins |
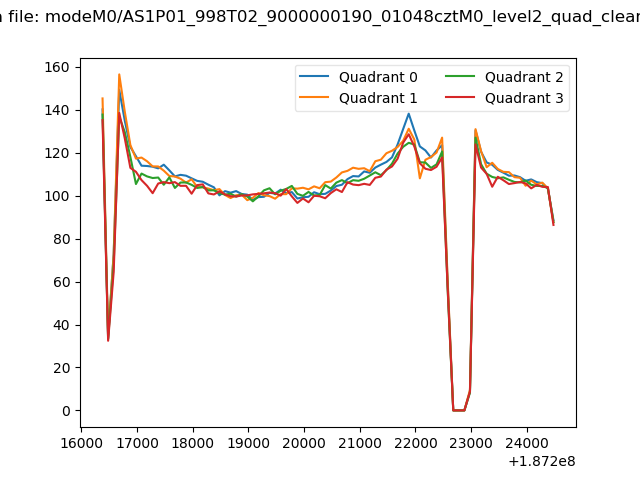 |
|
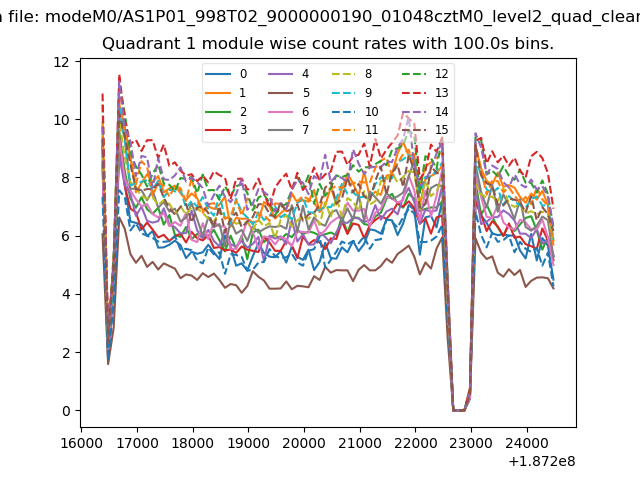
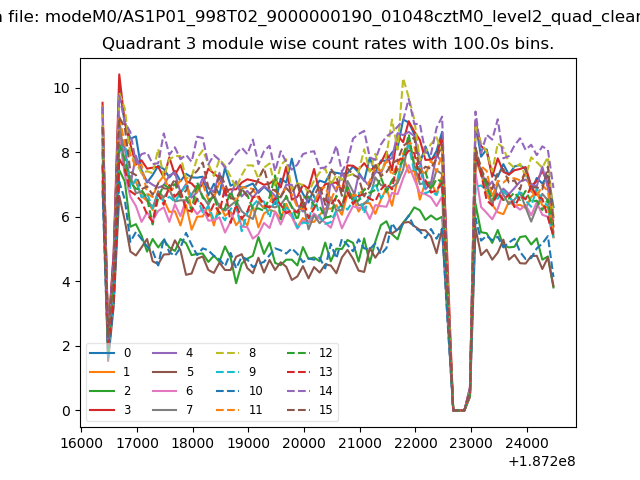
| Module-wise count rates for Quadrant A Data is divided into 100 sec bins |
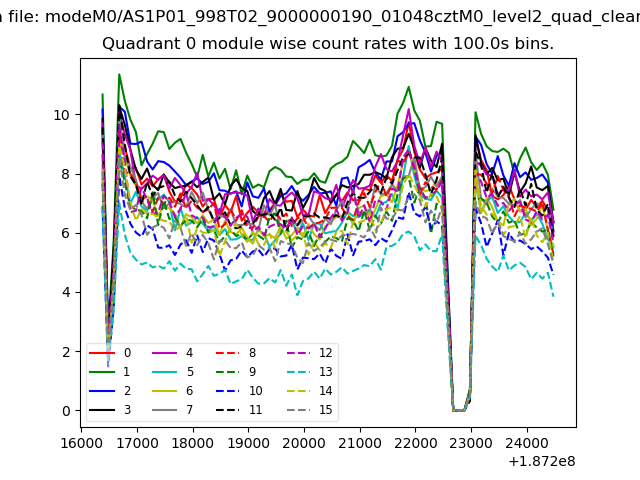 |
 |
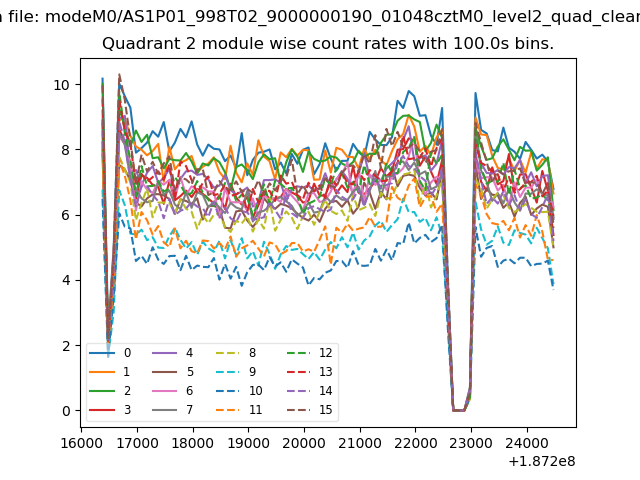
| Module-wise count rates for Quadrant B Data is divided into 100 sec bins |
 |
 |
| Module-wise count rates for Quadrant C Data is divided into 100 sec bins |
 |
 |
| Module-wise count rates for Quadrant D Data is divided into 100 sec bins |
 |
 |
| Parameter | Plot |
|---|---|
| CZT HV Monitor | 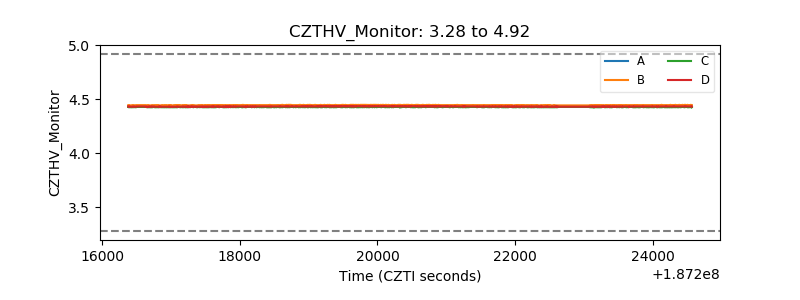 |
| D_VDD | 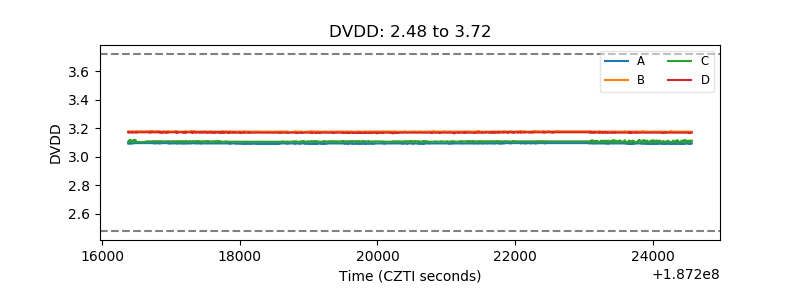 |
| Temperature 1 | 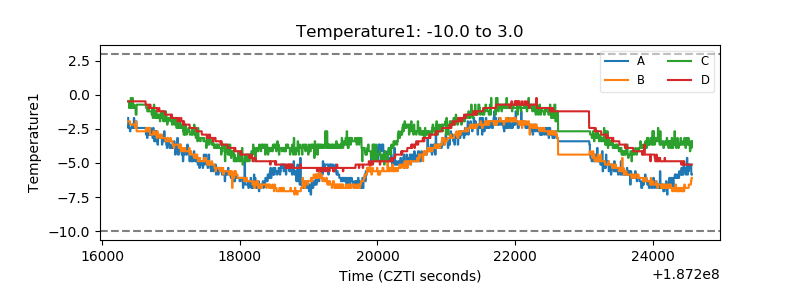 |
| Veto HV Monitor | 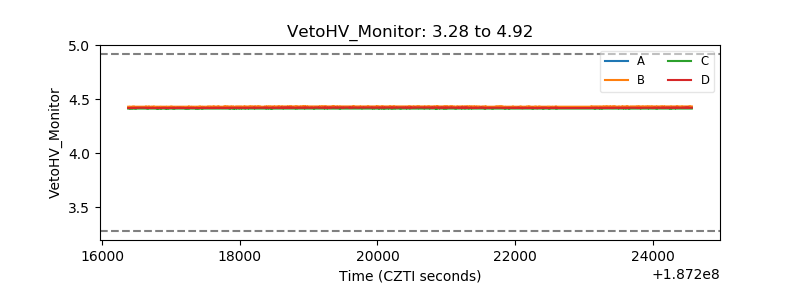 |
| Veto LLD | 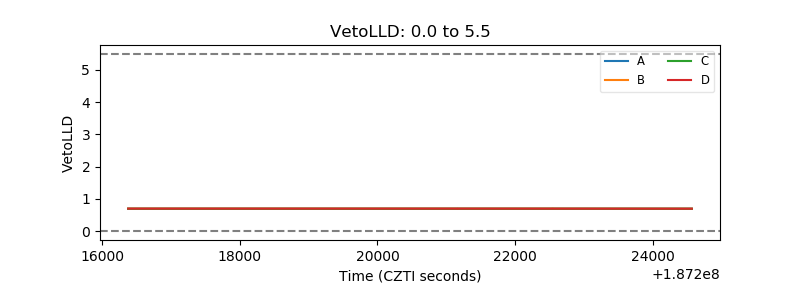 |
| Alpha Counter | 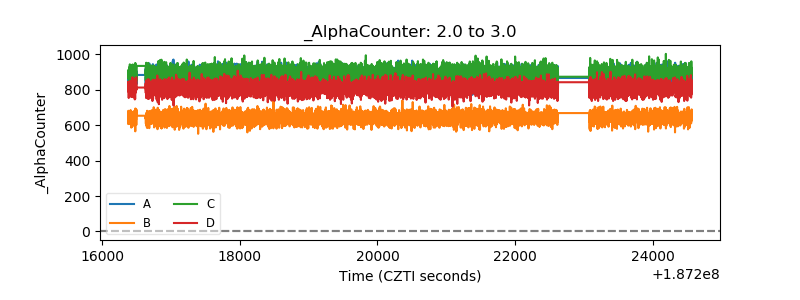 |
| _CPM_Rate | 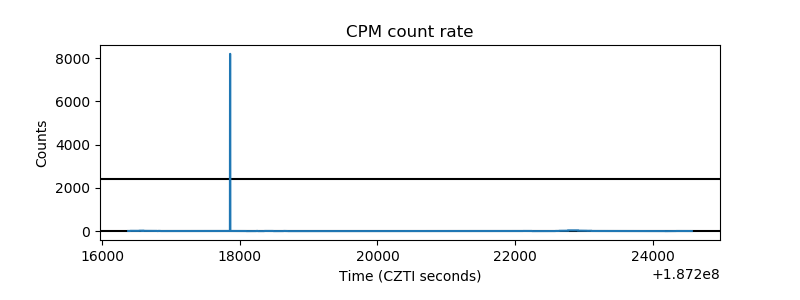 |
| CZT Counter | 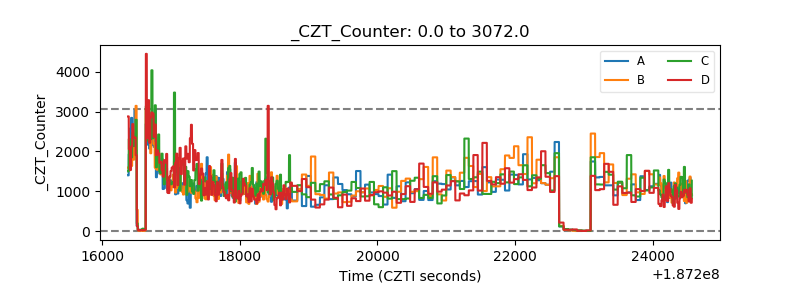 |
| +2.5 Volts monitor |  |
| +5 Volts monitor | 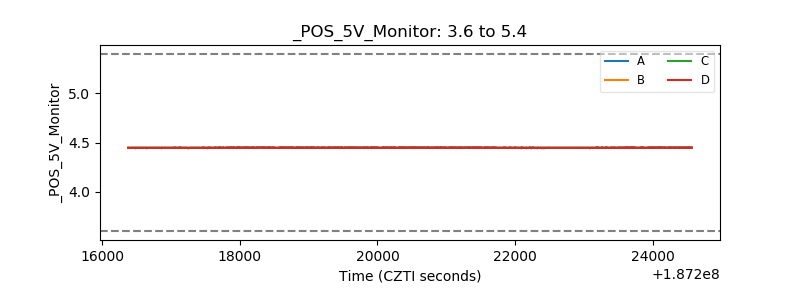 |
| _ROLL_ROT | 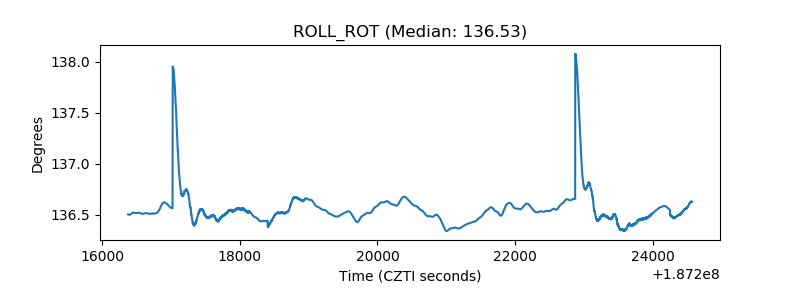 |
| _Roll_DEC | 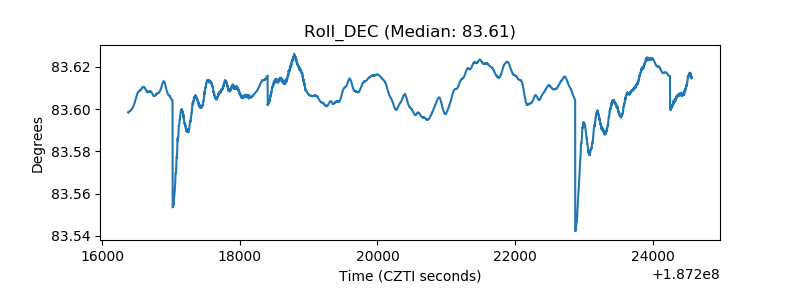 |
| _Roll_RA | 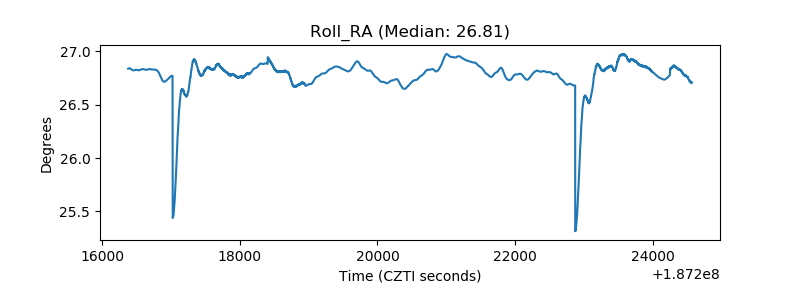 |
| Veto Counter | 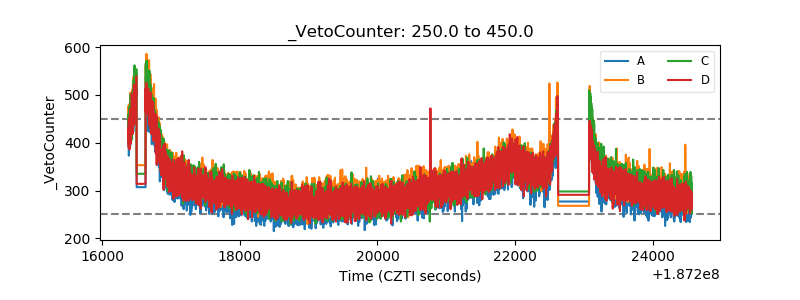 |