| Param | Original file | Final file |
|---|---|---|
| Filename | modeM0/AS1P01_998T02_9000000190_01051cztM0_level2.evt | modeM0/AS1P01_998T02_9000000190_01051cztM0_level2_quad_clean.evt |
| Size (bytes) | 1,095,793,920 | 112,769,280 |
| Size | 1.0 GB | 107.5 MB |
| Events in quadrant A | 7,802,192 | 747,080 |
| Events in quadrant B | 8,297,762 | 752,326 |
| Events in quadrant C | 7,839,349 | 735,782 |
| Events in quadrant D | 8,798,238 | 708,460 |
| Mode M0 | |||
|---|---|---|---|
| Quadrant | BADHDUFLAG | Total packets | Discarded packets |
| A | 0 | 27971 | 2 |
| B | 0 | 29493 | 1 |
| C | 0 | 28114 | 1 |
| D | 0 | 30999 | 1 |
| Mode SS | |||
|---|---|---|---|
| Quadrant | BADHDUFLAG | Total packets | Discarded packets |
| A | 0 | 136 | 0 |
| B | 0 | 136 | 0 |
| C | 0 | 136 | 0 |
| D | 0 | 136 | 0 |
| Mode M9 | |||
|---|---|---|---|
| Quadrant | BADHDUFLAG | Total packets | Discarded packets |
| A | 0 | 9 | 0 |
| B | 0 | 9 | 0 |
| C | 0 | 9 | 0 |
| D | 0 | 9 | 0 |
| Quadrant | Total seconds | Saturated seconds | Saturation percentage |
|---|---|---|---|
| A | 6773 | 9 | 0.132881% |
| B | 6773 | 18 | 0.265761% |
| C | 6773 | 7 | 0.103352% |
| D | 6773 | 247 | 3.646833% |
Noise dominated data is calculated using 1-second bins in cleaned event files. If a bin has >2000 counts, and if more than 50% of those come from <1% of pixels, then it is considered to be noise-dominated and hence unusable.
| Quadrant | # 1 sec bins | Bins with >0 counts | Bins with >2000 counts | High rate bins dominated by noise | Noise dominated (total time) | Noise dominated (detector-on time) | Marked lightcurve |
|---|---|---|---|---|---|---|---|
| A | 7648 | 6774 | 119 | 119 | 1.56% | 1.76% | 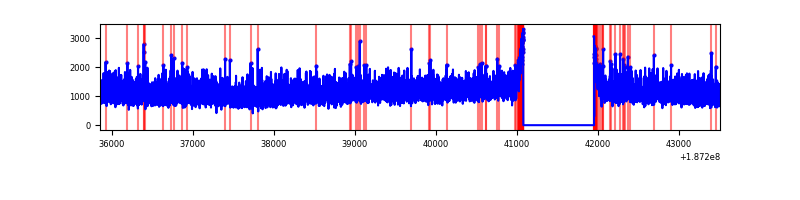 |
| B | 7648 | 6774 | 200 | 200 | 2.62% | 2.95% | 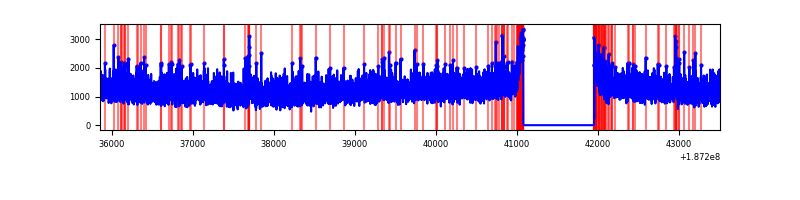 |
| C | 7648 | 6774 | 127 | 127 | 1.66% | 1.87% | 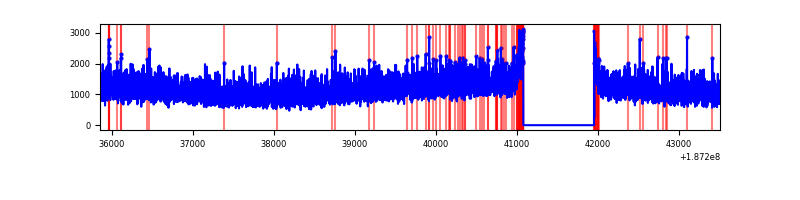 |
| D | 7648 | 6774 | 756 | 756 | 9.88% | 11.16% | 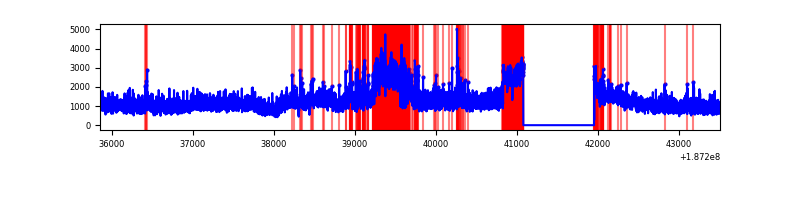 |
Top three noisy pixels from each quadrant. If the there are fewer than three noisy pixels in the level2.evt file, extra rows are filled as -1
| Pixel properties | Quadrant properties | ||||||
|---|---|---|---|---|---|---|---|
| Quadrant | DetID | PixID | Counts | Sigma | Mean | Median | Sigma |
| A | 0 | 36 | 25079 | 47.05 | 2027 | 2038 | 489.7 |
| A | 11 | 79 | 7324 | 10.8 | 2027 | 2038 | 489.7 |
| A | 3 | 111 | 6432 | 8.97 | 2027 | 2038 | 489.7 |
| B | 8 | 234 | 80481 | 155.51 | 2123 | 2132 | 503.8 |
| B | 15 | 22 | 41225 | 77.59 | 2123 | 2132 | 503.8 |
| B | 12 | 52 | 40041 | 75.24 | 2123 | 2132 | 503.8 |
| C | 15 | 241 | 328301 | 616.56 | 1901 | 1963 | 529.3 |
| C | 10 | 207 | 31773 | 56.32 | 1901 | 1963 | 529.3 |
| C | 3 | 111 | 25808 | 45.05 | 1901 | 1963 | 529.3 |
| D | 12 | 22 | 1284221 | 2289.04 | 1815 | 1874 | 560.2 |
| D | 1 | 83 | 596476 | 1061.39 | 1815 | 1874 | 560.2 |
| D | 10 | 125 | 42829 | 73.11 | 1815 | 1874 | 560.2 |
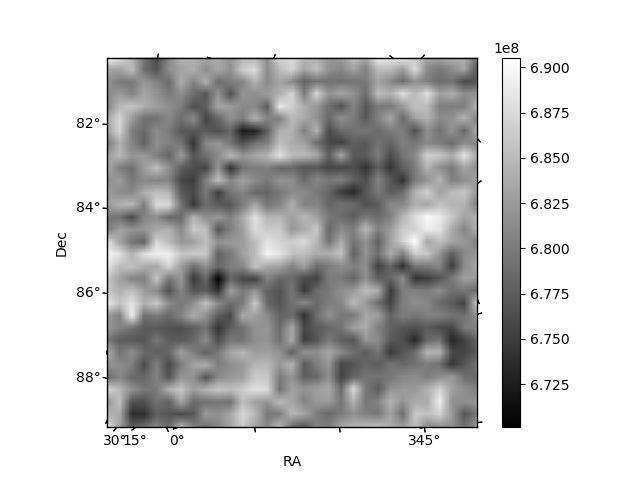
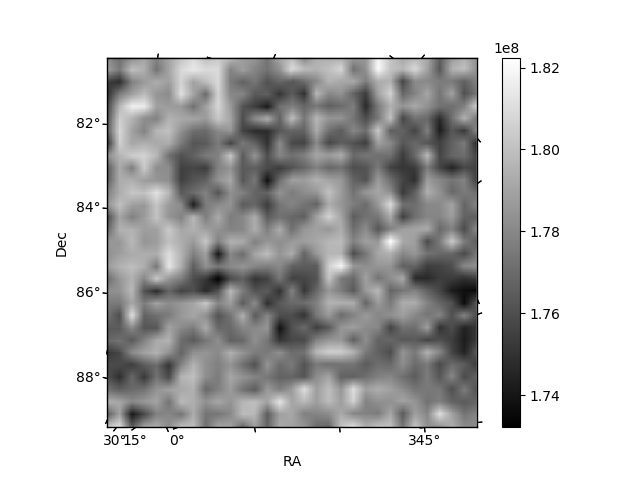
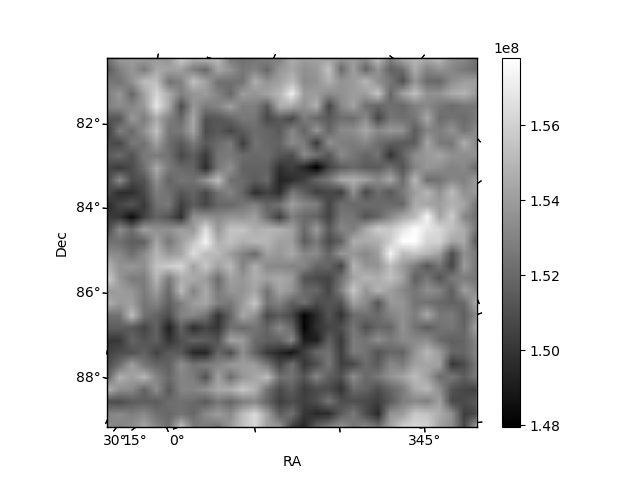
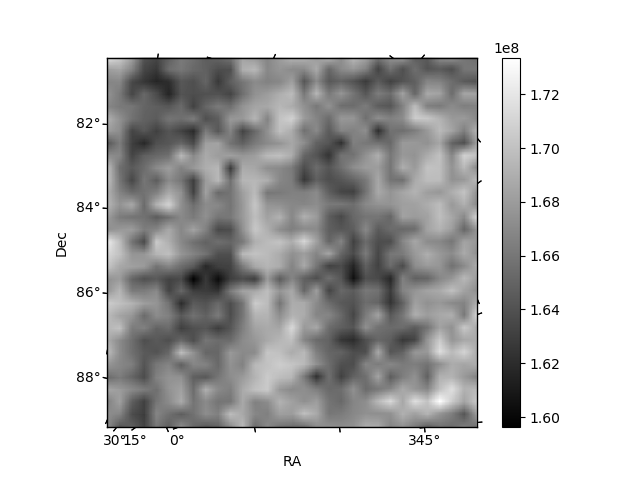
Histogram calculated using DETX and DETY for each event in the final _common_clean file
| Quadrant A | 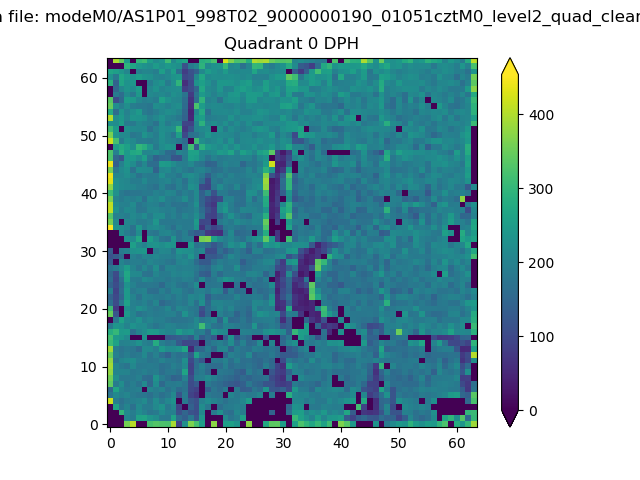 |
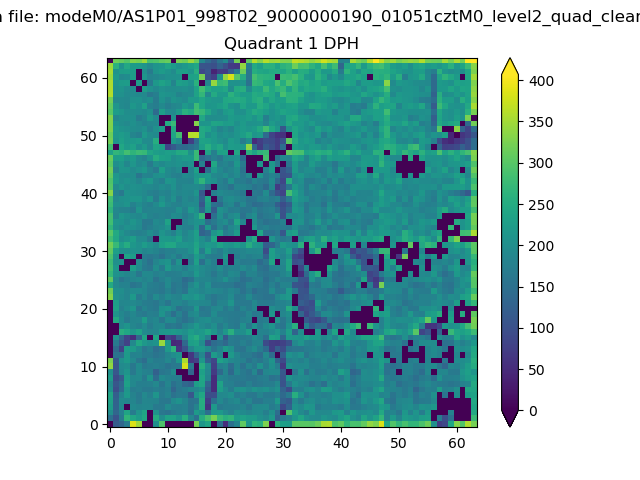 |
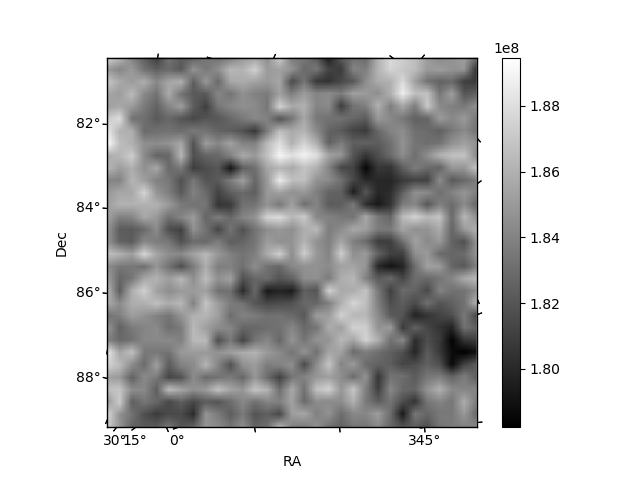
Quadrant B |
|---|---|---|---|
| Quadrant D | 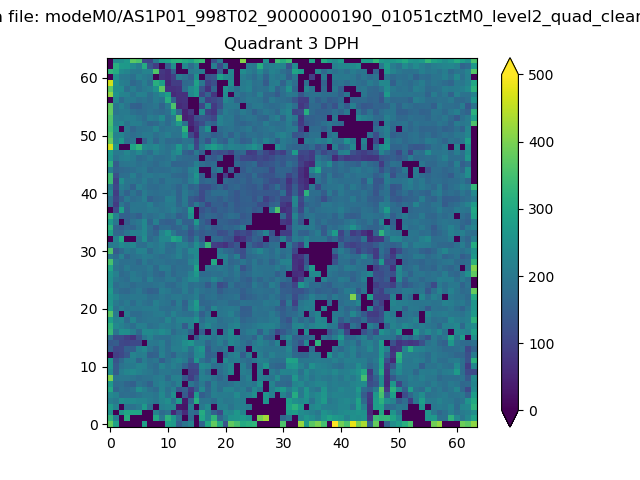 |
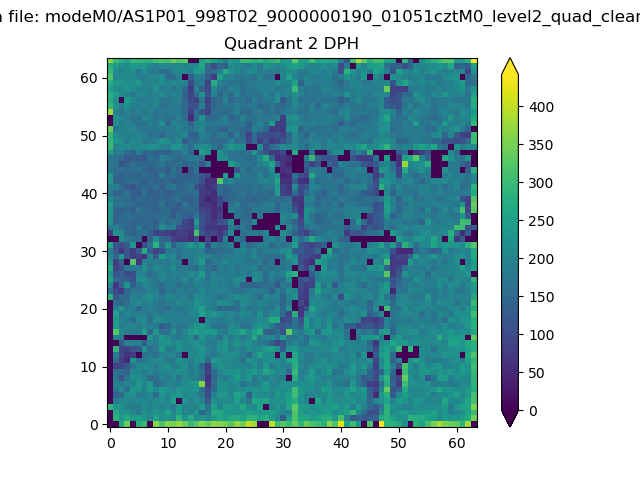 |
Quadrant C |
| Plot type | Count rate plots | Images |
|---|---|---|
| Comparison with Poisson distribution Blue bars denote a histogram of data divided into 1 sec bins. Red curve is a Poisson curve with rate = median count rate of data. |
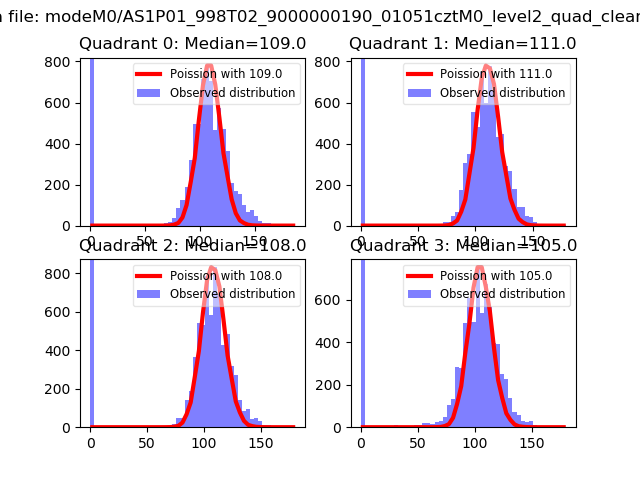 |
 |
| Quadrant-wise count rates Data is divided into 100 sec bins |
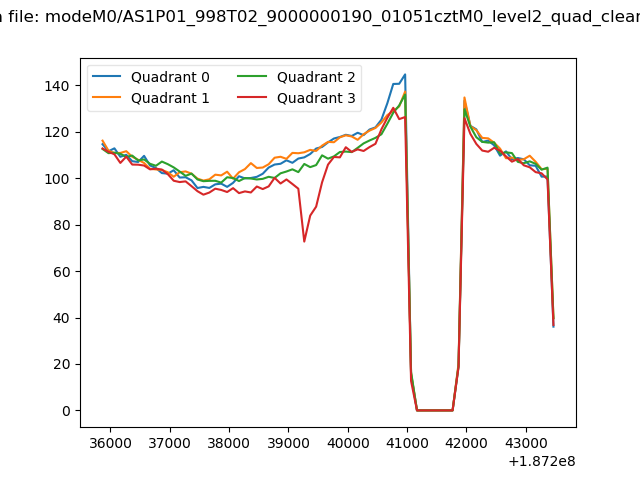 |
|
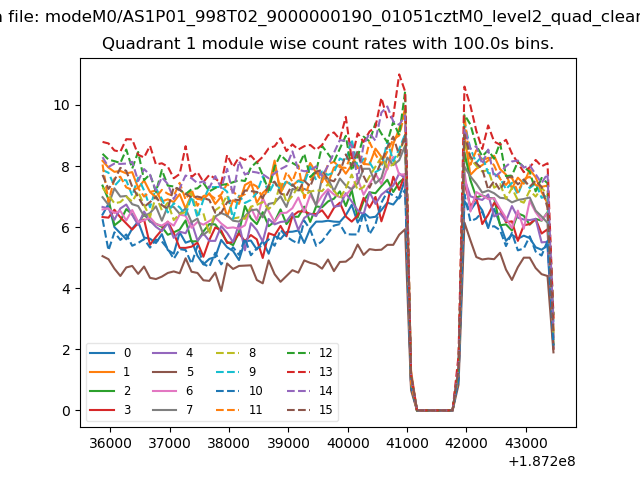
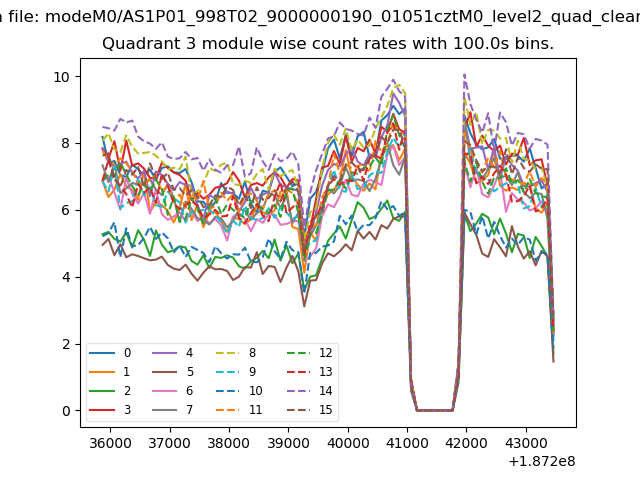
| Module-wise count rates for Quadrant A Data is divided into 100 sec bins |
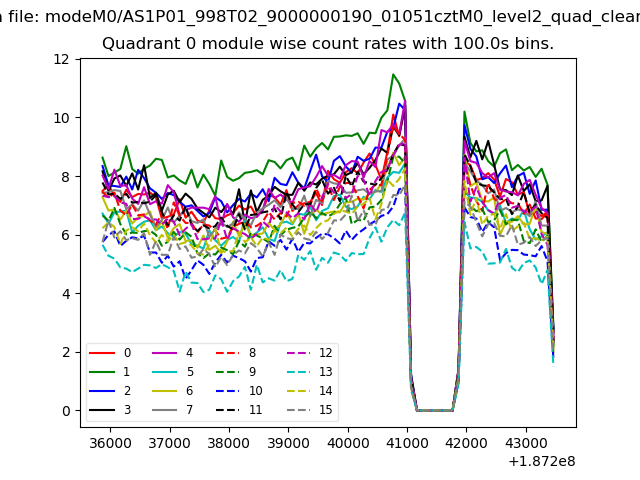 |
 |
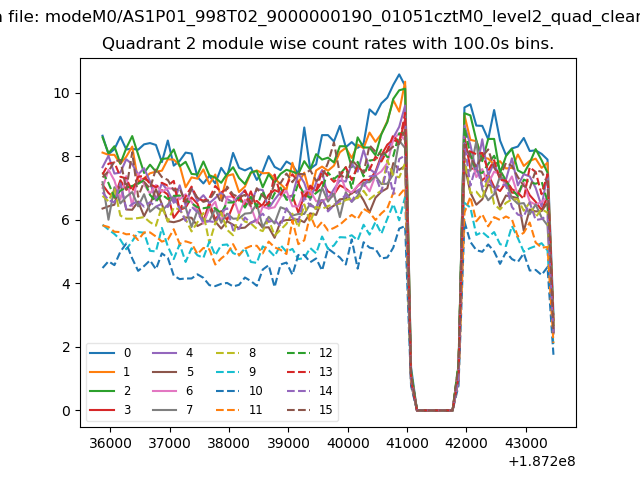
| Module-wise count rates for Quadrant B Data is divided into 100 sec bins |
 |
 |
| Module-wise count rates for Quadrant C Data is divided into 100 sec bins |
 |
 |
| Module-wise count rates for Quadrant D Data is divided into 100 sec bins |
 |
 |
| Parameter | Plot |
|---|---|
| CZT HV Monitor | 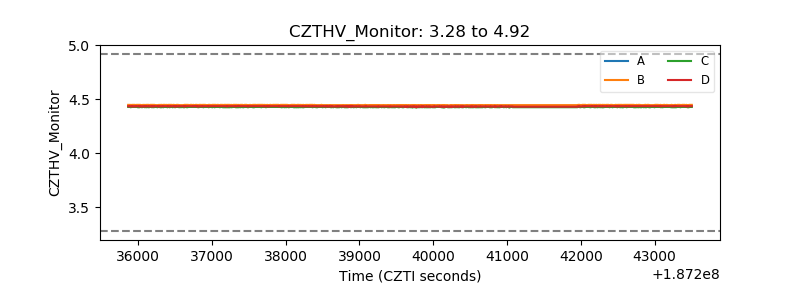 |
| D_VDD | 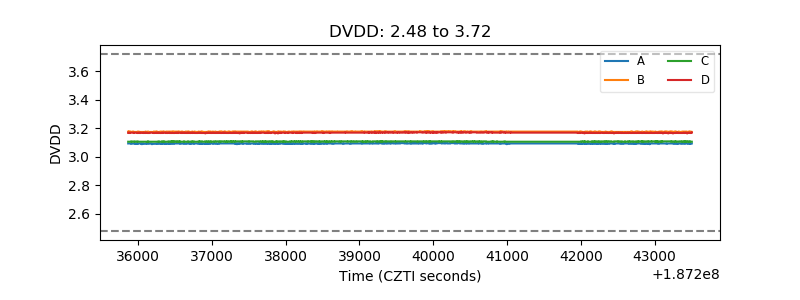 |
| Temperature 1 | 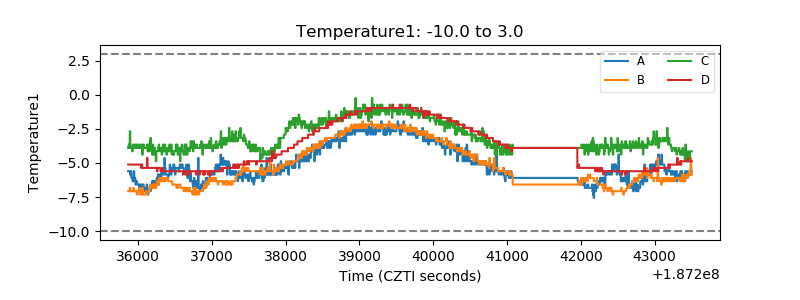 |
| Veto HV Monitor | 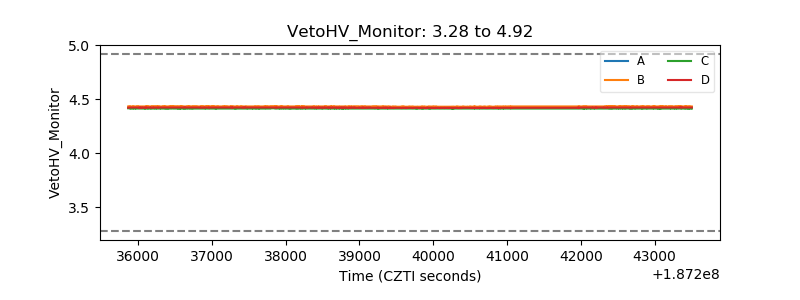 |
| Veto LLD | 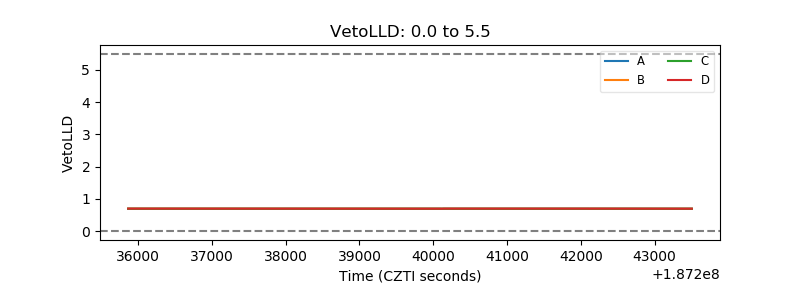 |
| Alpha Counter | 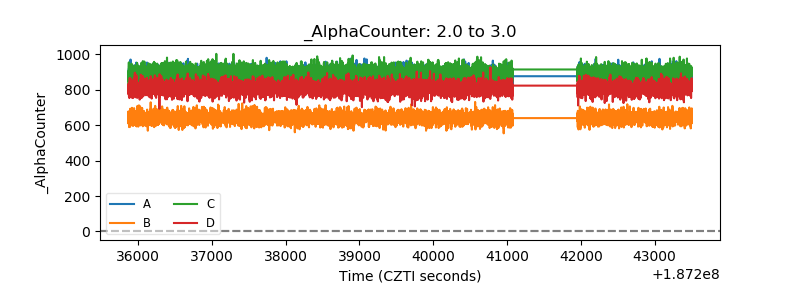 |
| _CPM_Rate | 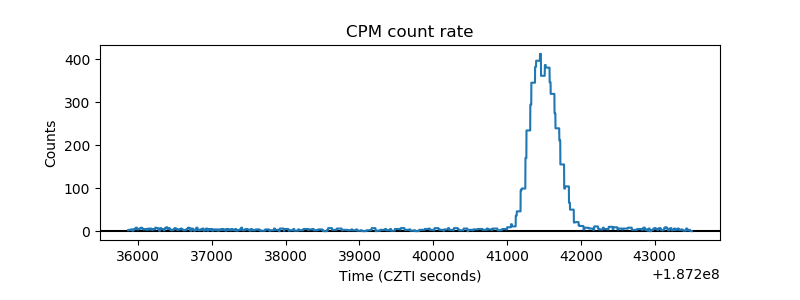 |
| CZT Counter |  |
| +2.5 Volts monitor |  |
| +5 Volts monitor |  |
| _ROLL_ROT | 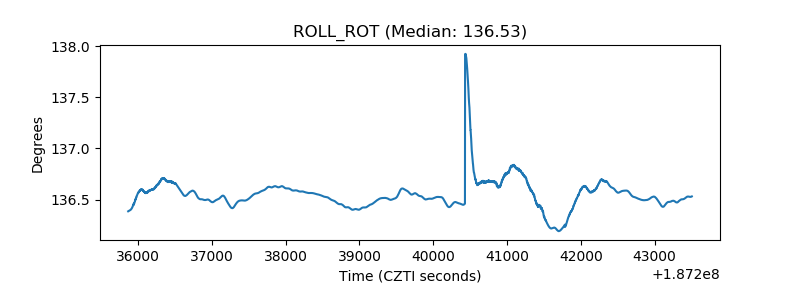 |
| _Roll_DEC | 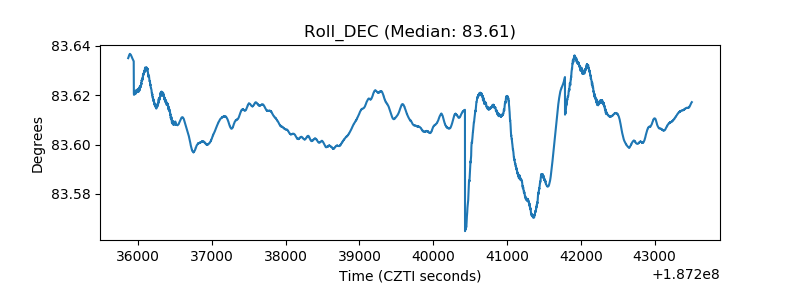 |
| _Roll_RA | 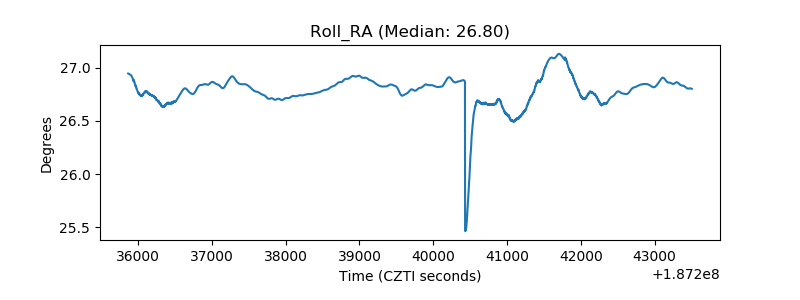 |
| Veto Counter | 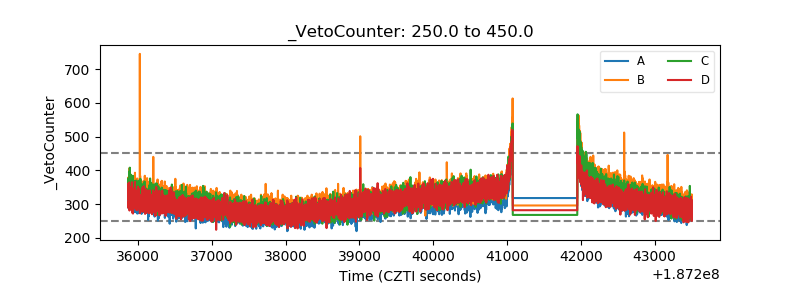 |