| Param | Original file | Final file |
|---|---|---|
| Filename | modeM0/AS1P01_998T02_9000000190_01052cztM0_level2.evt | modeM0/AS1P01_998T02_9000000190_01052cztM0_level2_quad_clean.evt |
| Size (bytes) | 916,096,320 | 97,490,880 |
| Size | 873.7 MB | 93.0 MB |
| Events in quadrant A | 6,653,837 | 648,674 |
| Events in quadrant B | 6,989,561 | 654,341 |
| Events in quadrant C | 6,606,588 | 631,395 |
| Events in quadrant D | 7,112,138 | 616,122 |
| Mode M0 | |||
|---|---|---|---|
| Quadrant | BADHDUFLAG | Total packets | Discarded packets |
| A | 0 | 23857 | 2 |
| B | 0 | 24863 | 1 |
| C | 0 | 23729 | 1 |
| D | 0 | 25297 | 1 |
| Mode SS | |||
|---|---|---|---|
| Quadrant | BADHDUFLAG | Total packets | Discarded packets |
| A | 0 | 116 | 0 |
| B | 0 | 116 | 0 |
| C | 0 | 116 | 0 |
| D | 0 | 116 | 0 |
| Mode M9 | |||
|---|---|---|---|
| Quadrant | BADHDUFLAG | Total packets | Discarded packets |
| A | 0 | 11 | 0 |
| B | 0 | 11 | 0 |
| C | 0 | 11 | 0 |
| D | 0 | 11 | 0 |
| Quadrant | Total seconds | Saturated seconds | Saturation percentage |
|---|---|---|---|
| A | 5755 | 18 | 0.312772% |
| B | 5756 | 30 | 0.521195% |
| C | 5756 | 9 | 0.156359% |
| D | 5756 | 30 | 0.521195% |
Noise dominated data is calculated using 1-second bins in cleaned event files. If a bin has >2000 counts, and if more than 50% of those come from <1% of pixels, then it is considered to be noise-dominated and hence unusable.
| Quadrant | # 1 sec bins | Bins with >0 counts | Bins with >2000 counts | High rate bins dominated by noise | Noise dominated (total time) | Noise dominated (detector-on time) | Marked lightcurve |
|---|---|---|---|---|---|---|---|
| A | 6780 | 5756 | 109 | 109 | 1.61% | 1.89% | 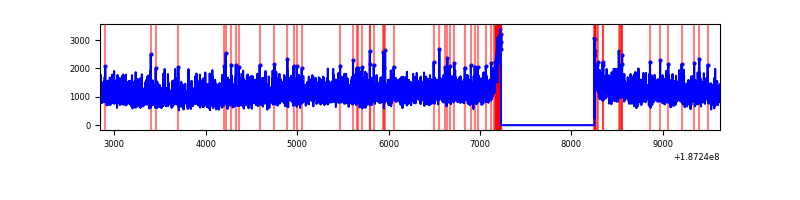 |
| B | 6781 | 5757 | 152 | 152 | 2.24% | 2.64% | 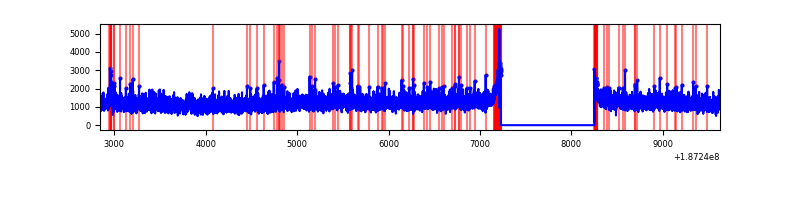 |
| C | 6781 | 5757 | 113 | 113 | 1.67% | 1.96% | 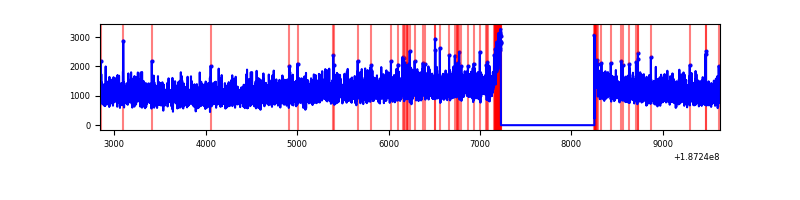 |
| D | 6781 | 5757 | 276 | 276 | 4.07% | 4.79% | 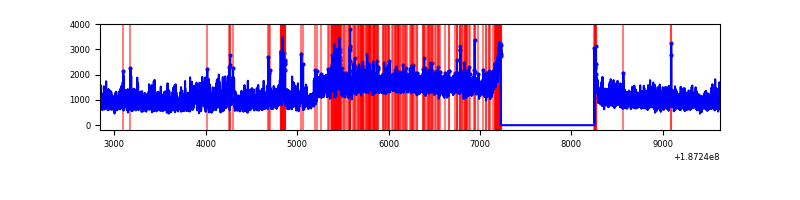 |
Top three noisy pixels from each quadrant. If the there are fewer than three noisy pixels in the level2.evt file, extra rows are filled as -1
| Pixel properties | Quadrant properties | ||||||
|---|---|---|---|---|---|---|---|
| Quadrant | DetID | PixID | Counts | Sigma | Mean | Median | Sigma |
| A | 0 | 253 | 8417 | 16.06 | 1731 | 1741 | 415.6 |
| A | 11 | 79 | 7283 | 13.33 | 1731 | 1741 | 415.6 |
| A | 3 | 111 | 5443 | 8.91 | 1731 | 1741 | 415.6 |
| B | 5 | 249 | 61287 | 140.6 | 1791 | 1802 | 423.1 |
| B | 8 | 234 | 39755 | 89.71 | 1791 | 1802 | 423.1 |
| B | 15 | 22 | 29939 | 66.51 | 1791 | 1802 | 423.1 |
| C | 15 | 241 | 283822 | 634.72 | 1604 | 1659 | 444.5 |
| C | 3 | 111 | 22121 | 46.03 | 1604 | 1659 | 444.5 |
| C | 3 | 79 | 20738 | 42.92 | 1604 | 1659 | 444.5 |
| D | 12 | 22 | 1035642 | 2132.39 | 1567 | 1626 | 484.9 |
| D | 1 | 83 | 121642 | 247.5 | 1567 | 1626 | 484.9 |
| D | 10 | 125 | 23161 | 44.41 | 1567 | 1626 | 484.9 |
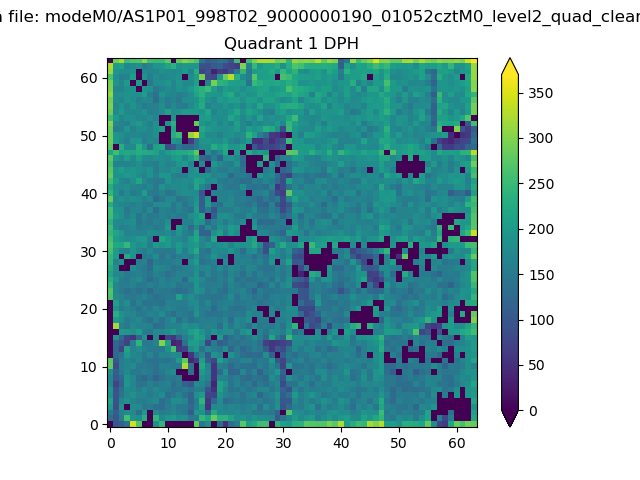
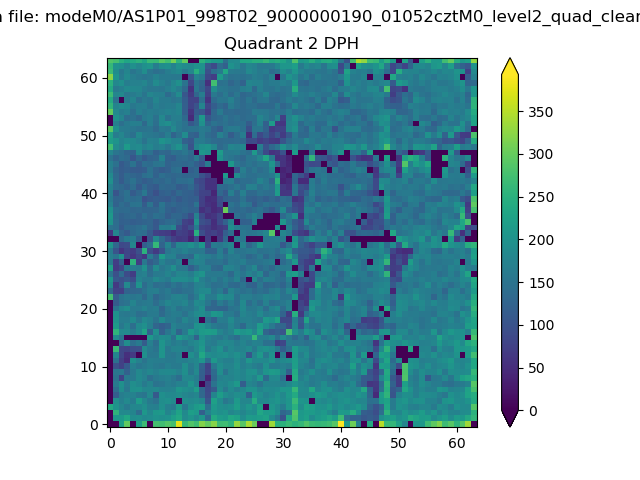
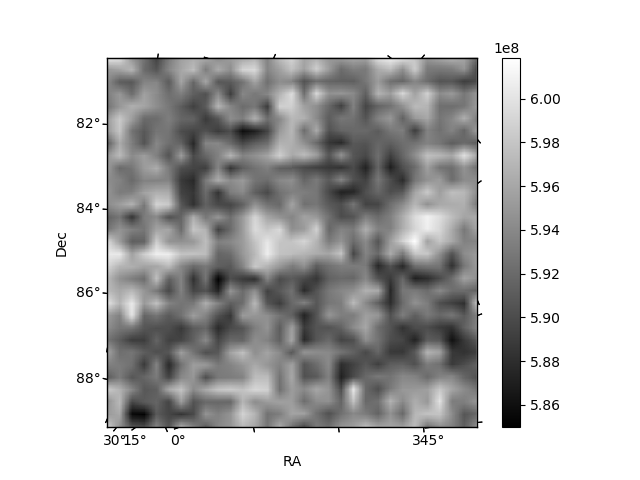
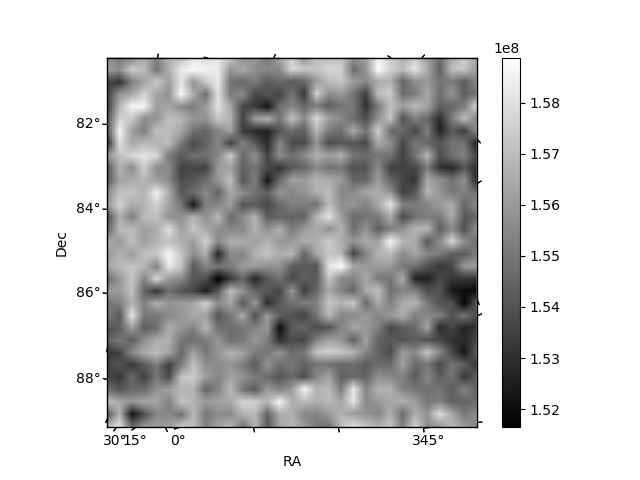
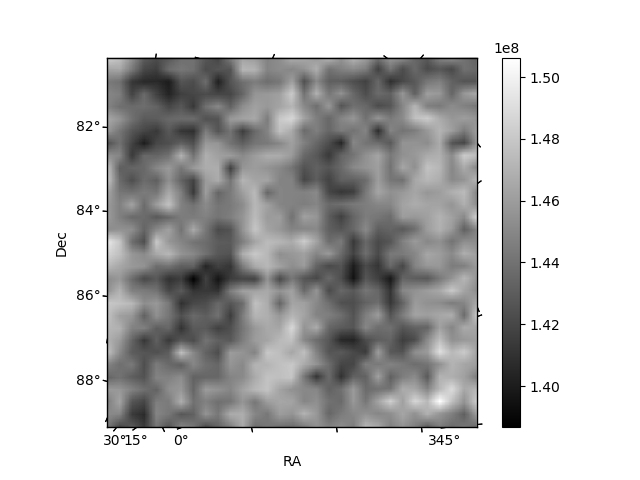
Histogram calculated using DETX and DETY for each event in the final _common_clean file
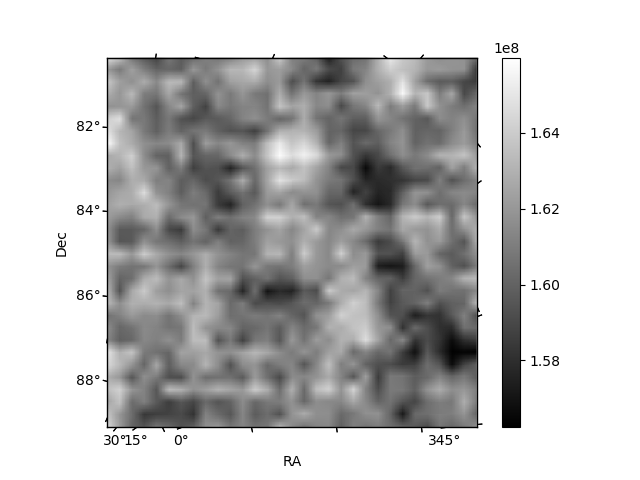
| Quadrant A |  |
 |
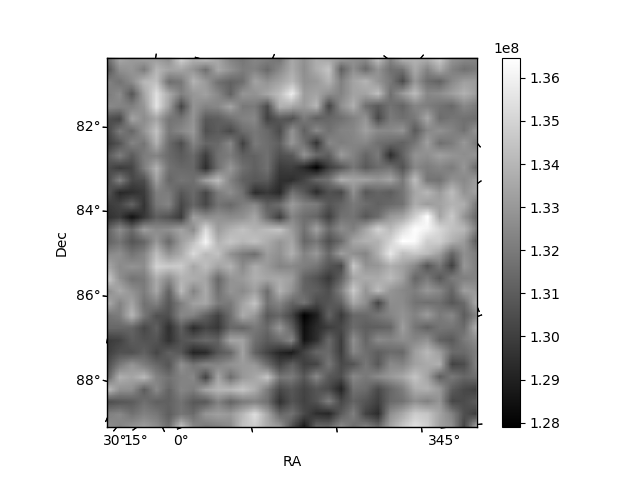
Quadrant B |
|---|---|---|---|
| Quadrant D | 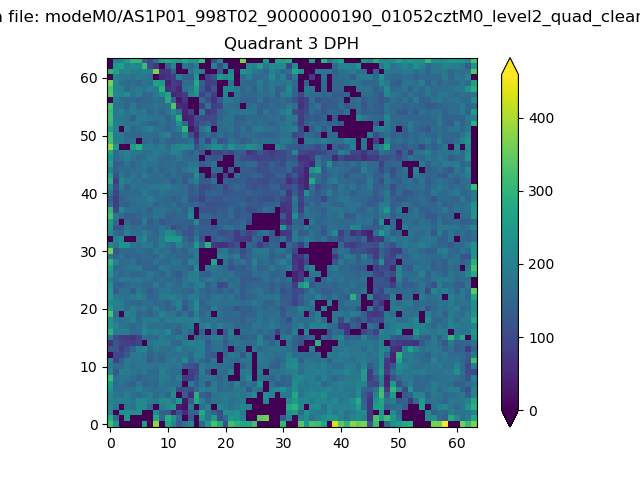 |
 |
Quadrant C |
| Plot type | Count rate plots | Images |
|---|---|---|
| Comparison with Poisson distribution Blue bars denote a histogram of data divided into 1 sec bins. Red curve is a Poisson curve with rate = median count rate of data. |
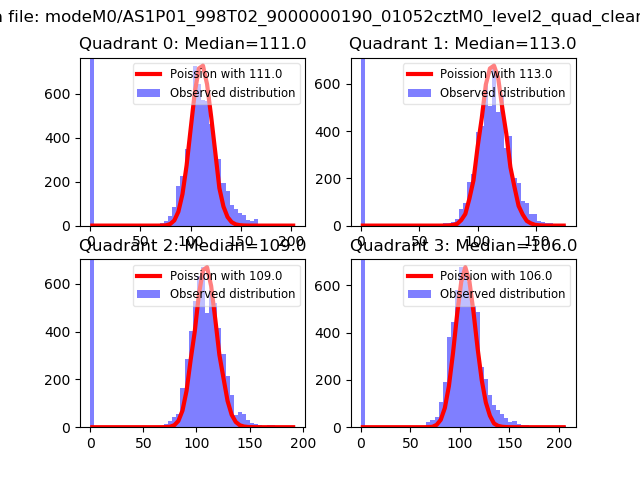 |
 |
| Quadrant-wise count rates Data is divided into 100 sec bins |
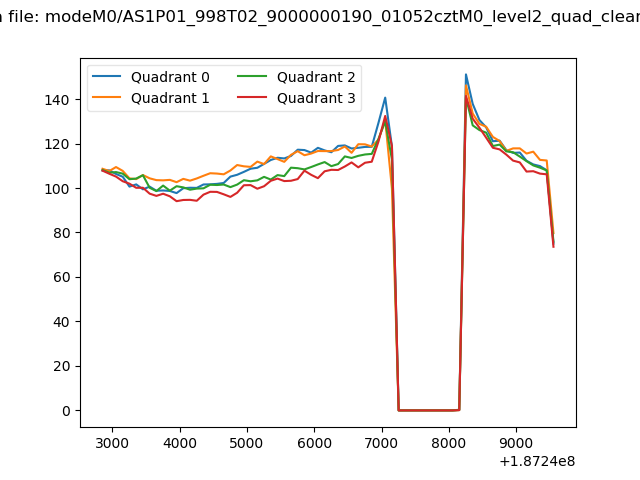 |
|
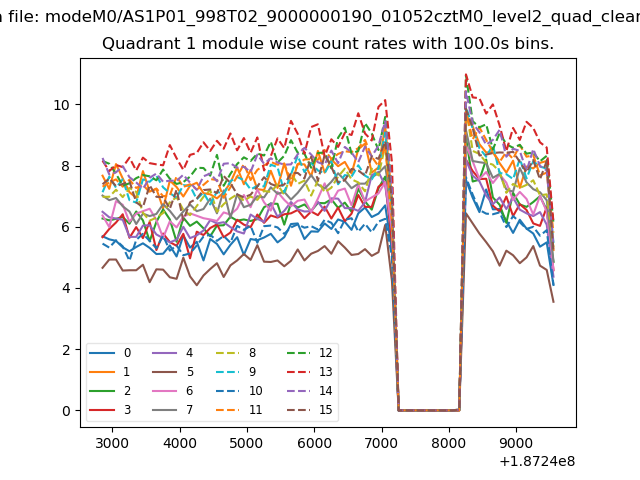
| Module-wise count rates for Quadrant A Data is divided into 100 sec bins |
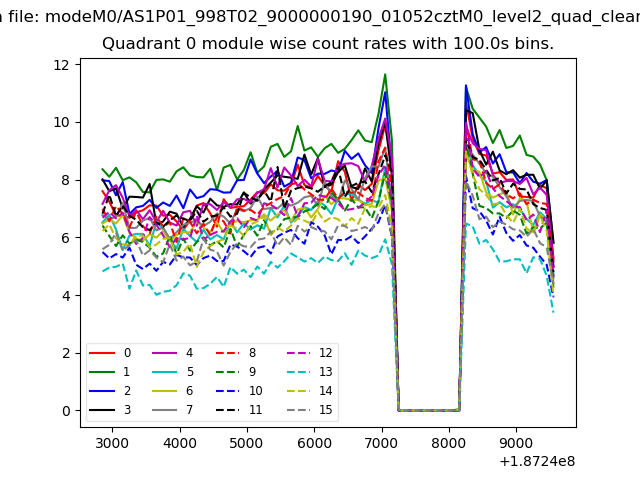 |
 |
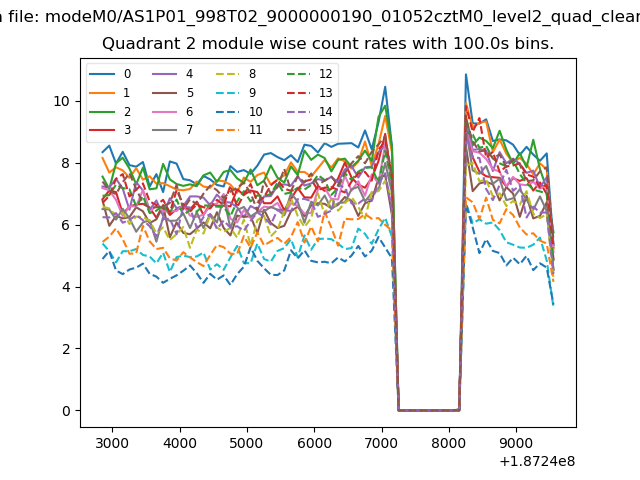
| Module-wise count rates for Quadrant B Data is divided into 100 sec bins |
 |
 |
| Module-wise count rates for Quadrant C Data is divided into 100 sec bins |
 |
 |
| Module-wise count rates for Quadrant D Data is divided into 100 sec bins |
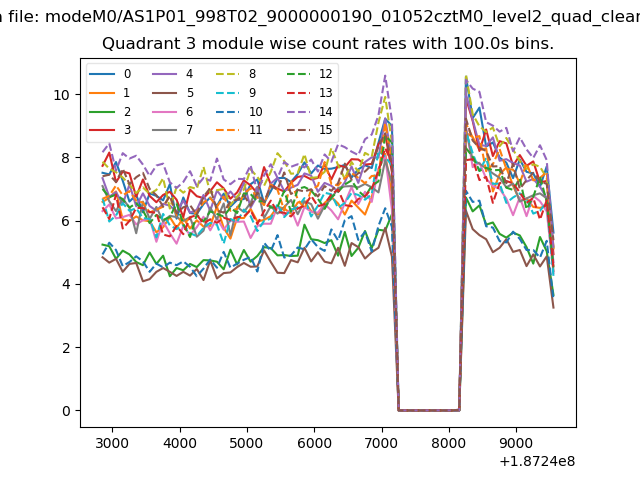 |
 |
| Parameter | Plot |
|---|---|
| CZT HV Monitor | 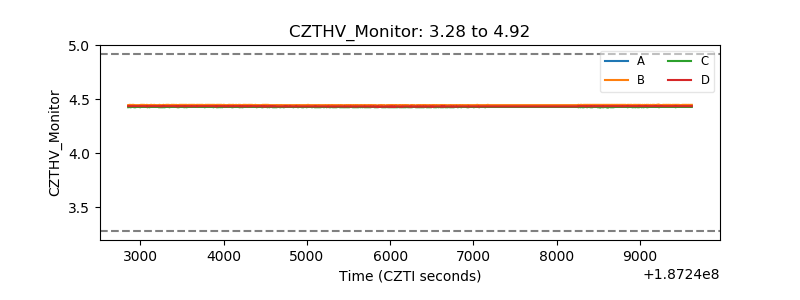 |
| D_VDD | 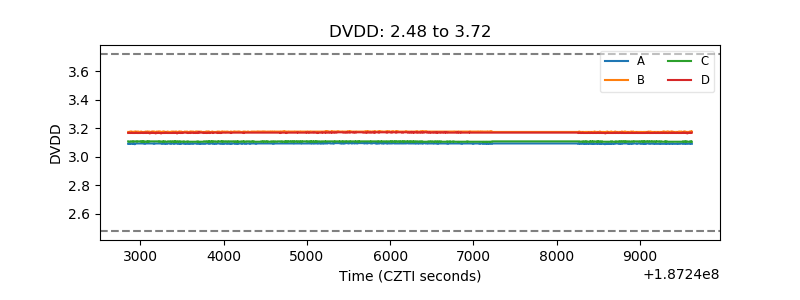 |
| Temperature 1 | 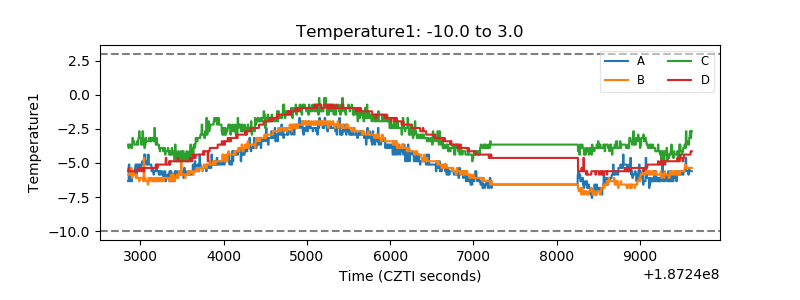 |
| Veto HV Monitor | 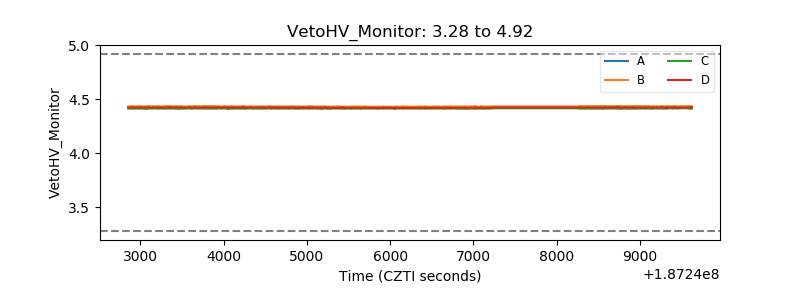 |
| Veto LLD | 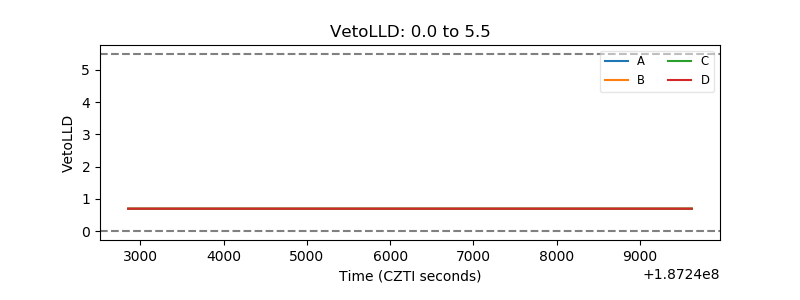 |
| Alpha Counter | 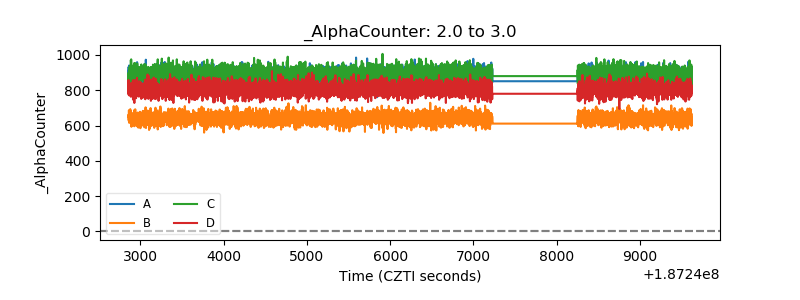 |
| _CPM_Rate | 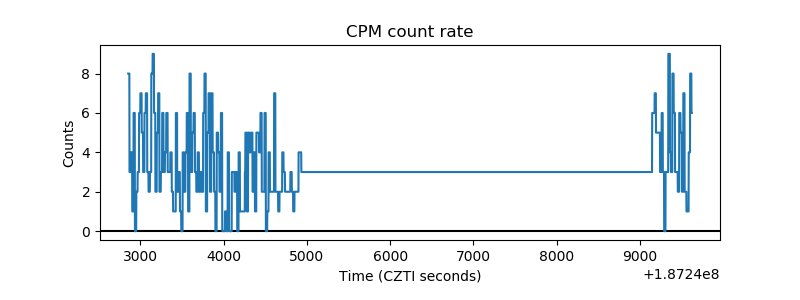 |
| CZT Counter | 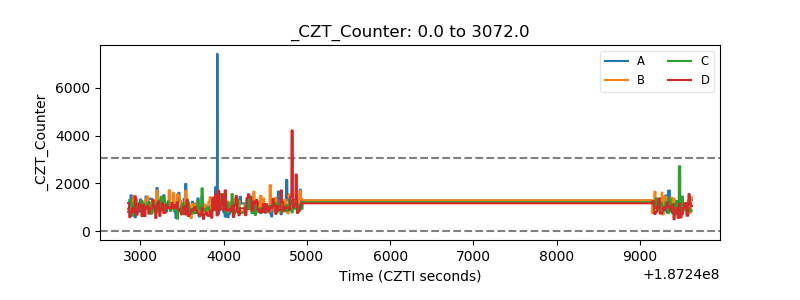 |
| +2.5 Volts monitor |  |
| +5 Volts monitor |  |
| _ROLL_ROT | 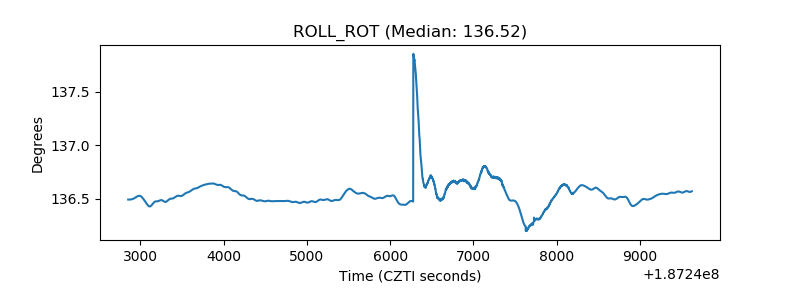 |
| _Roll_DEC | 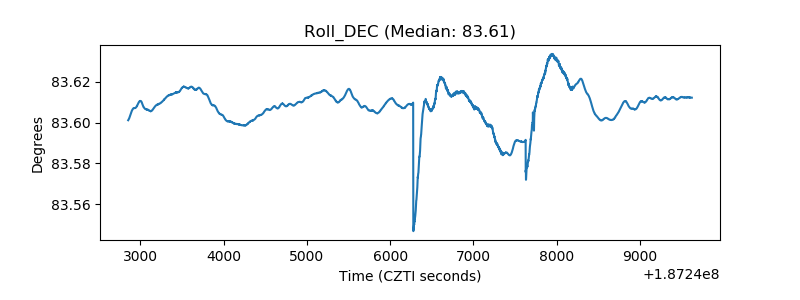 |
| _Roll_RA | 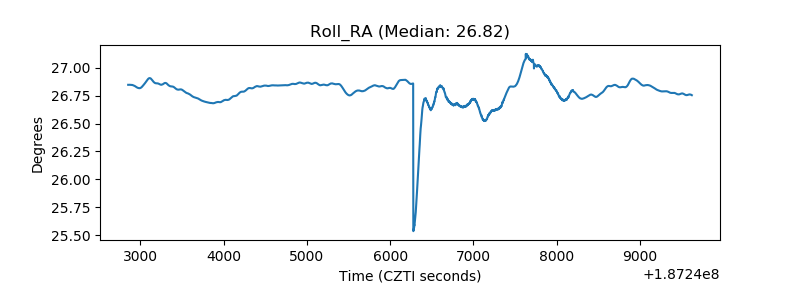 |
| Veto Counter | 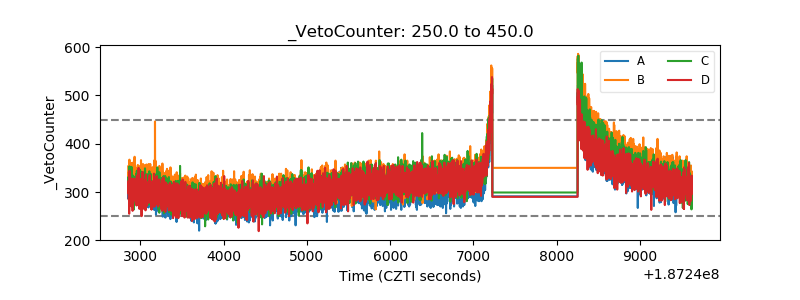 |