| Param | Original file | Final file |
|---|---|---|
| Filename | modeM0/AS1P01_998T02_9000000190_01056cztM0_level2.evt | modeM0/AS1P01_998T02_9000000190_01056cztM0_level2_quad_clean.evt |
| Size (bytes) | 1,043,853,120 | 114,338,880 |
| Size | 995.5 MB | 109.0 MB |
| Events in quadrant A | 7,627,025 | 775,187 |
| Events in quadrant B | 8,125,059 | 777,874 |
| Events in quadrant C | 7,560,174 | 743,181 |
| Events in quadrant D | 7,883,573 | 727,043 |
| Mode M0 | |||
|---|---|---|---|
| Quadrant | BADHDUFLAG | Total packets | Discarded packets |
| A | 0 | 27132 | 1 |
| B | 0 | 28612 | 1 |
| C | 0 | 26925 | 1 |
| D | 0 | 27904 | 1 |
| Mode SS | |||
|---|---|---|---|
| Quadrant | BADHDUFLAG | Total packets | Discarded packets |
| A | 0 | 126 | 0 |
| B | 0 | 126 | 0 |
| C | 0 | 126 | 0 |
| D | 0 | 126 | 0 |
| Mode M9 | |||
|---|---|---|---|
| Quadrant | BADHDUFLAG | Total packets | Discarded packets |
| A | 0 | 12 | 0 |
| B | 0 | 12 | 0 |
| C | 0 | 12 | 0 |
| D | 0 | 12 | 0 |
| Quadrant | Total seconds | Saturated seconds | Saturation percentage |
|---|---|---|---|
| A | 6307 | 70 | 1.109878% |
| B | 6308 | 99 | 1.569436% |
| C | 6308 | 62 | 0.982879% |
| D | 6308 | 173 | 2.742549% |
Noise dominated data is calculated using 1-second bins in cleaned event files. If a bin has >2000 counts, and if more than 50% of those come from <1% of pixels, then it is considered to be noise-dominated and hence unusable.
| Quadrant | # 1 sec bins | Bins with >0 counts | Bins with >2000 counts | High rate bins dominated by noise | Noise dominated (total time) | Noise dominated (detector-on time) | Marked lightcurve |
|---|---|---|---|---|---|---|---|
| A | 7472 | 6308 | 253 | 253 | 3.39% | 4.01% | 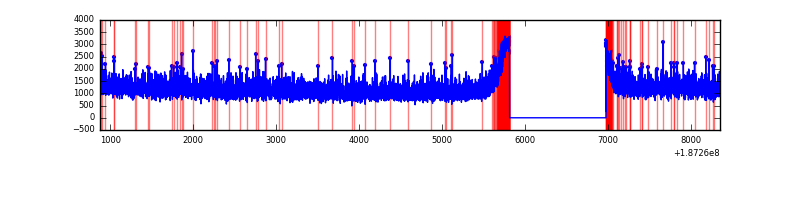 |
| B | 7473 | 6309 | 346 | 346 | 4.63% | 5.48% | 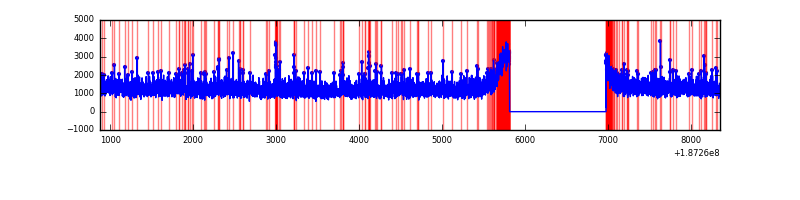 |
| C | 7473 | 6309 | 205 | 205 | 2.74% | 3.25% | 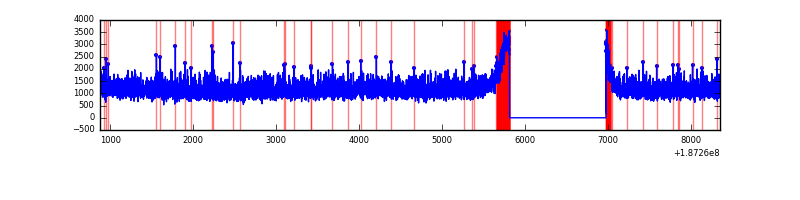 |
| D | 7473 | 6309 | 648 | 648 | 8.67% | 10.27% | 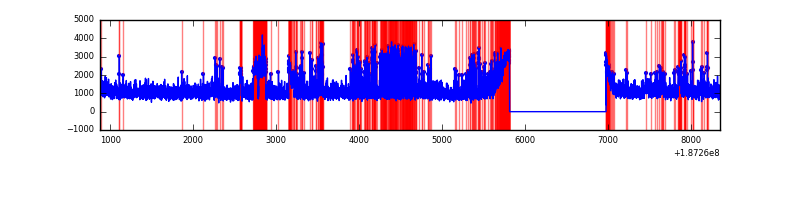 |
Top three noisy pixels from each quadrant. If the there are fewer than three noisy pixels in the level2.evt file, extra rows are filled as -1
| Pixel properties | Quadrant properties | ||||||
|---|---|---|---|---|---|---|---|
| Quadrant | DetID | PixID | Counts | Sigma | Mean | Median | Sigma |
| A | 11 | 79 | 8297 | 13.18 | 1986 | 1995 | 478.3 |
| A | 15 | 233 | 7440 | 11.38 | 1986 | 1995 | 478.3 |
| A | 3 | 111 | 6163 | 8.71 | 1986 | 1995 | 478.3 |
| B | 8 | 234 | 136130 | 278.98 | 2044 | 2052 | 480.6 |
| B | 15 | 22 | 62599 | 125.98 | 2044 | 2052 | 480.6 |
| B | 5 | 249 | 41652 | 82.4 | 2044 | 2052 | 480.6 |
| C | 15 | 241 | 326777 | 635.9 | 1835 | 1897 | 510.9 |
| C | 3 | 79 | 30136 | 55.27 | 1835 | 1897 | 510.9 |
| C | 3 | 111 | 26553 | 48.26 | 1835 | 1897 | 510.9 |
| D | 12 | 22 | 1033948 | 1837.26 | 1817 | 1878 | 561.7 |
| D | 2 | 107 | 25220 | 41.55 | 1817 | 1878 | 561.7 |
| D | 10 | 85 | 11431 | 17.01 | 1817 | 1878 | 561.7 |
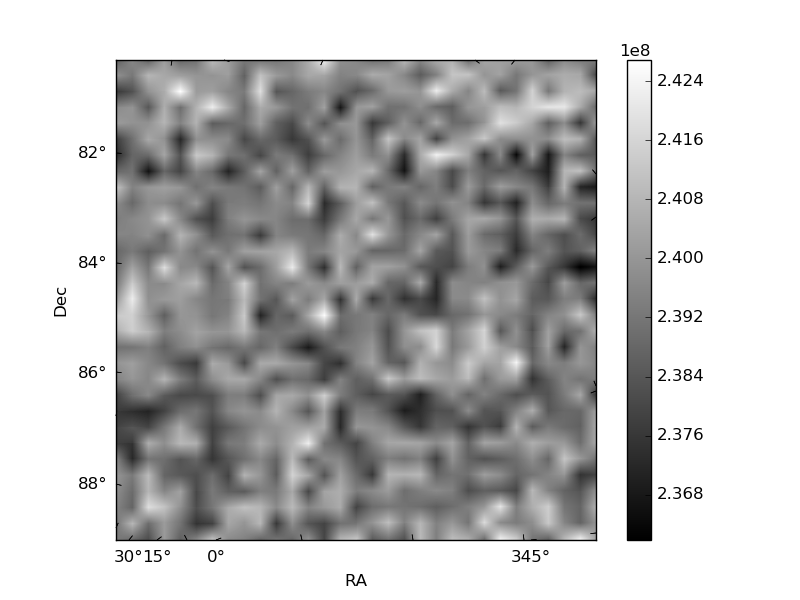
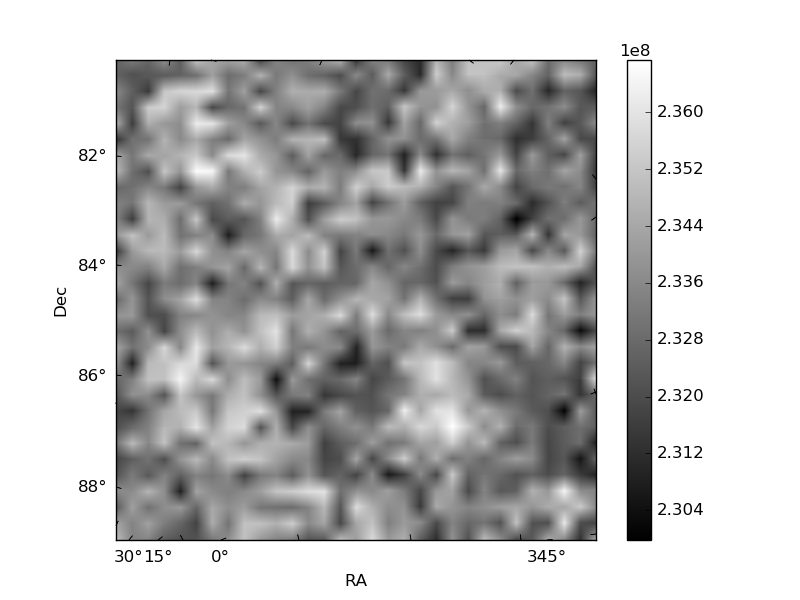
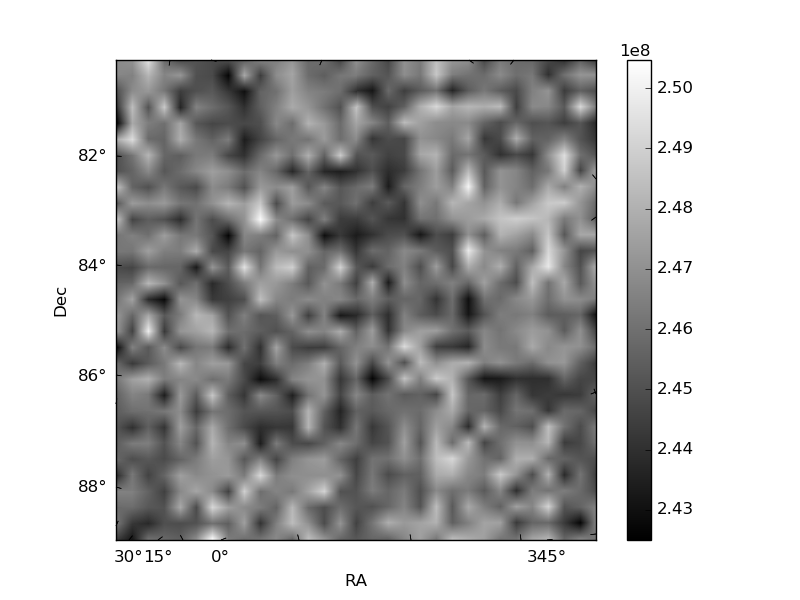
Histogram calculated using DETX and DETY for each event in the final _common_clean file
| Quadrant A | 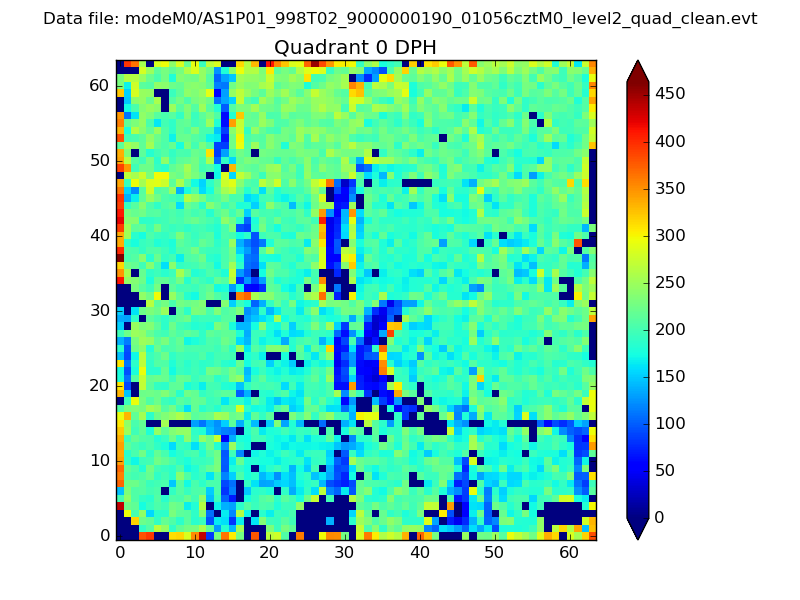 |
 |
Quadrant B |
|---|---|---|---|
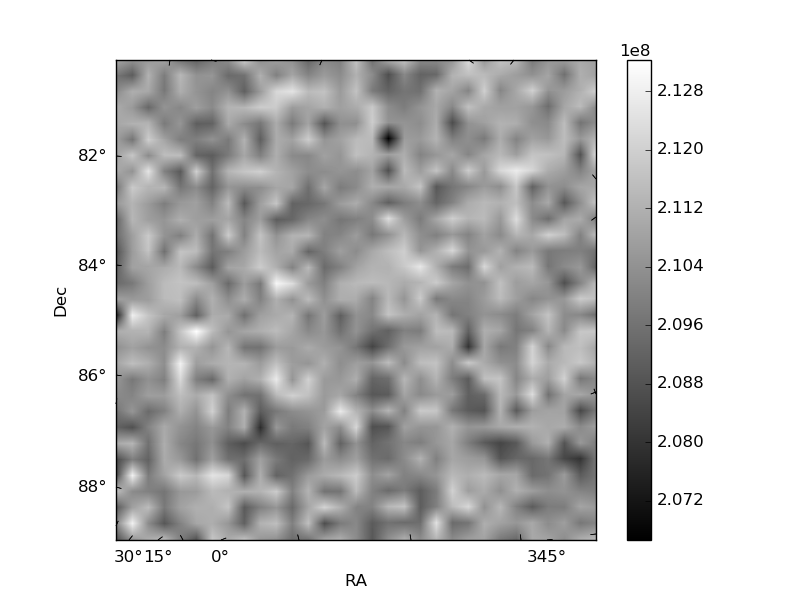
| Quadrant D |  |
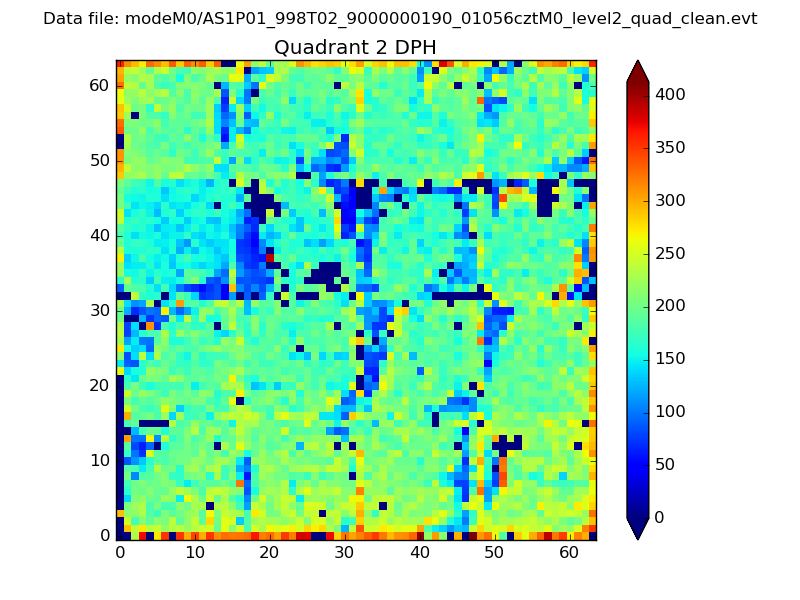 |
Quadrant C |
| Plot type | Count rate plots | Images |
|---|---|---|
| Comparison with Poisson distribution Blue bars denote a histogram of data divided into 1 sec bins. Red curve is a Poisson curve with rate = median count rate of data. |
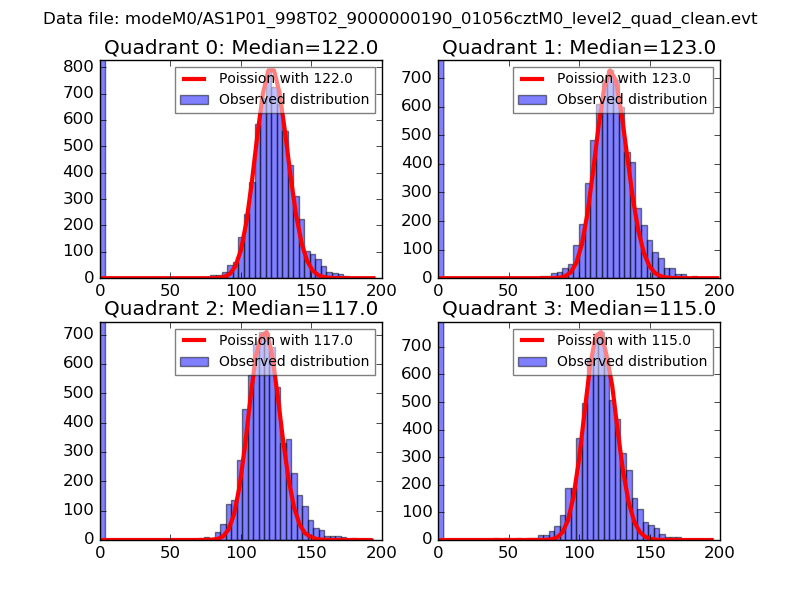 |
 |
| Quadrant-wise count rates Data is divided into 100 sec bins |
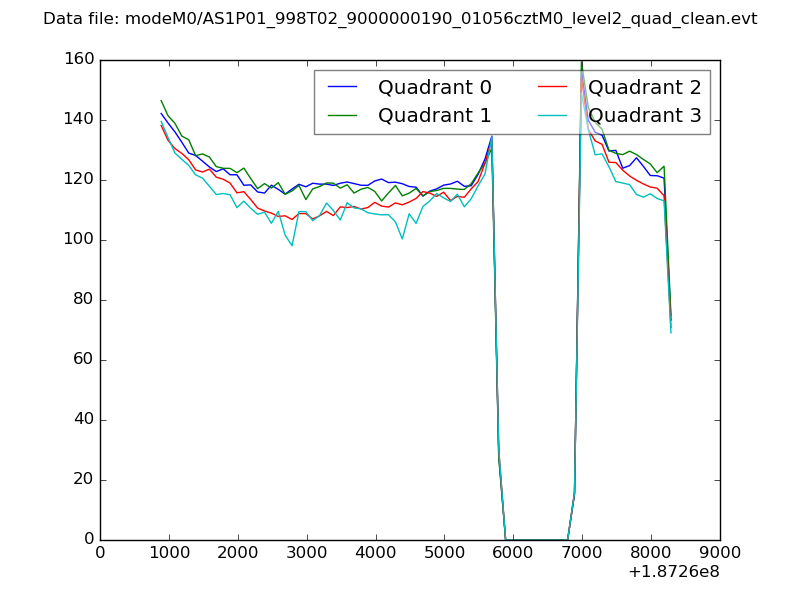 |
|
| Module-wise count rates for Quadrant A Data is divided into 100 sec bins |
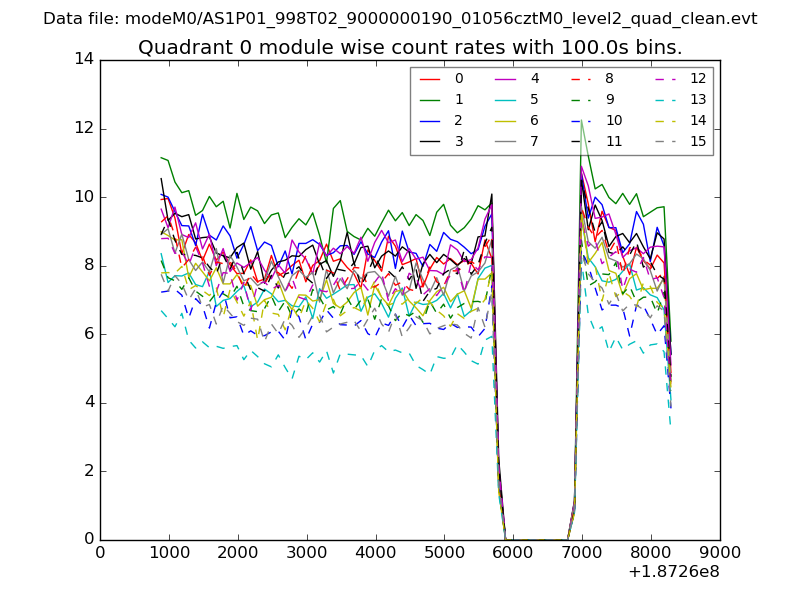 |
 |
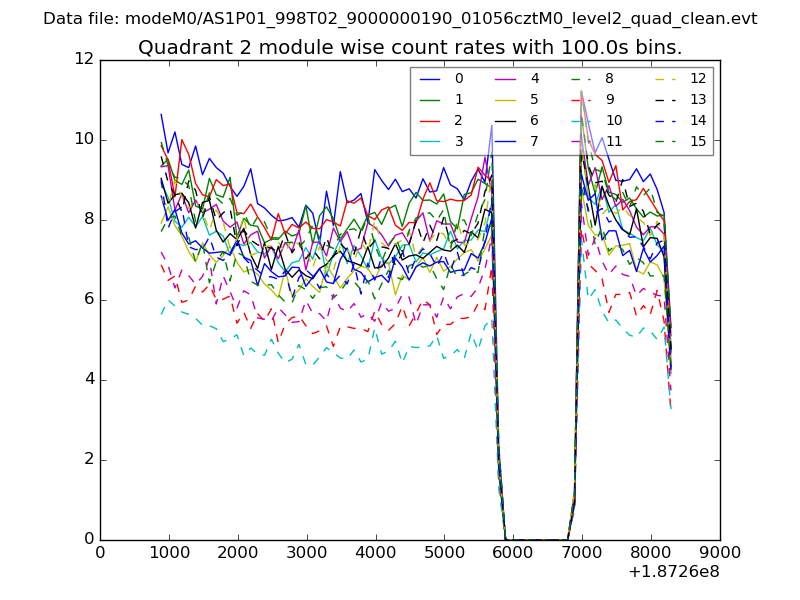
| Module-wise count rates for Quadrant B Data is divided into 100 sec bins |
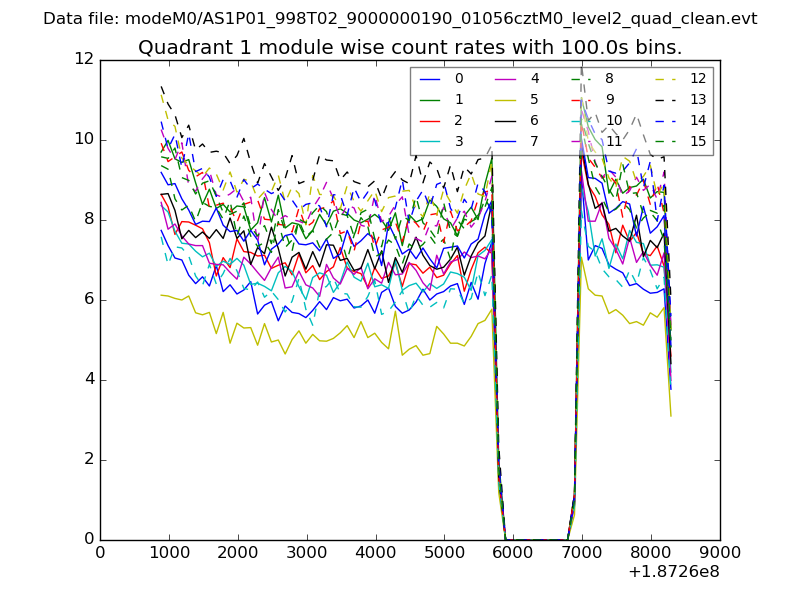 |
 |
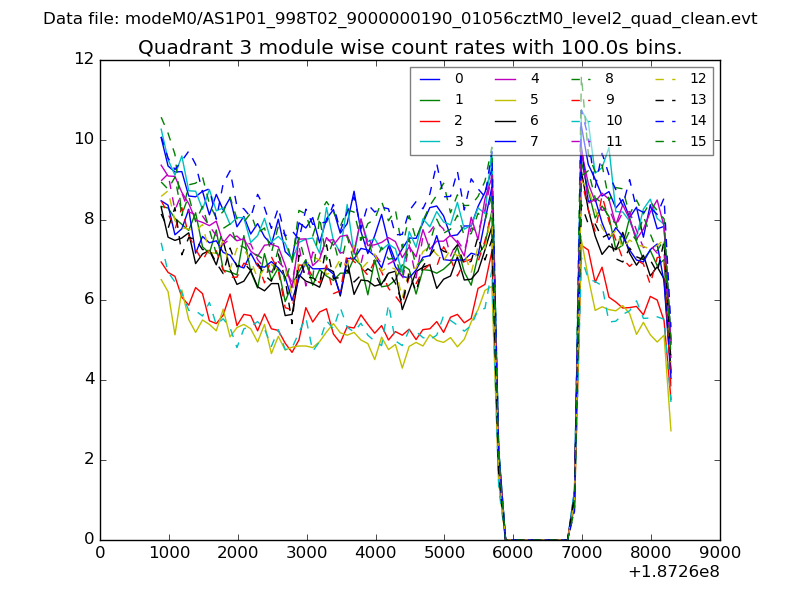
| Module-wise count rates for Quadrant C Data is divided into 100 sec bins |
 |
 |
| Module-wise count rates for Quadrant D Data is divided into 100 sec bins |
 |
 |
| Parameter | Plot |
|---|---|
| CZT HV Monitor | 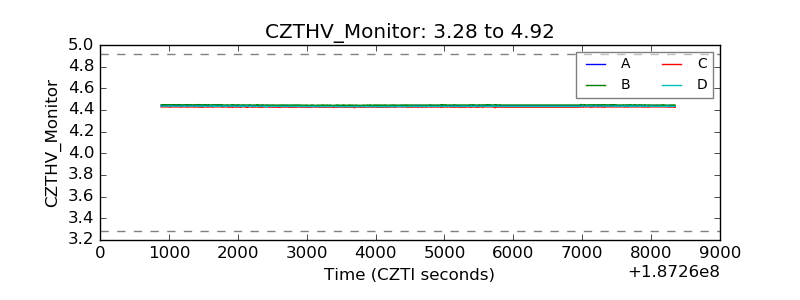 |
| D_VDD | 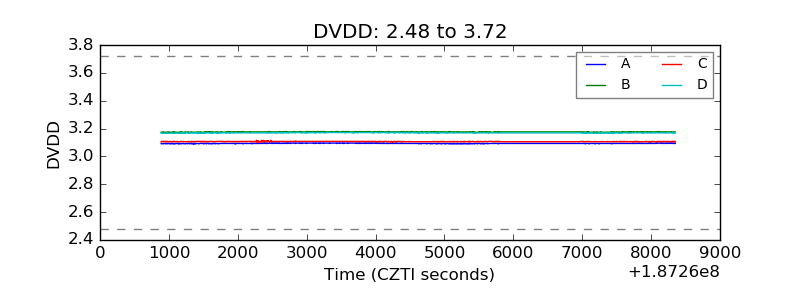 |
| Temperature 1 | 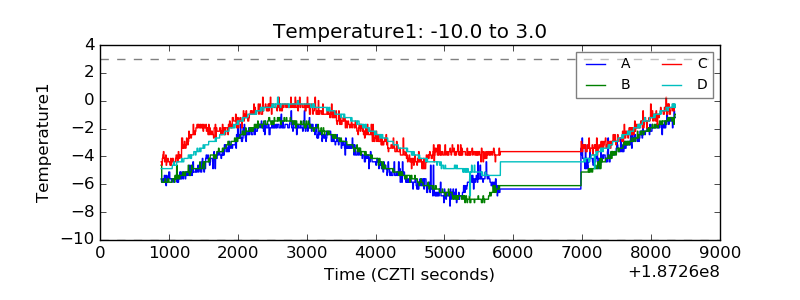 |
| Veto HV Monitor | 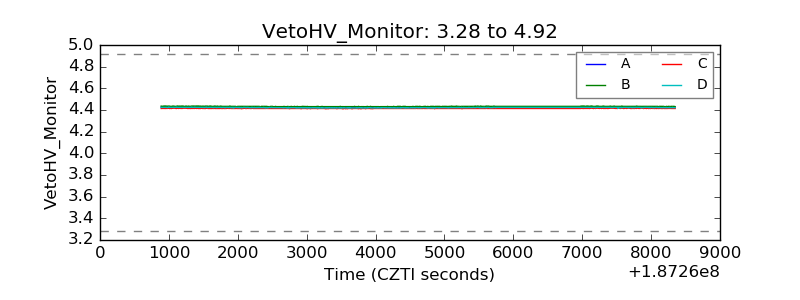 |
| Veto LLD | 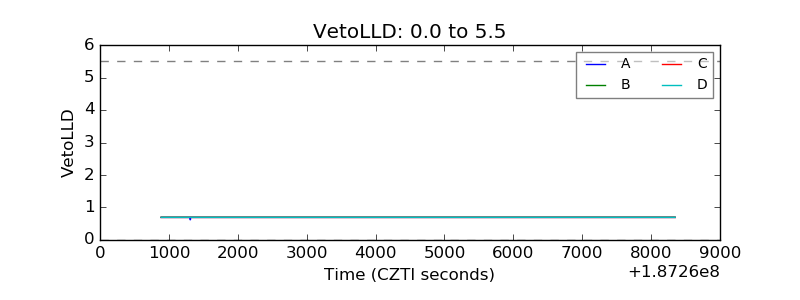 |
| Alpha Counter | 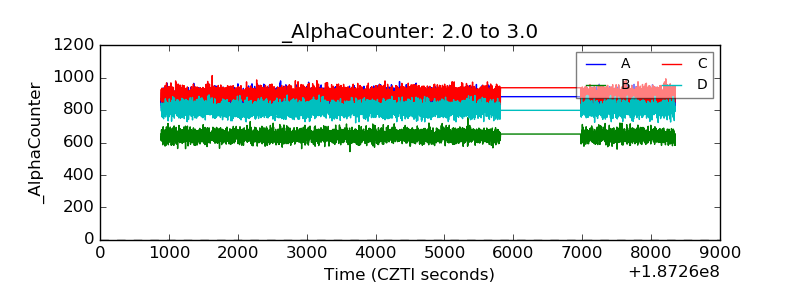 |
| _CPM_Rate | 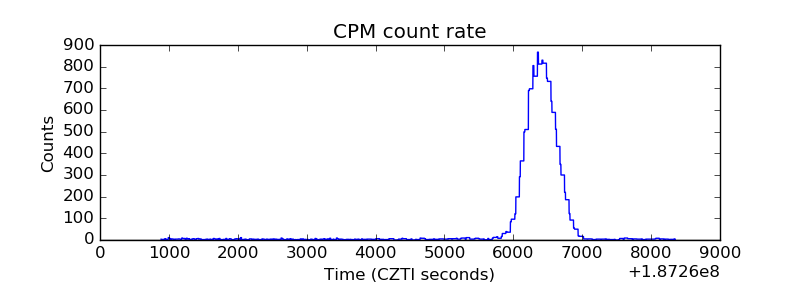 |
| CZT Counter | 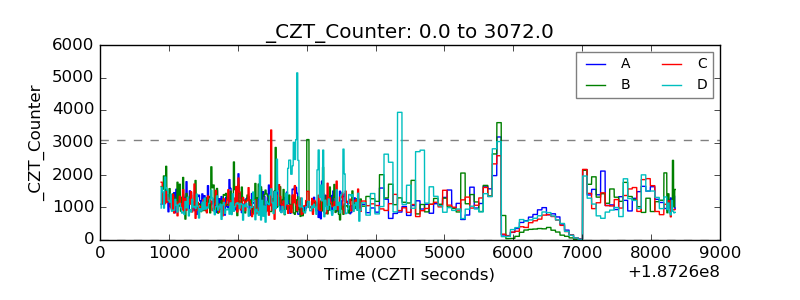 |
| +2.5 Volts monitor |  |
| +5 Volts monitor |  |
| _ROLL_ROT | 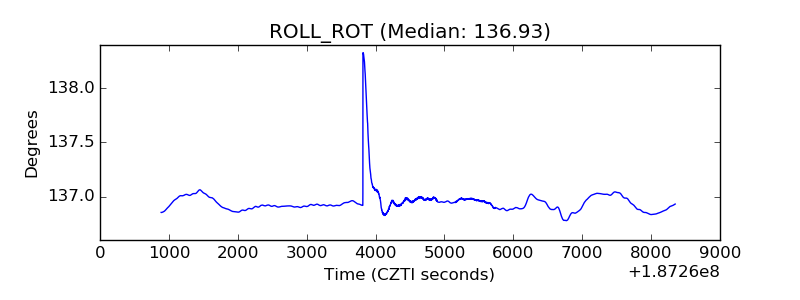 |
| _Roll_DEC | 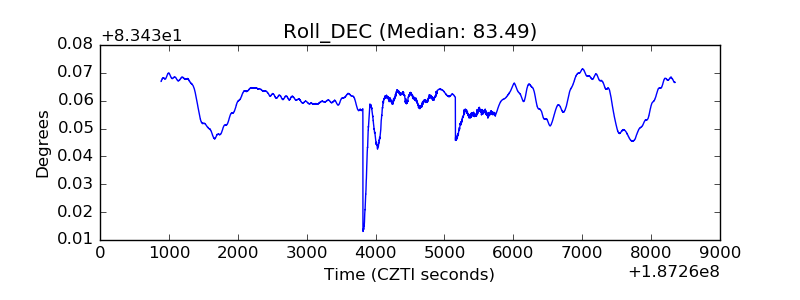 |
| _Roll_RA | 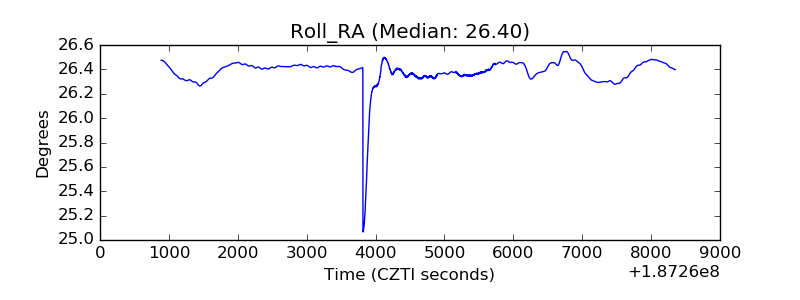 |
| Veto Counter | 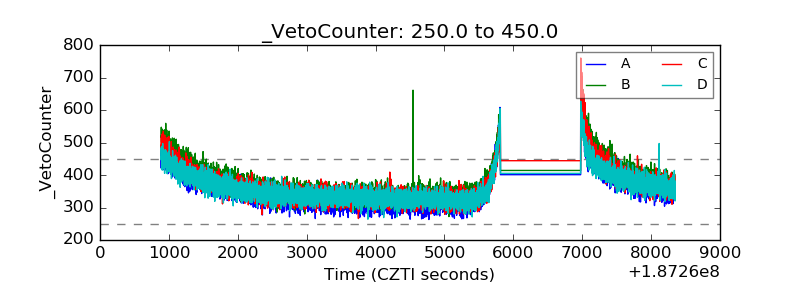 |