| Param | Original file | Final file |
|---|---|---|
| Filename | modeM0/AS1P01_998T02_9000000190_01057cztM0_level2.evt | modeM0/AS1P01_998T02_9000000190_01057cztM0_level2_quad_clean.evt |
| Size (bytes) | 955,621,440 | 106,945,920 |
| Size | 911.4 MB | 102.0 MB |
| Events in quadrant A | 7,129,574 | 720,763 |
| Events in quadrant B | 7,545,812 | 722,400 |
| Events in quadrant C | 7,157,929 | 691,361 |
| Events in quadrant D | 6,706,413 | 682,423 |
| Mode M0 | |||
|---|---|---|---|
| Quadrant | BADHDUFLAG | Total packets | Discarded packets |
| A | 0 | 25493 | 4 |
| B | 0 | 26710 | 1 |
| C | 0 | 25592 | 1 |
| D | 0 | 24210 | 1 |
| Mode SS | |||
|---|---|---|---|
| Quadrant | BADHDUFLAG | Total packets | Discarded packets |
| A | 0 | 124 | 0 |
| B | 0 | 124 | 0 |
| C | 0 | 124 | 0 |
| D | 0 | 124 | 0 |
| Mode M9 | |||
|---|---|---|---|
| Quadrant | BADHDUFLAG | Total packets | Discarded packets |
| A | 0 | 12 | 0 |
| B | 0 | 12 | 0 |
| C | 0 | 12 | 0 |
| D | 0 | 12 | 0 |
| Quadrant | Total seconds | Saturated seconds | Saturation percentage |
|---|---|---|---|
| A | 6041 | 14 | 0.231750% |
| B | 6041 | 39 | 0.645588% |
| C | 6042 | 18 | 0.297915% |
| D | 6042 | 17 | 0.281364% |
Noise dominated data is calculated using 1-second bins in cleaned event files. If a bin has >2000 counts, and if more than 50% of those come from <1% of pixels, then it is considered to be noise-dominated and hence unusable.
| Quadrant | # 1 sec bins | Bins with >0 counts | Bins with >2000 counts | High rate bins dominated by noise | Noise dominated (total time) | Noise dominated (detector-on time) | Marked lightcurve |
|---|---|---|---|---|---|---|---|
| A | 7251 | 6042 | 192 | 192 | 2.65% | 3.18% | 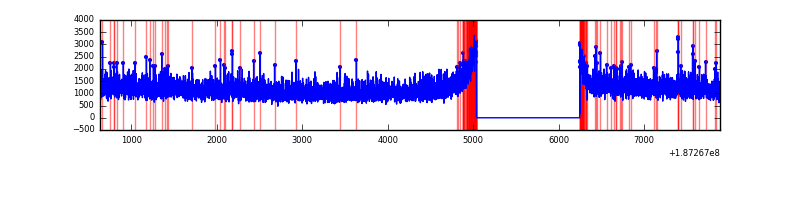 |
| B | 7251 | 6042 | 259 | 259 | 3.57% | 4.29% | 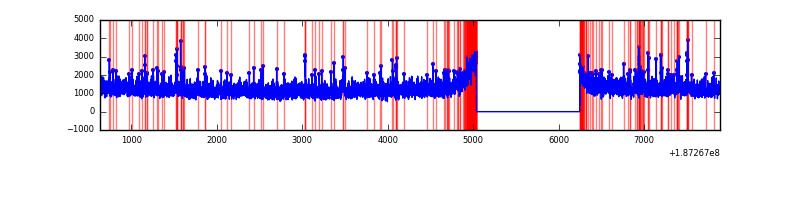 |
| C | 7252 | 6043 | 154 | 154 | 2.12% | 2.55% | 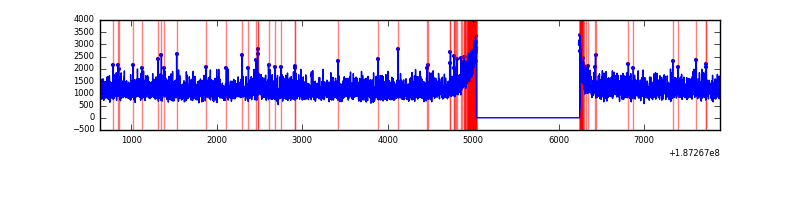 |
| D | 7252 | 6043 | 194 | 194 | 2.68% | 3.21% | 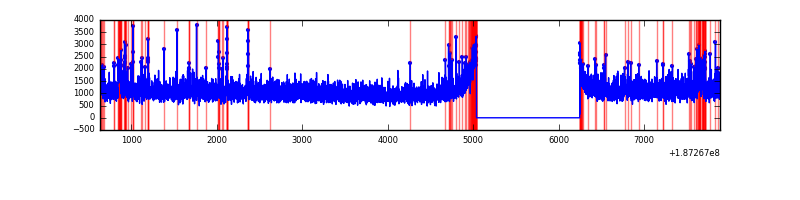 |
Top three noisy pixels from each quadrant. If the there are fewer than three noisy pixels in the level2.evt file, extra rows are filled as -1
| Pixel properties | Quadrant properties | ||||||
|---|---|---|---|---|---|---|---|
| Quadrant | DetID | PixID | Counts | Sigma | Mean | Median | Sigma |
| A | 0 | 253 | 15737 | 31.23 | 1849 | 1859 | 444.3 |
| A | 14 | 79 | 12831 | 24.69 | 1849 | 1859 | 444.3 |
| A | 15 | 233 | 6629 | 10.74 | 1849 | 1859 | 444.3 |
| B | 15 | 22 | 103688 | 227.77 | 1898 | 1906 | 446.9 |
| B | 5 | 249 | 92389 | 202.48 | 1898 | 1906 | 446.9 |
| B | 8 | 38 | 39433 | 83.98 | 1898 | 1906 | 446.9 |
| C | 15 | 241 | 313853 | 648.49 | 1732 | 1792 | 481.2 |
| C | 3 | 79 | 33090 | 65.04 | 1732 | 1792 | 481.2 |
| C | 3 | 111 | 26630 | 51.62 | 1732 | 1792 | 481.2 |
| D | 12 | 22 | 168339 | 318.33 | 1711 | 1773 | 523.2 |
| D | 11 | 176 | 44418 | 81.5 | 1711 | 1773 | 523.2 |
| D | 10 | 125 | 37951 | 69.14 | 1711 | 1773 | 523.2 |
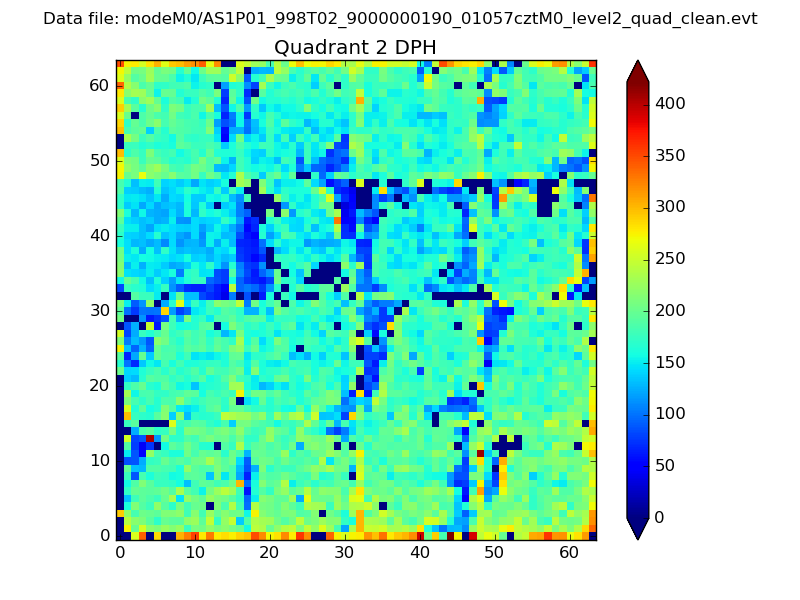
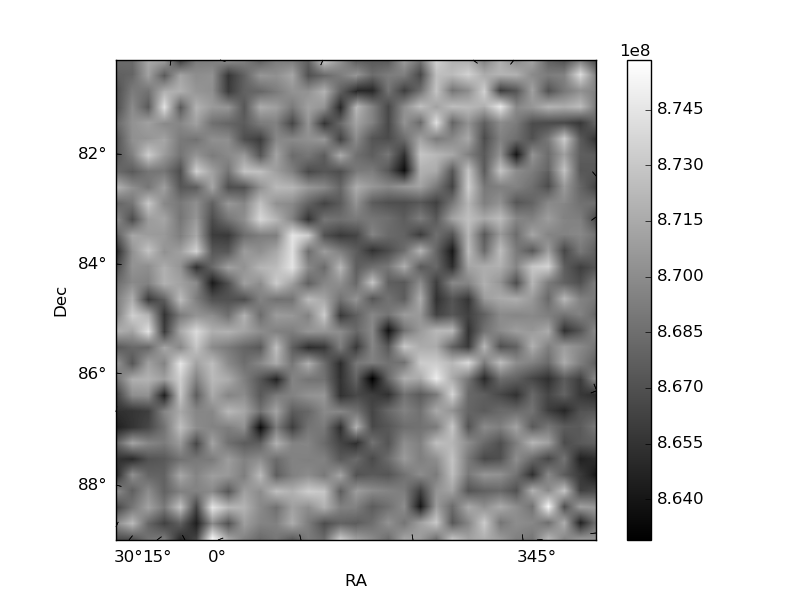
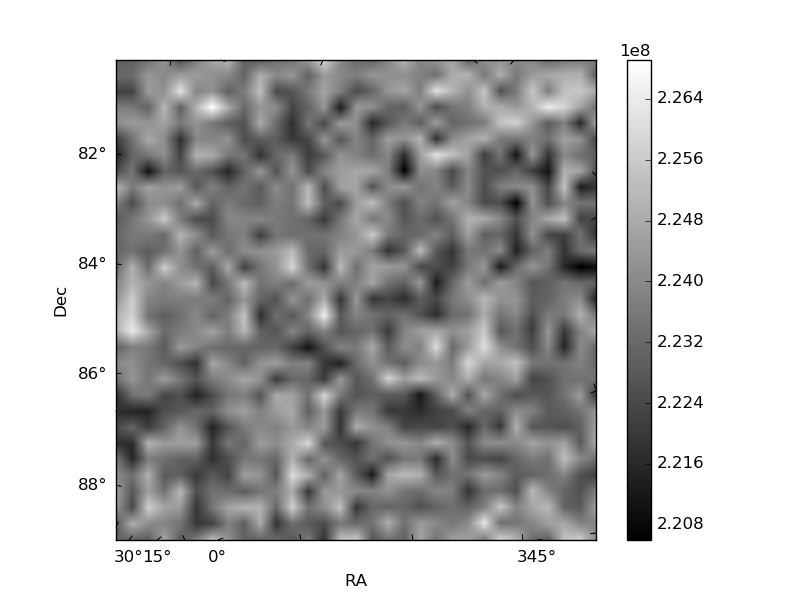
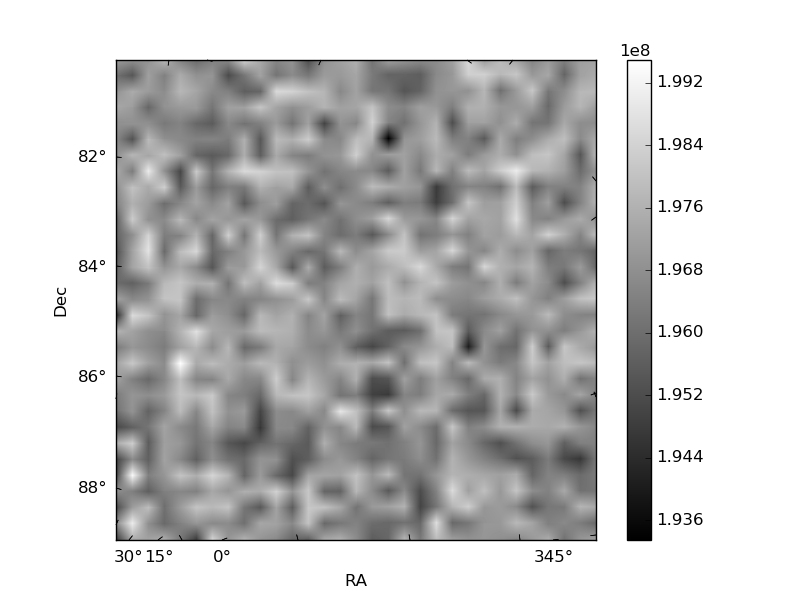
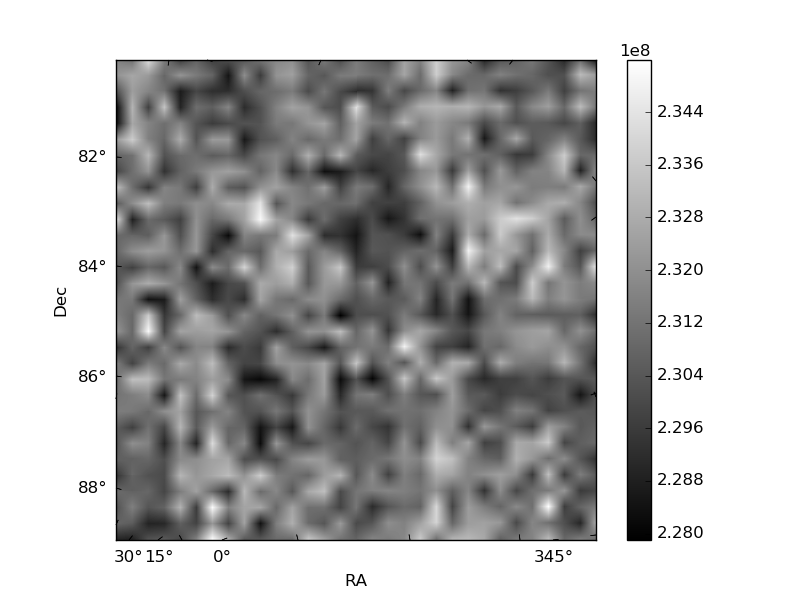
Histogram calculated using DETX and DETY for each event in the final _common_clean file
| Quadrant A | 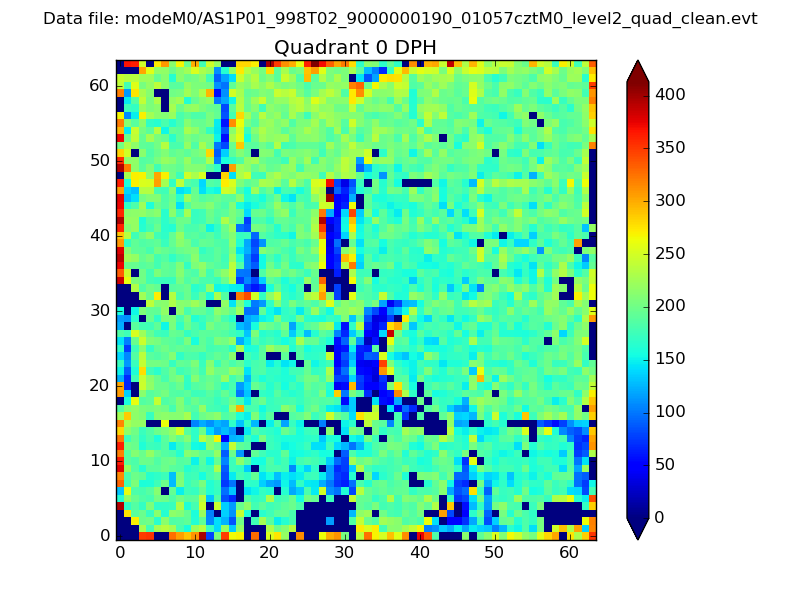 |
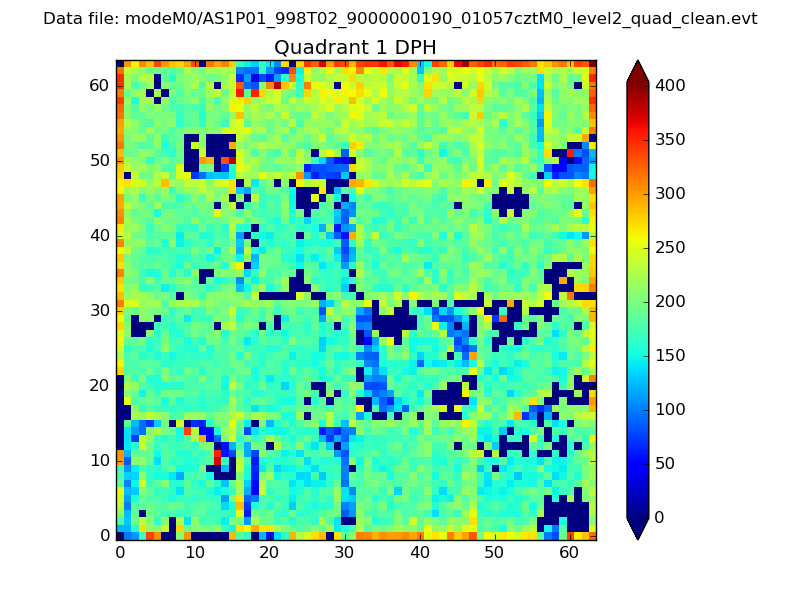 |
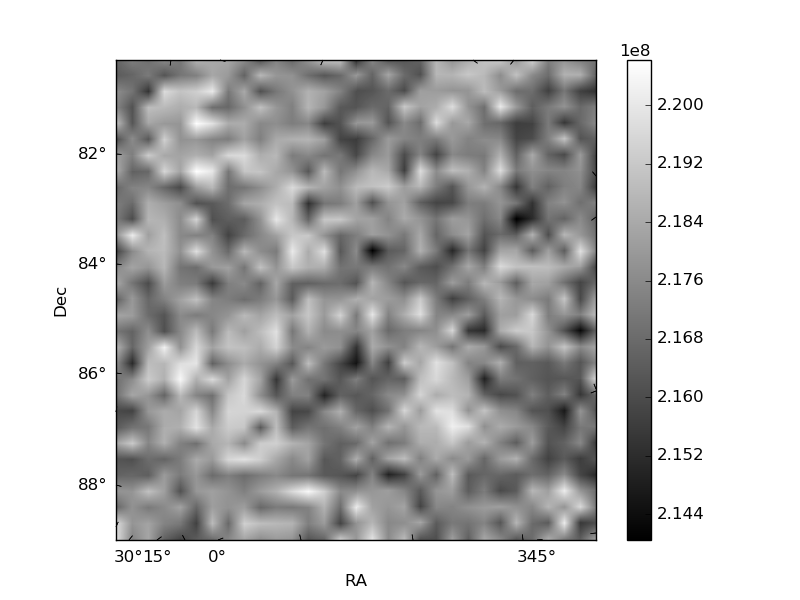
Quadrant B |
|---|---|---|---|
| Quadrant D | 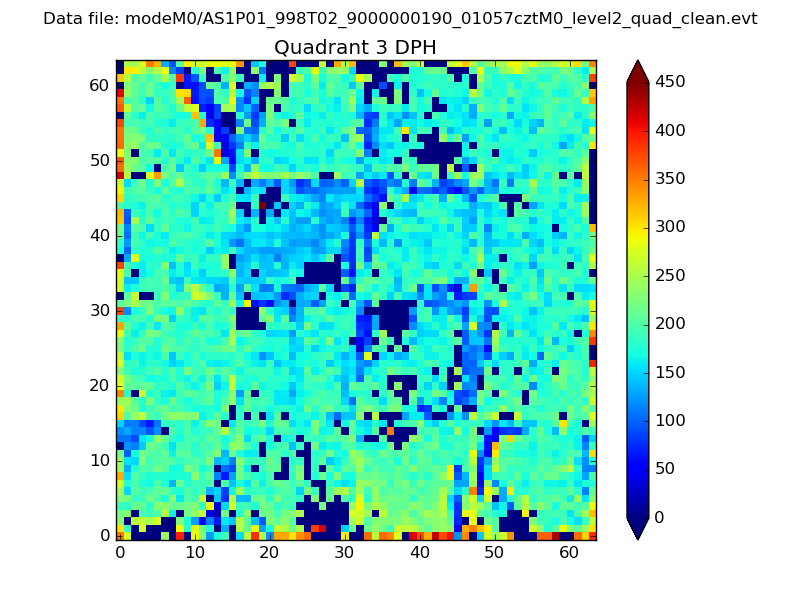 |
 |
Quadrant C |
| Plot type | Count rate plots | Images |
|---|---|---|
| Comparison with Poisson distribution Blue bars denote a histogram of data divided into 1 sec bins. Red curve is a Poisson curve with rate = median count rate of data. |
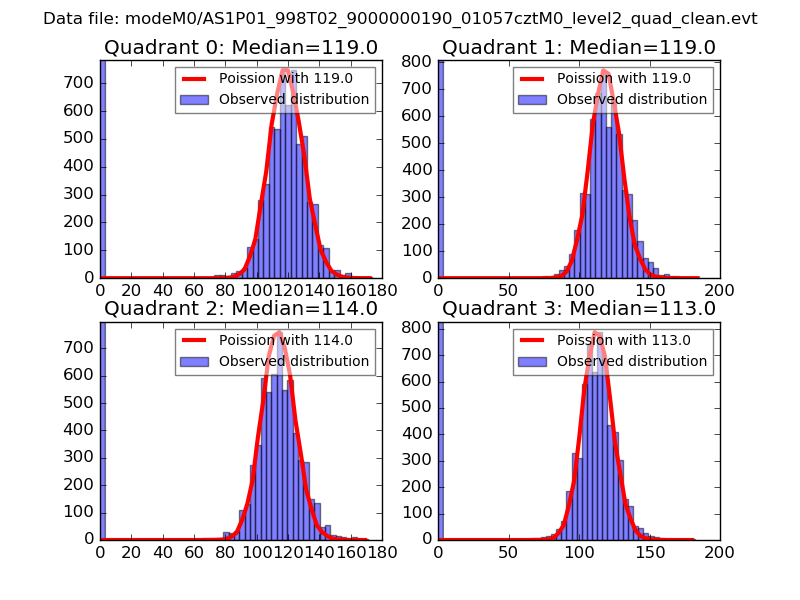 |
 |
| Quadrant-wise count rates Data is divided into 100 sec bins |
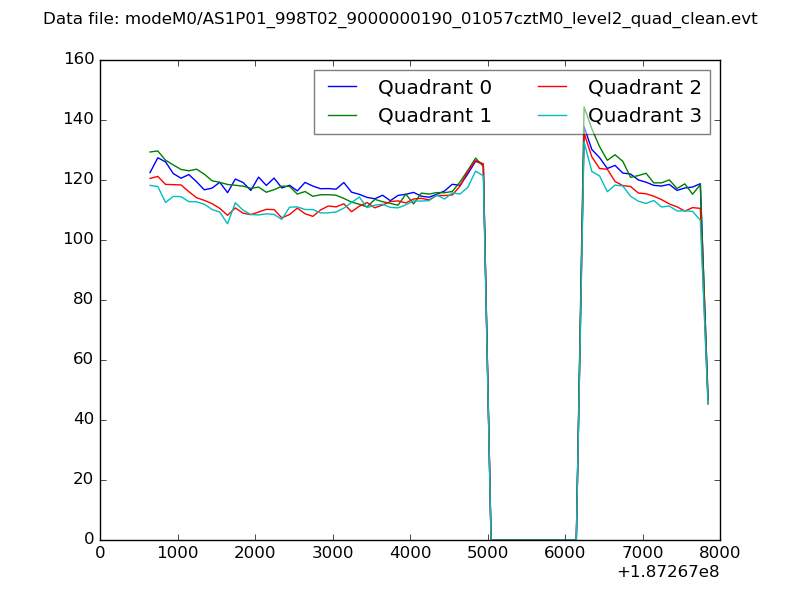 |
|
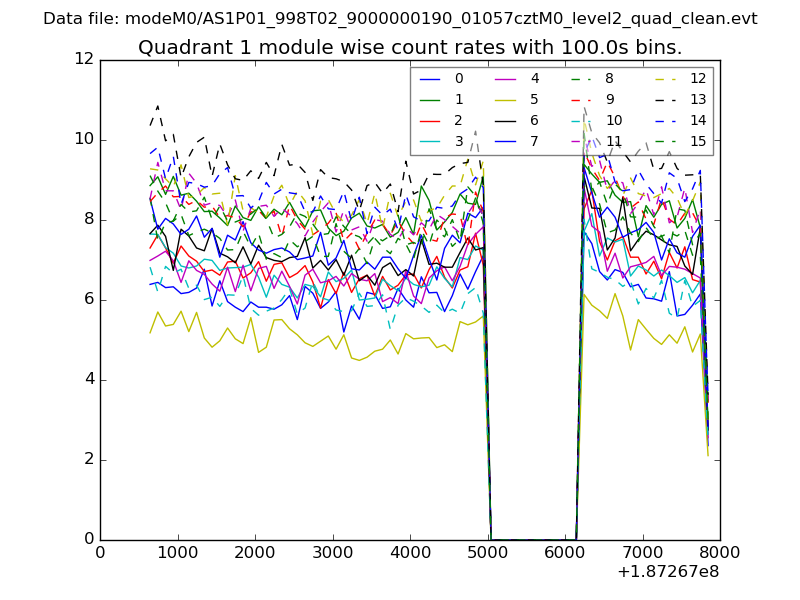
| Module-wise count rates for Quadrant A Data is divided into 100 sec bins |
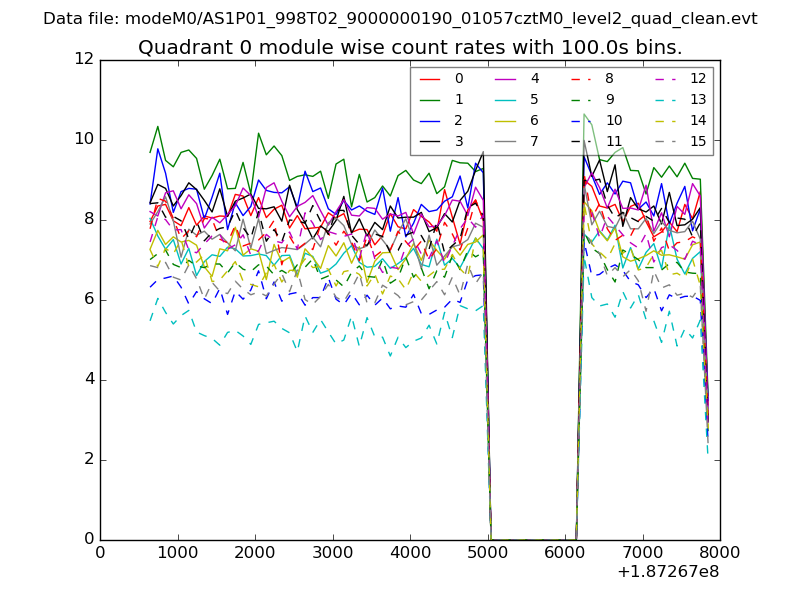 |
 |
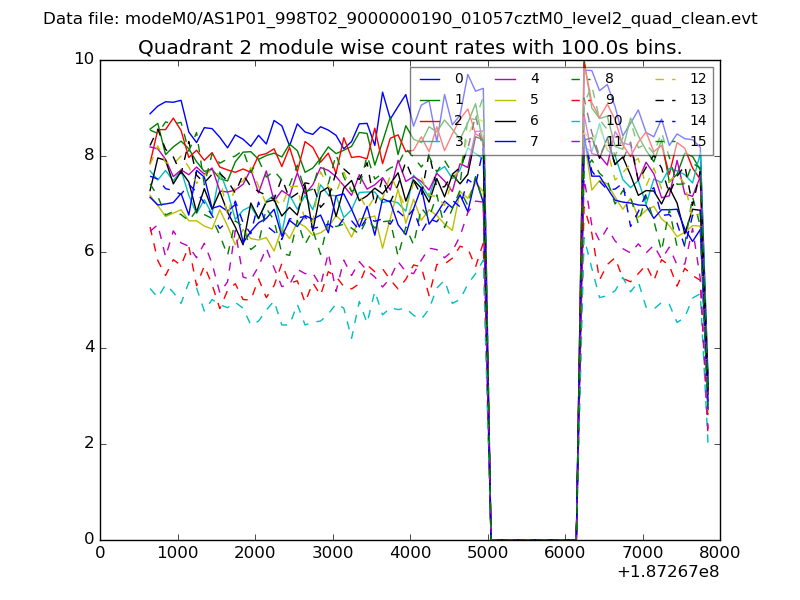
| Module-wise count rates for Quadrant B Data is divided into 100 sec bins |
 |
 |
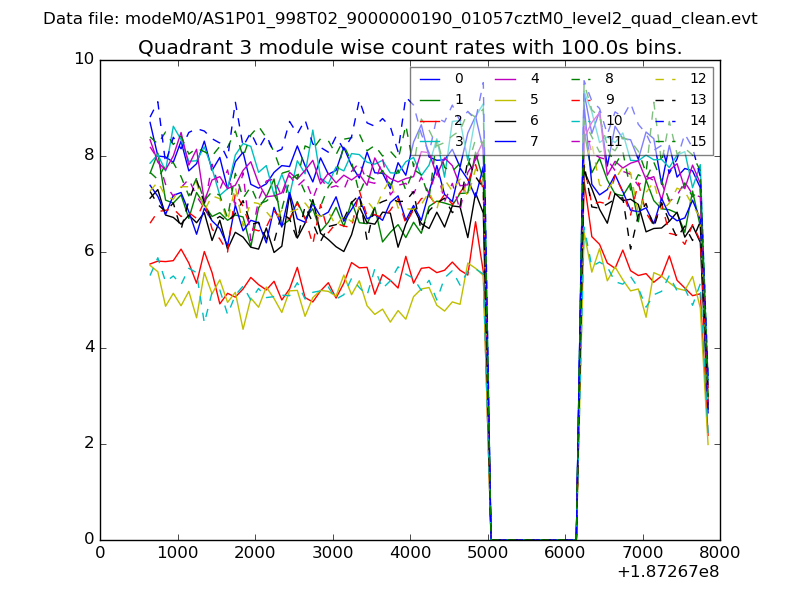
| Module-wise count rates for Quadrant C Data is divided into 100 sec bins |
 |
 |
| Module-wise count rates for Quadrant D Data is divided into 100 sec bins |
 |
 |
| Parameter | Plot |
|---|---|
| CZT HV Monitor | 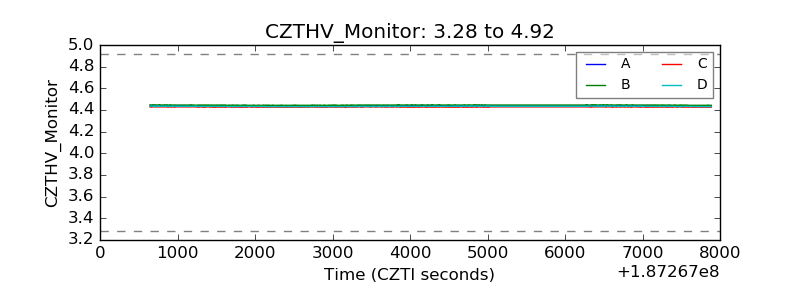 |
| D_VDD | 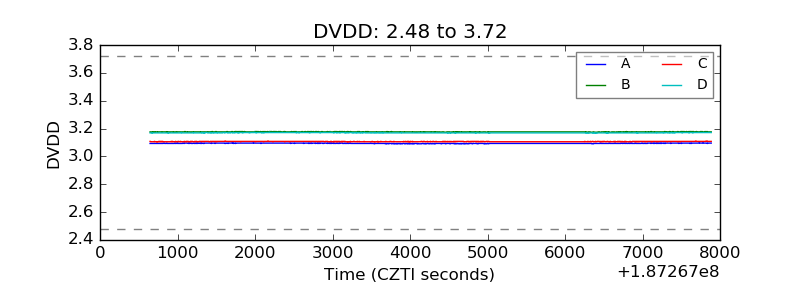 |
| Temperature 1 | 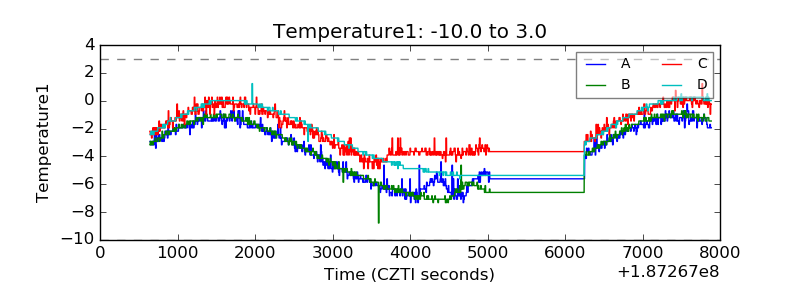 |
| Veto HV Monitor | 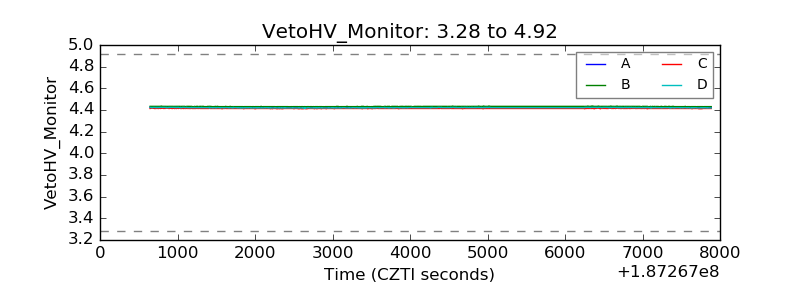 |
| Veto LLD |  |
| Alpha Counter | 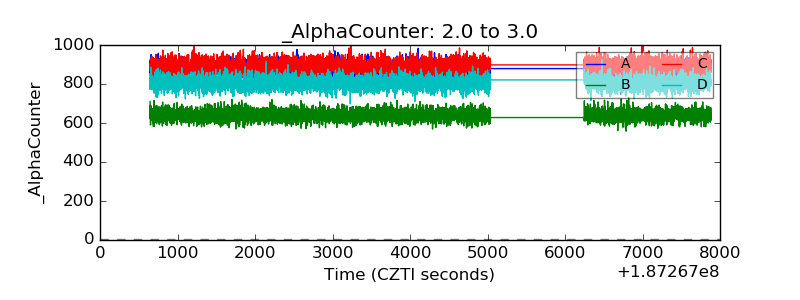 |
| _CPM_Rate | 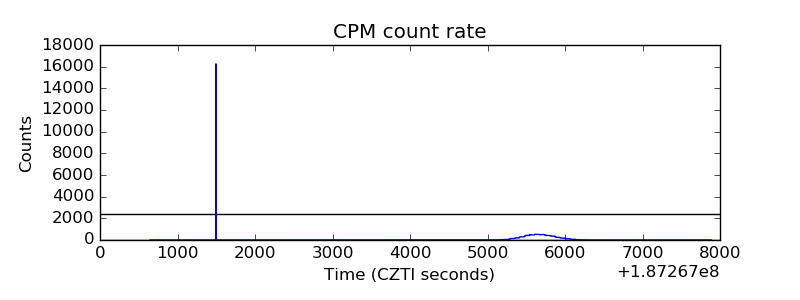 |
| CZT Counter | 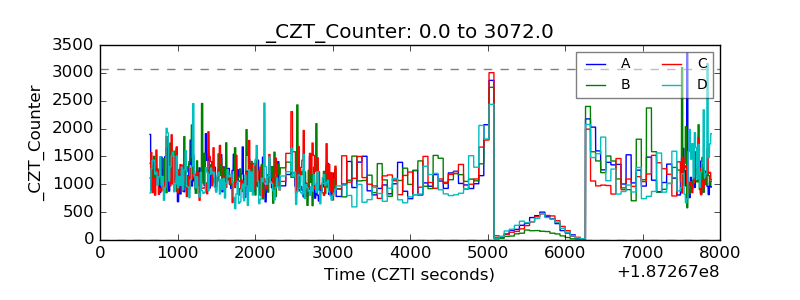 |
| +2.5 Volts monitor |  |
| +5 Volts monitor |  |
| _ROLL_ROT | 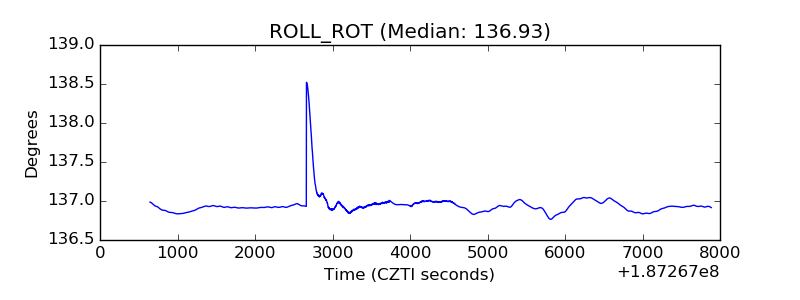 |
| _Roll_DEC | 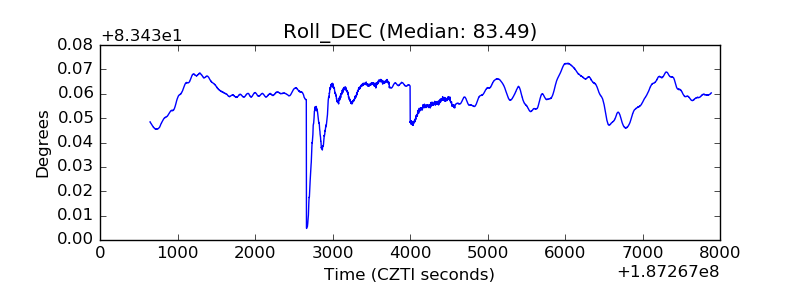 |
| _Roll_RA | 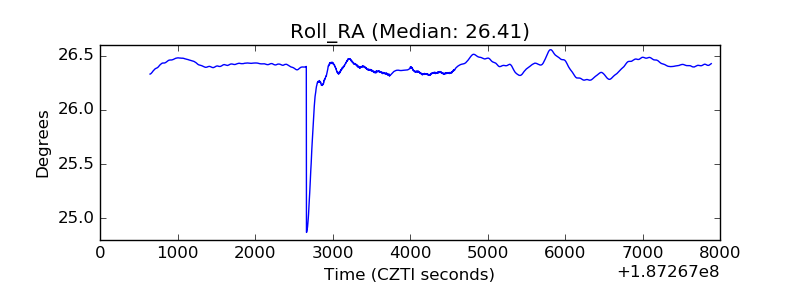 |
| Veto Counter | 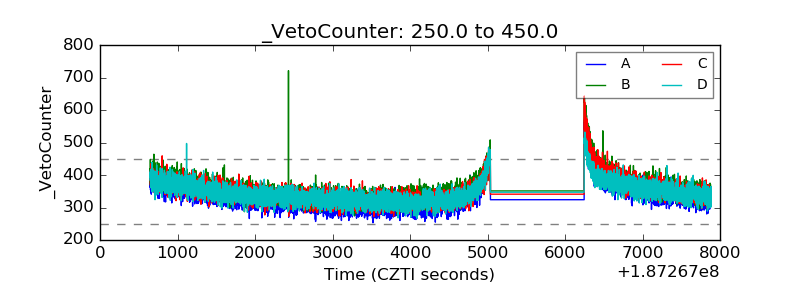 |