| Param | Original file | Final file |
|---|---|---|
| Filename | modeM0/AS1P01_998T02_9000000190_01058cztM0_level2.evt | modeM0/AS1P01_998T02_9000000190_01058cztM0_level2_quad_clean.evt |
| Size (bytes) | 1,114,390,080 | 105,972,480 |
| Size | 1.0 GB | 101.1 MB |
| Events in quadrant A | 7,556,193 | 726,364 |
| Events in quadrant B | 7,910,732 | 725,386 |
| Events in quadrant C | 7,588,525 | 702,249 |
| Events in quadrant D | 10,278,699 | 617,206 |
| Mode M0 | |||
|---|---|---|---|
| Quadrant | BADHDUFLAG | Total packets | Discarded packets |
| A | 0 | 26914 | 1 |
| B | 0 | 27930 | 1 |
| C | 0 | 26971 | 1 |
| D | 0 | 35182 | 1 |
| Mode SS | |||
|---|---|---|---|
| Quadrant | BADHDUFLAG | Total packets | Discarded packets |
| A | 0 | 126 | 0 |
| B | 0 | 126 | 0 |
| C | 0 | 126 | 0 |
| D | 0 | 126 | 0 |
| Mode M9 | |||
|---|---|---|---|
| Quadrant | BADHDUFLAG | Total packets | Discarded packets |
| A | 0 | 10 | 0 |
| B | 0 | 10 | 0 |
| C | 0 | 10 | 0 |
| D | 0 | 10 | 0 |
| Quadrant | Total seconds | Saturated seconds | Saturation percentage |
|---|---|---|---|
| A | 6279 | 61 | 0.971492% |
| B | 6279 | 61 | 0.971492% |
| C | 6280 | 38 | 0.605096% |
| D | 6280 | 1177 | 18.742038% |
Noise dominated data is calculated using 1-second bins in cleaned event files. If a bin has >2000 counts, and if more than 50% of those come from <1% of pixels, then it is considered to be noise-dominated and hence unusable.
| Quadrant | # 1 sec bins | Bins with >0 counts | Bins with >2000 counts | High rate bins dominated by noise | Noise dominated (total time) | Noise dominated (detector-on time) | Marked lightcurve |
|---|---|---|---|---|---|---|---|
| A | 7274 | 6280 | 292 | 292 | 4.01% | 4.65% | 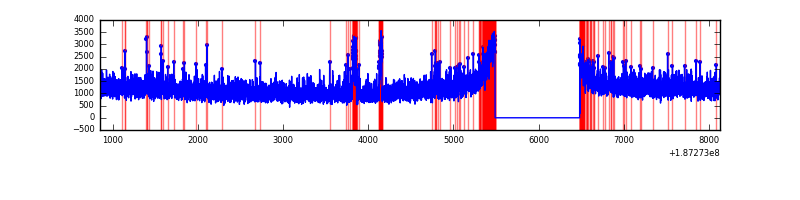 |
| B | 7274 | 6280 | 343 | 343 | 4.72% | 5.46% | 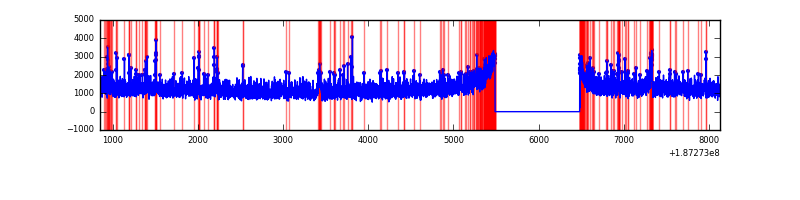 |
| C | 7275 | 6281 | 236 | 236 | 3.24% | 3.76% | 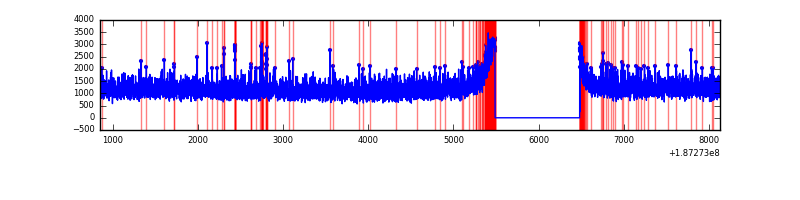 |
| D | 7275 | 6280 | 1526 | 1526 | 20.98% | 24.30% | 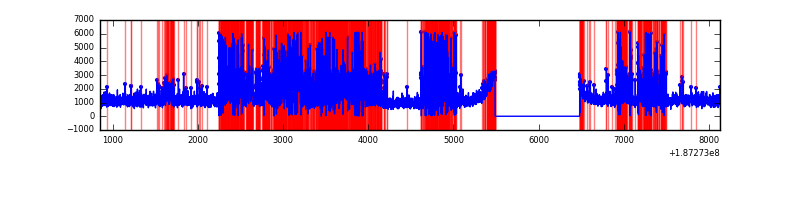 |
Top three noisy pixels from each quadrant. If the there are fewer than three noisy pixels in the level2.evt file, extra rows are filled as -1
| Pixel properties | Quadrant properties | ||||||
|---|---|---|---|---|---|---|---|
| Quadrant | DetID | PixID | Counts | Sigma | Mean | Median | Sigma |
| A | 0 | 253 | 187065 | 404.48 | 1912 | 1921 | 457.7 |
| A | 15 | 127 | 24989 | 50.4 | 1912 | 1921 | 457.7 |
| A | 11 | 79 | 7668 | 12.56 | 1912 | 1921 | 457.7 |
| B | 5 | 249 | 99770 | 211.12 | 1970 | 1973 | 463.2 |
| B | 2 | 32 | 71540 | 150.18 | 1970 | 1973 | 463.2 |
| B | 15 | 22 | 53662 | 111.58 | 1970 | 1973 | 463.2 |
| C | 15 | 241 | 331858 | 651.22 | 1825 | 1890 | 506.7 |
| C | 7 | 207 | 54097 | 103.03 | 1825 | 1890 | 506.7 |
| C | 3 | 79 | 41035 | 77.26 | 1825 | 1890 | 506.7 |
| D | 2 | 25 | 61318 | 125.96 | 1677 | 1729 | 473.1 |
| D | 2 | 14 | 61030 | 125.35 | 1677 | 1729 | 473.1 |
| D | 2 | 40 | 61017 | 125.32 | 1677 | 1729 | 473.1 |
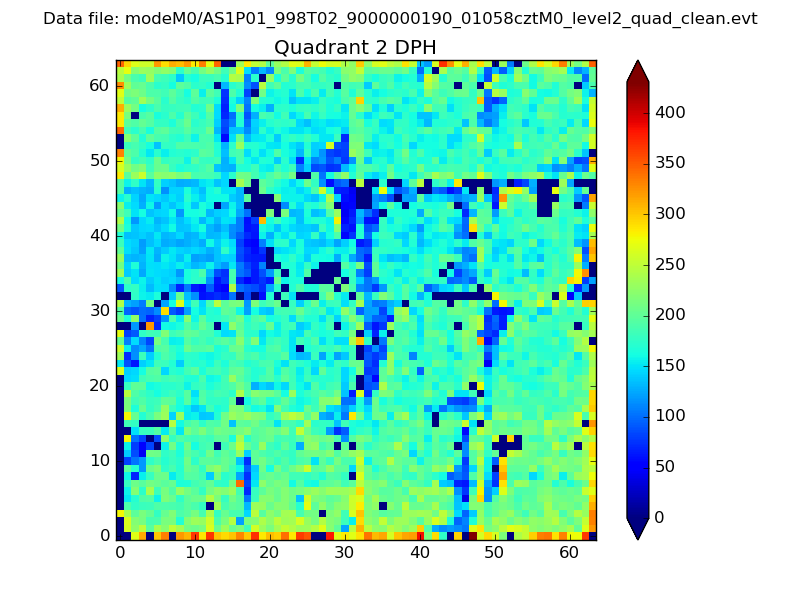
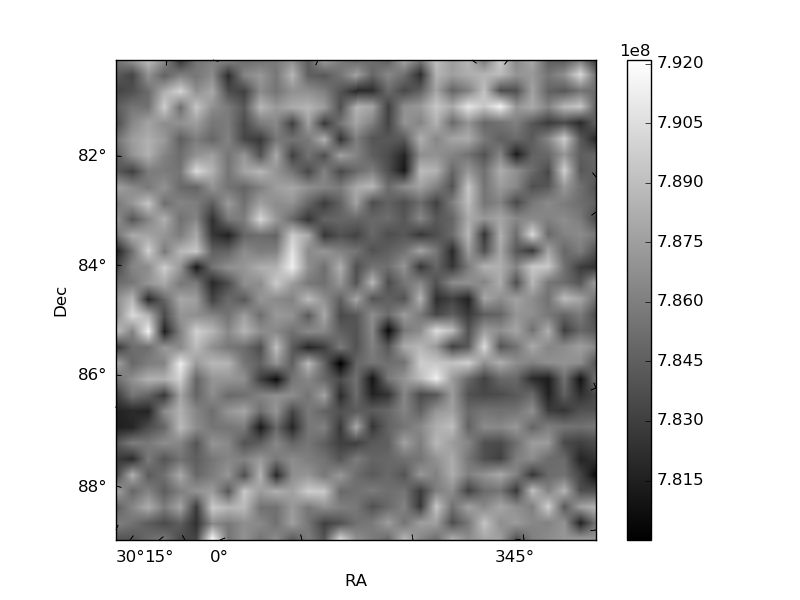
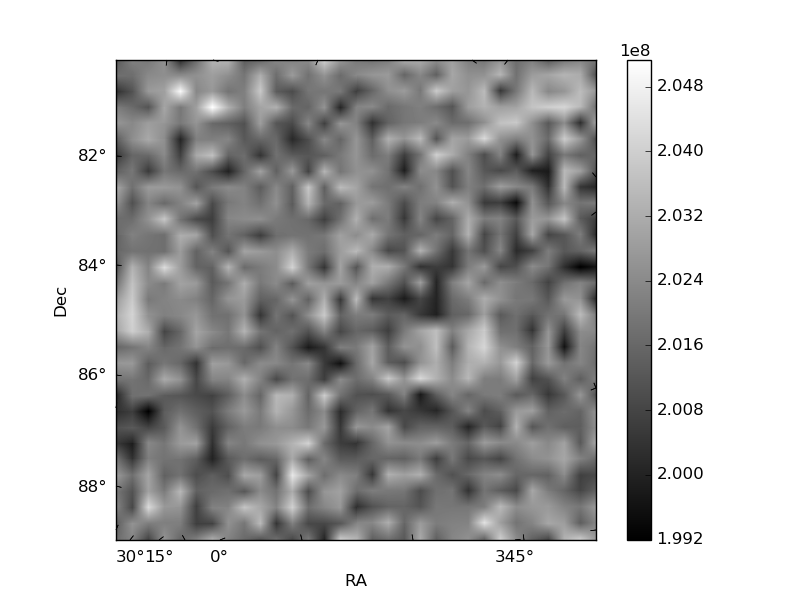
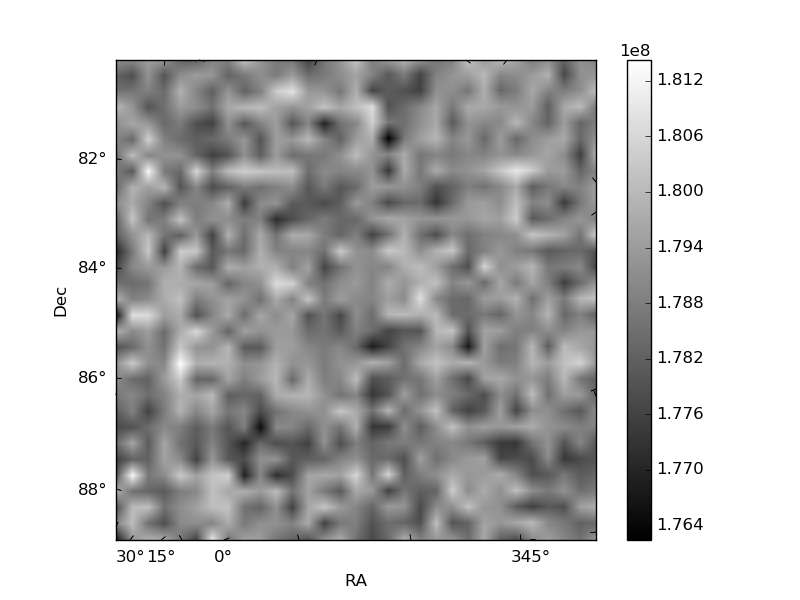
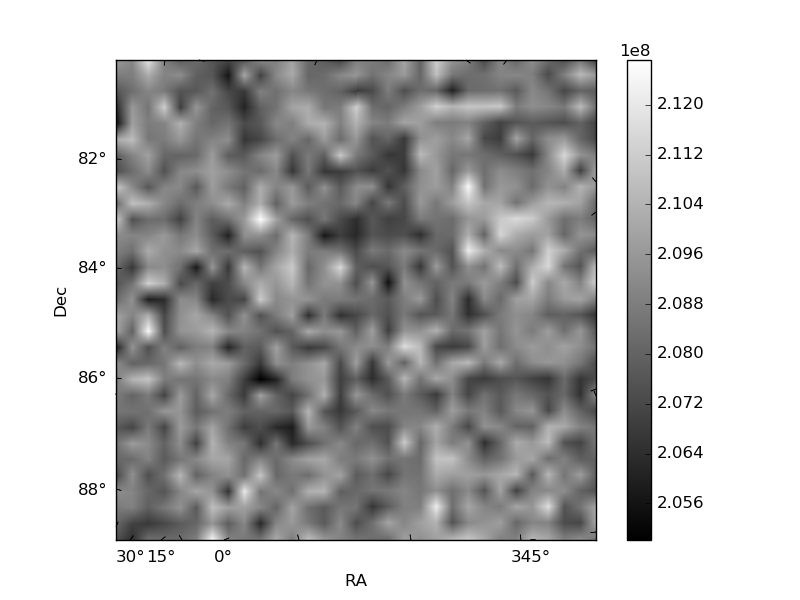
Histogram calculated using DETX and DETY for each event in the final _common_clean file
| Quadrant A | 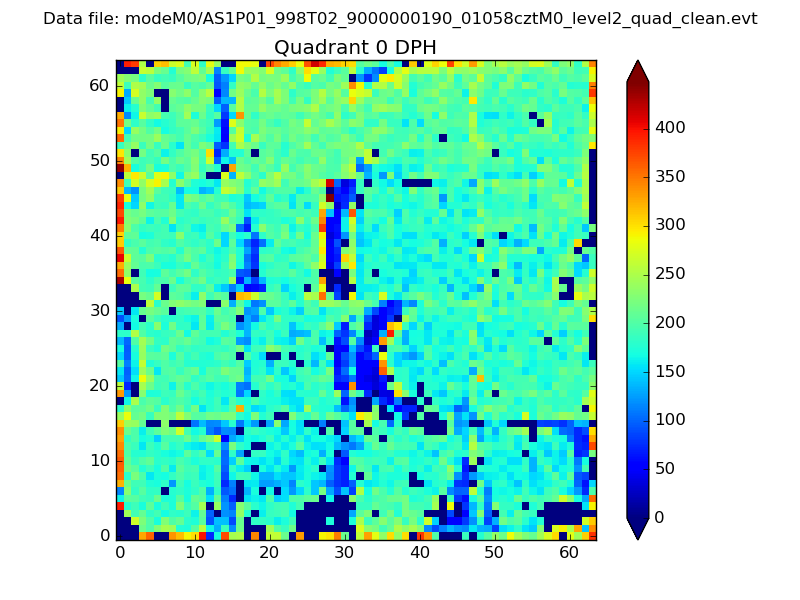 |
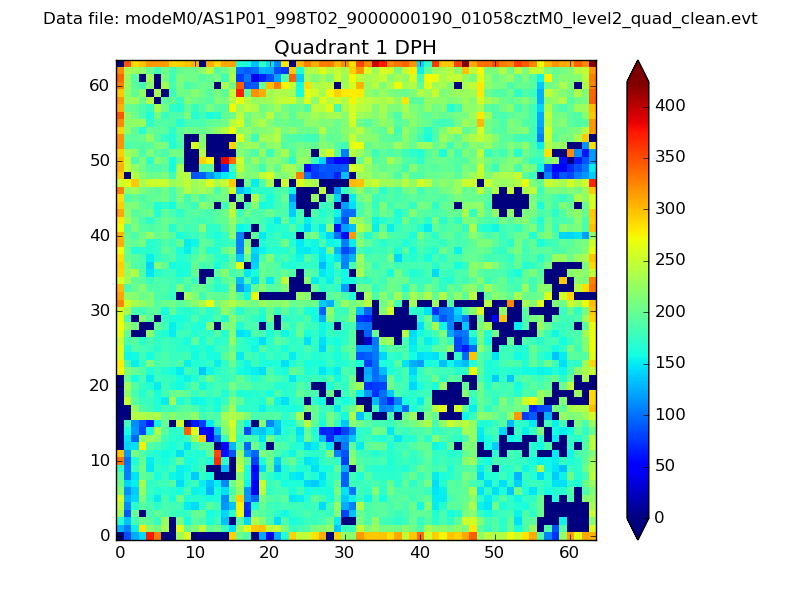 |
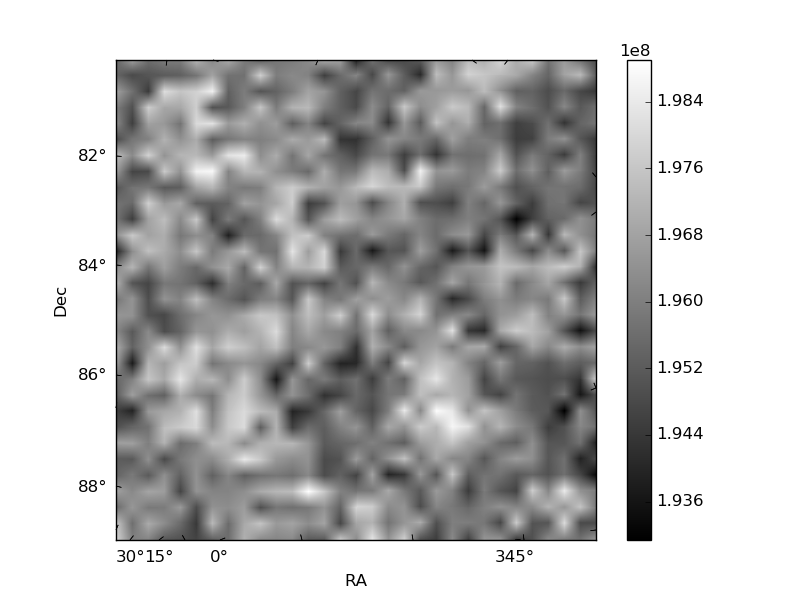
Quadrant B |
|---|---|---|---|
| Quadrant D | 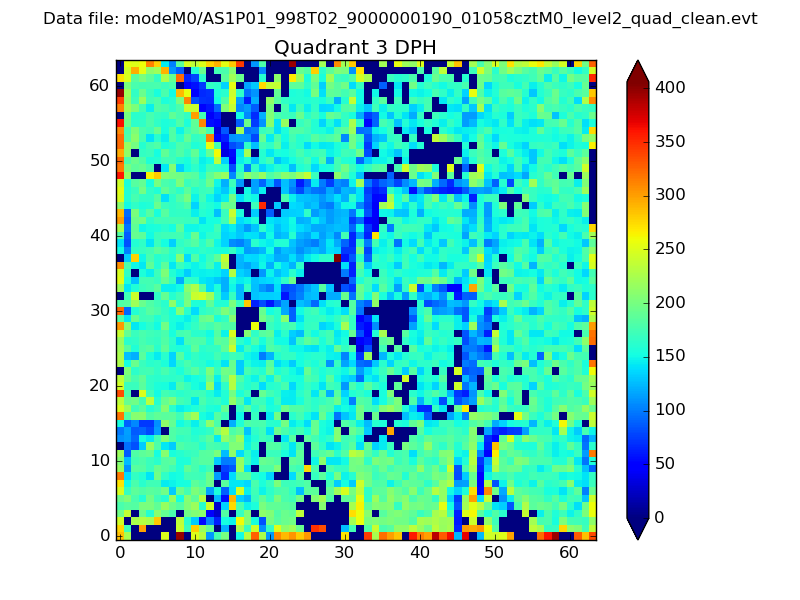 |
 |
Quadrant C |
| Plot type | Count rate plots | Images |
|---|---|---|
| Comparison with Poisson distribution Blue bars denote a histogram of data divided into 1 sec bins. Red curve is a Poisson curve with rate = median count rate of data. |
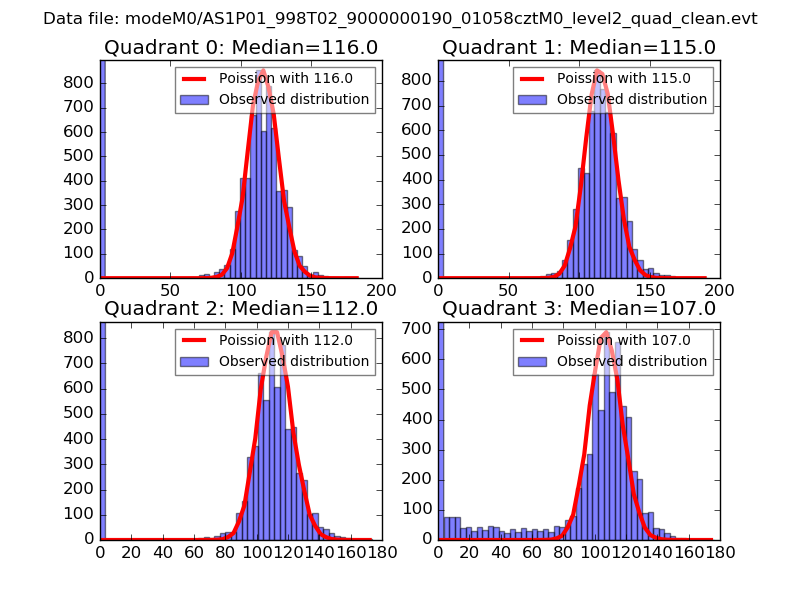 |
 |
| Quadrant-wise count rates Data is divided into 100 sec bins |
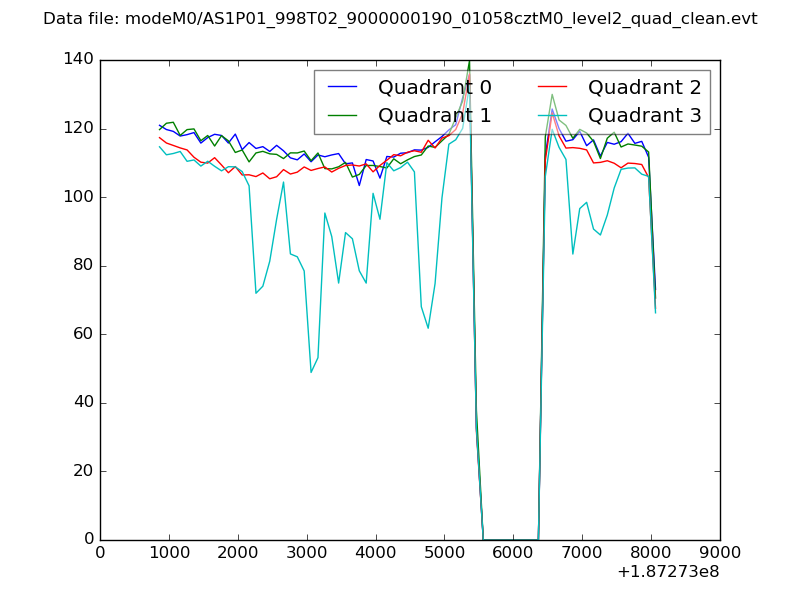 |
|
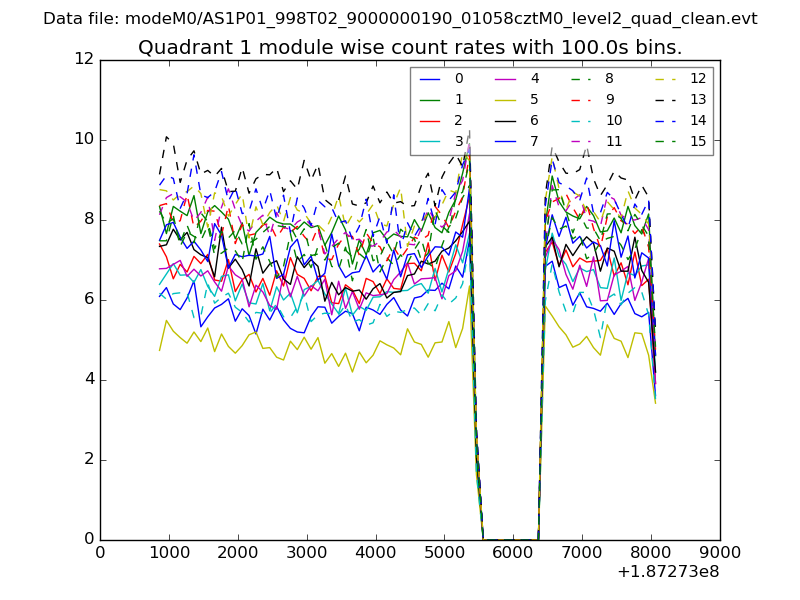
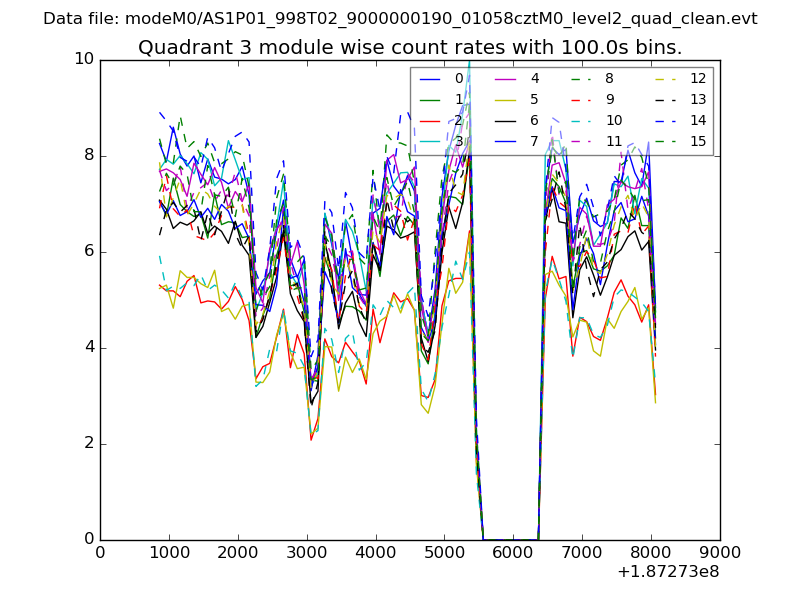
| Module-wise count rates for Quadrant A Data is divided into 100 sec bins |
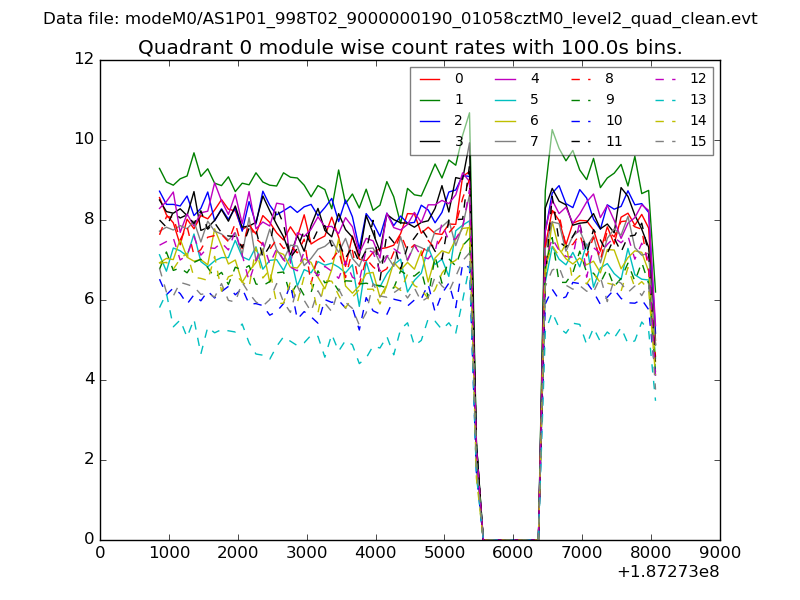 |
 |
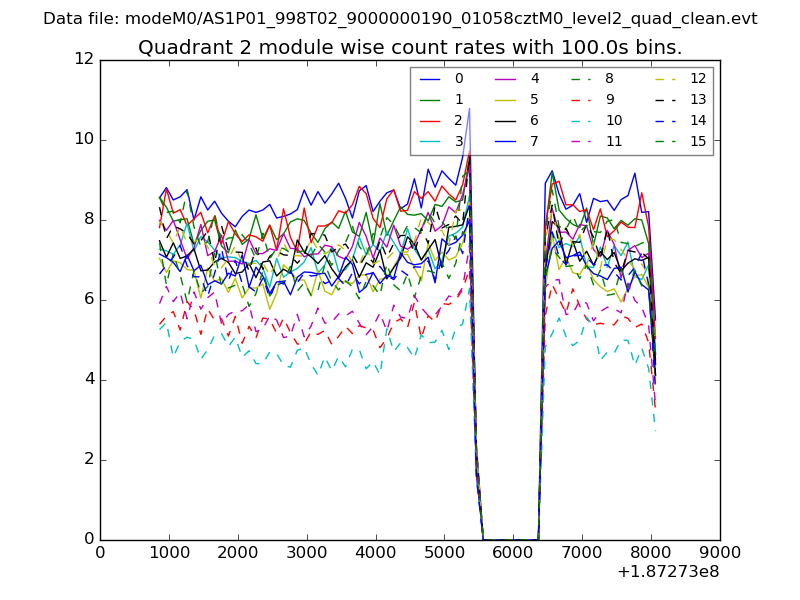
| Module-wise count rates for Quadrant B Data is divided into 100 sec bins |
 |
 |
| Module-wise count rates for Quadrant C Data is divided into 100 sec bins |
 |
 |
| Module-wise count rates for Quadrant D Data is divided into 100 sec bins |
 |
 |
| Parameter | Plot |
|---|---|
| CZT HV Monitor | 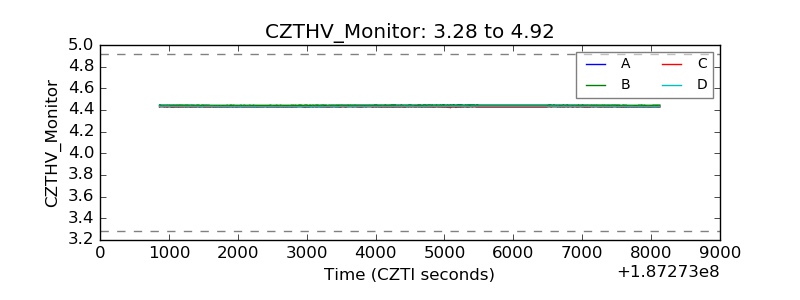 |
| D_VDD | 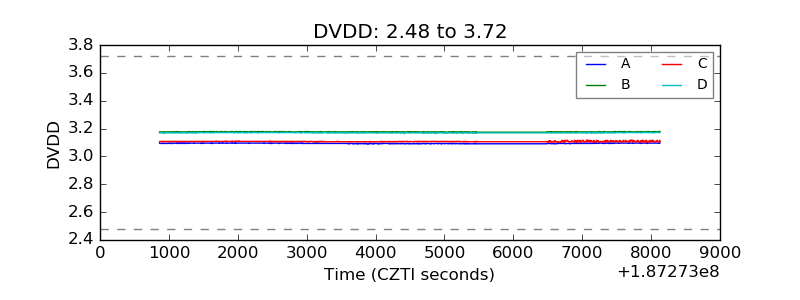 |
| Temperature 1 |  |
| Veto HV Monitor | 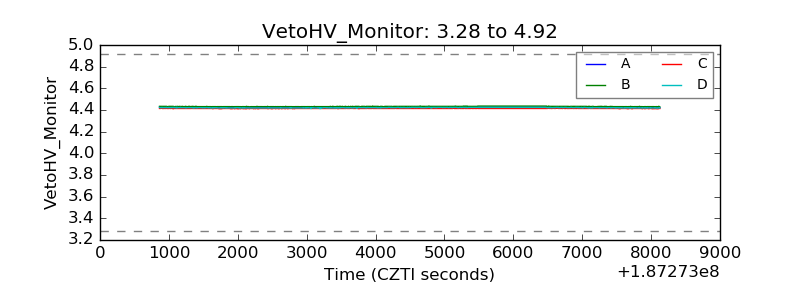 |
| Veto LLD | 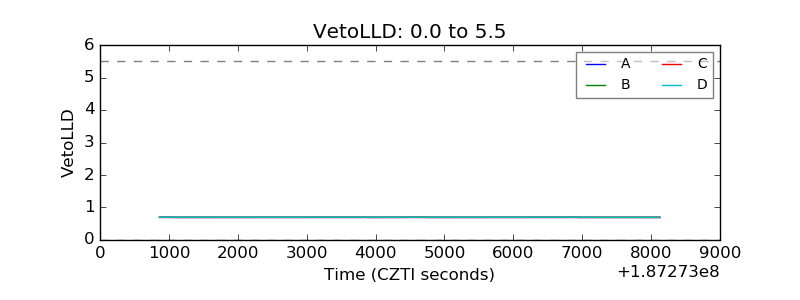 |
| Alpha Counter | 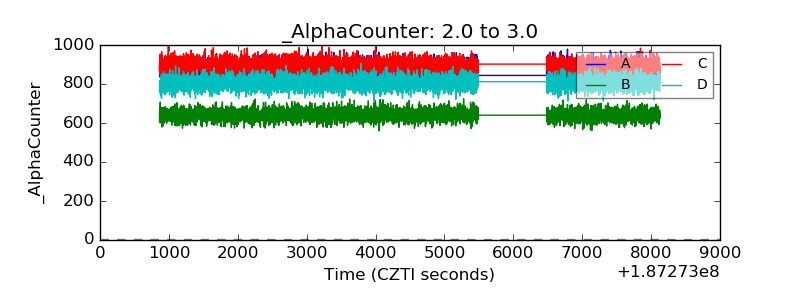 |
| _CPM_Rate |  |
| CZT Counter | 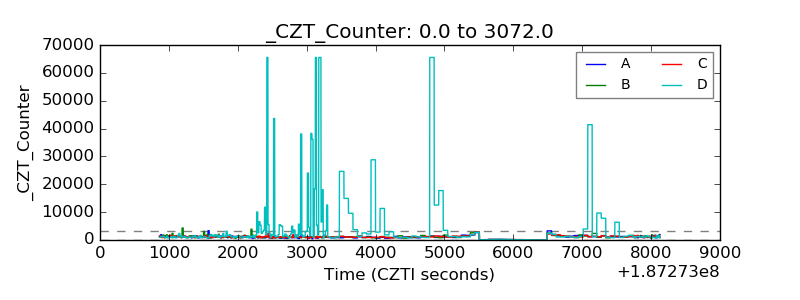 |
| +2.5 Volts monitor |  |
| +5 Volts monitor |  |
| _ROLL_ROT | 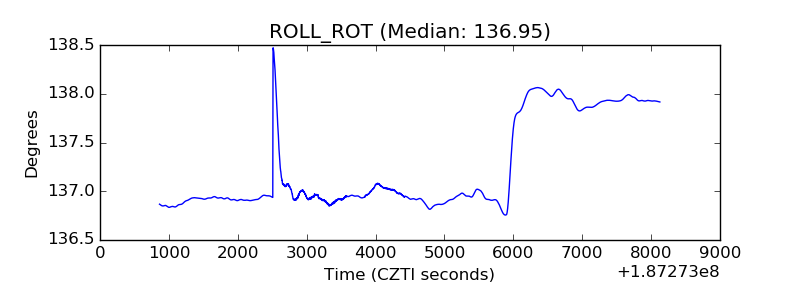 |
| _Roll_DEC | 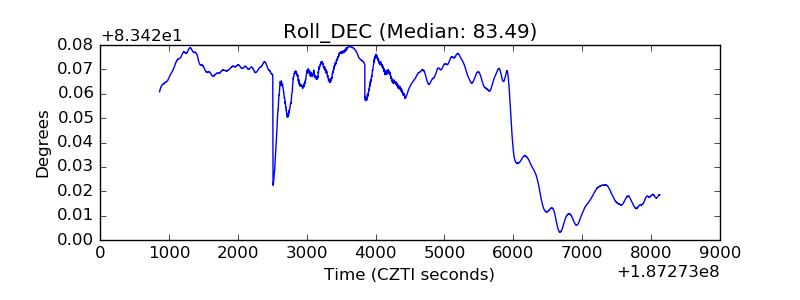 |
| _Roll_RA | 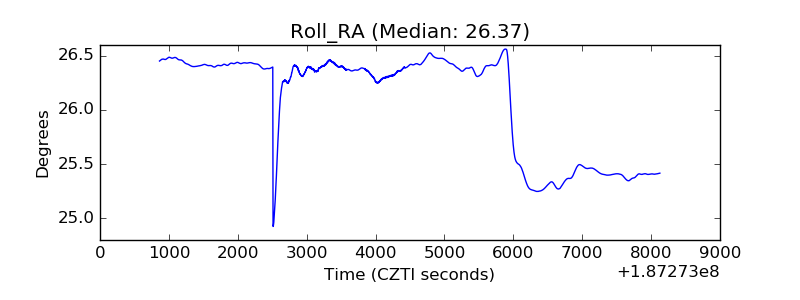 |
| Veto Counter | 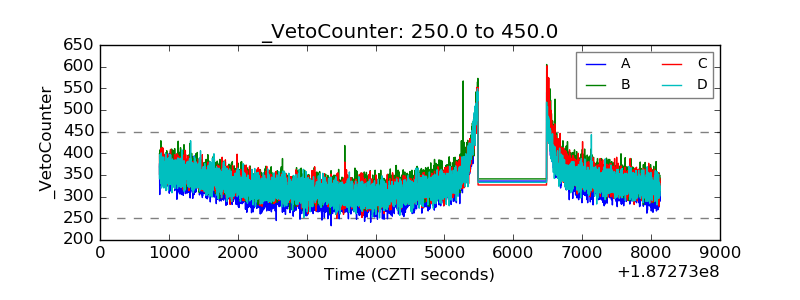 |