| Param | Original file | Final file |
|---|---|---|
| Filename | modeM0/AS1P01_998T02_9000000190_01059cztM0_level2.evt | modeM0/AS1P01_998T02_9000000190_01059cztM0_level2_quad_clean.evt |
| Size (bytes) | 1,102,746,240 | 114,517,440 |
| Size | 1.0 GB | 109.2 MB |
| Events in quadrant A | 8,030,368 | 767,476 |
| Events in quadrant B | 8,346,330 | 773,991 |
| Events in quadrant C | 8,187,236 | 746,361 |
| Events in quadrant D | 8,381,362 | 706,046 |
| Mode M0 | |||
|---|---|---|---|
| Quadrant | BADHDUFLAG | Total packets | Discarded packets |
| A | 0 | 28666 | 2 |
| B | 0 | 29637 | 2 |
| C | 0 | 29142 | 3 |
| D | 0 | 29820 | 2 |
| Mode SS | |||
|---|---|---|---|
| Quadrant | BADHDUFLAG | Total packets | Discarded packets |
| A | 0 | 138 | 0 |
| B | 0 | 138 | 0 |
| C | 0 | 138 | 0 |
| D | 0 | 138 | 0 |
| Mode M9 | |||
|---|---|---|---|
| Quadrant | BADHDUFLAG | Total packets | Discarded packets |
| A | 0 | 7 | 0 |
| B | 0 | 7 | 0 |
| C | 0 | 7 | 0 |
| D | 0 | 7 | 0 |
| Quadrant | Total seconds | Saturated seconds | Saturation percentage |
|---|---|---|---|
| A | 6808 | 34 | 0.499412% |
| B | 6808 | 35 | 0.514101% |
| C | 6807 | 23 | 0.337887% |
| D | 6807 | 471 | 6.919348% |
Noise dominated data is calculated using 1-second bins in cleaned event files. If a bin has >2000 counts, and if more than 50% of those come from <1% of pixels, then it is considered to be noise-dominated and hence unusable.
| Quadrant | # 1 sec bins | Bins with >0 counts | Bins with >2000 counts | High rate bins dominated by noise | Noise dominated (total time) | Noise dominated (detector-on time) | Marked lightcurve |
|---|---|---|---|---|---|---|---|
| A | 7523 | 6810 | 252 | 252 | 3.35% | 3.70% | 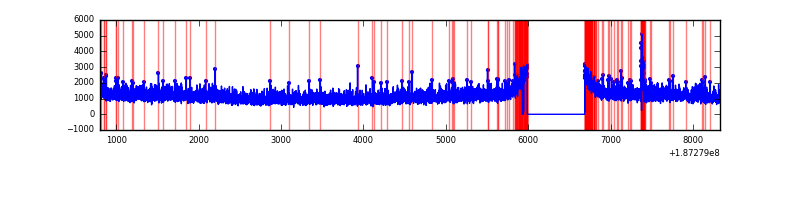 |
| B | 7523 | 6810 | 270 | 270 | 3.59% | 3.96% | 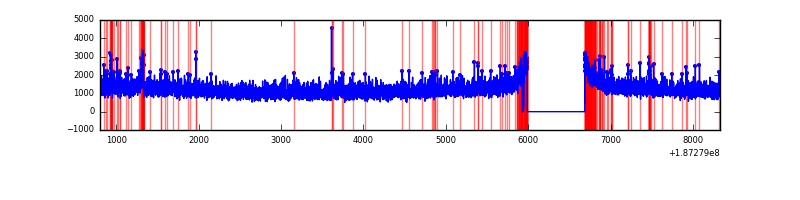 |
| C | 7522 | 6809 | 224 | 224 | 2.98% | 3.29% | 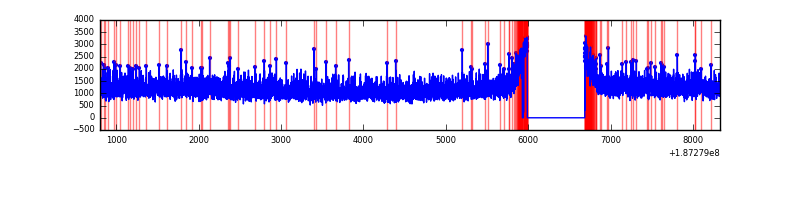 |
| D | 7521 | 6808 | 589 | 589 | 7.83% | 8.65% | 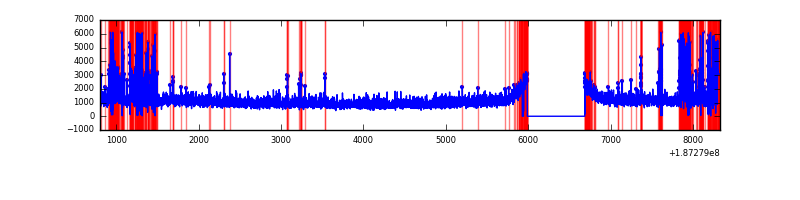 |
Top three noisy pixels from each quadrant. If the there are fewer than three noisy pixels in the level2.evt file, extra rows are filled as -1
| Pixel properties | Quadrant properties | ||||||
|---|---|---|---|---|---|---|---|
| Quadrant | DetID | PixID | Counts | Sigma | Mean | Median | Sigma |
| A | 15 | 233 | 77297 | 153.28 | 2055 | 2071 | 490.8 |
| A | 15 | 127 | 47203 | 91.96 | 2055 | 2071 | 490.8 |
| A | 13 | 9 | 11503 | 19.22 | 2055 | 2071 | 490.8 |
| B | 5 | 249 | 72814 | 141.07 | 2132 | 2136 | 501.0 |
| B | 15 | 22 | 60875 | 117.24 | 2132 | 2136 | 501.0 |
| B | 4 | 185 | 42484 | 80.53 | 2132 | 2136 | 501.0 |
| C | 15 | 241 | 366883 | 659.35 | 1974 | 2039 | 553.3 |
| C | 3 | 79 | 50269 | 87.16 | 1974 | 2039 | 553.3 |
| C | 3 | 111 | 39219 | 67.19 | 1974 | 2039 | 553.3 |
| D | 2 | 152 | 46006 | 77.35 | 1904 | 1942 | 569.7 |
| D | 9 | 64 | 39824 | 66.5 | 1904 | 1942 | 569.7 |
| D | 13 | 73 | 27710 | 45.23 | 1904 | 1942 | 569.7 |
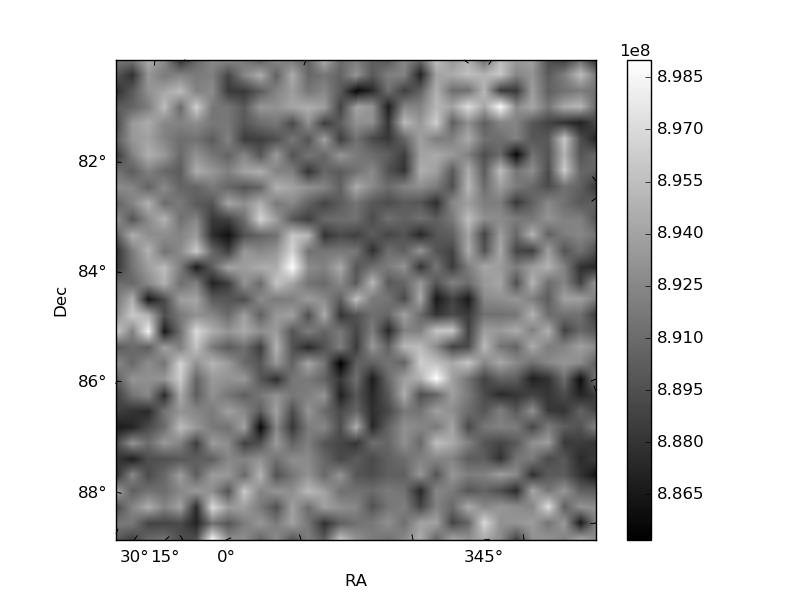
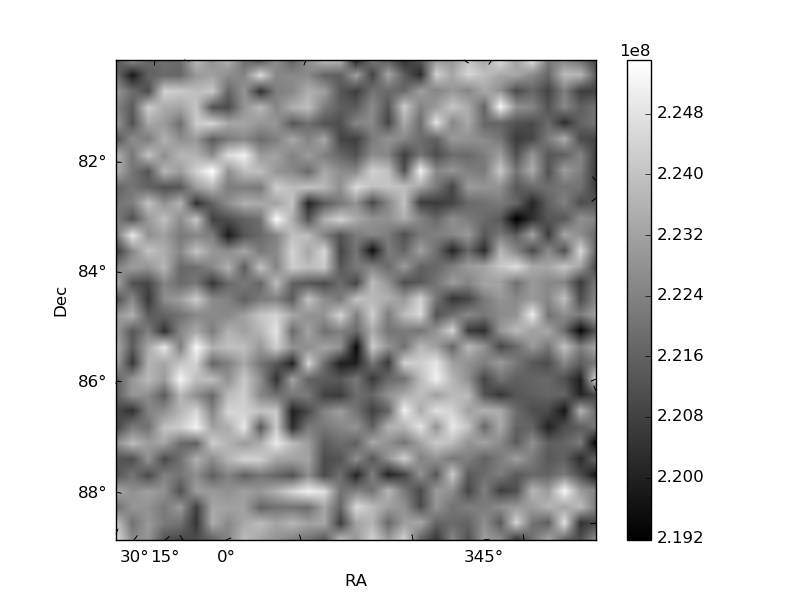
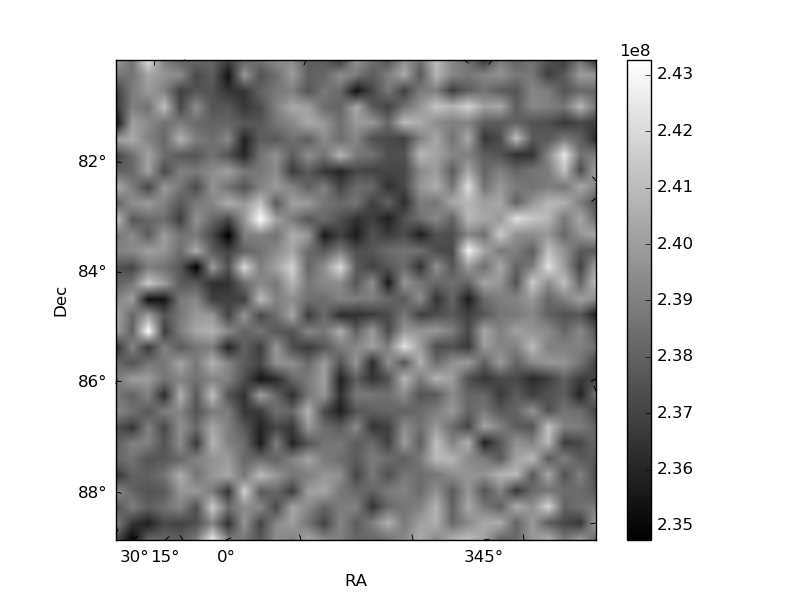
Histogram calculated using DETX and DETY for each event in the final _common_clean file
| Quadrant A | 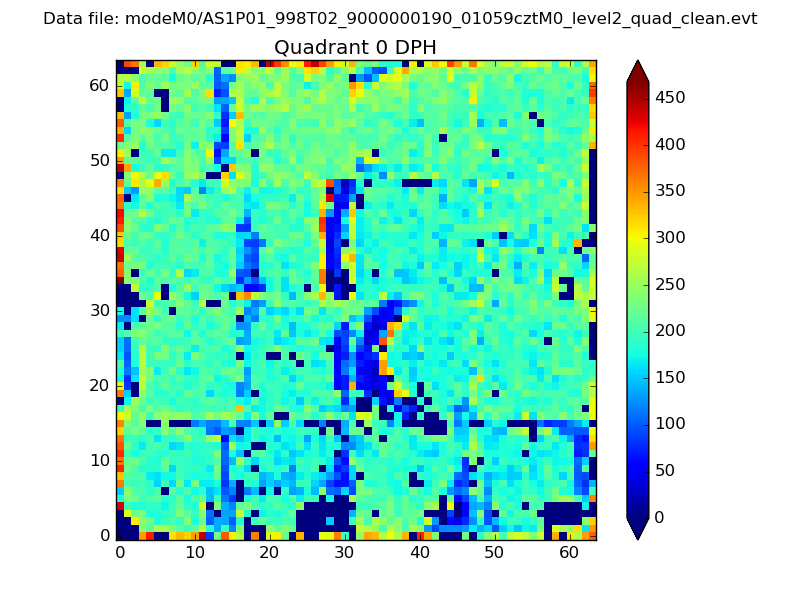 |
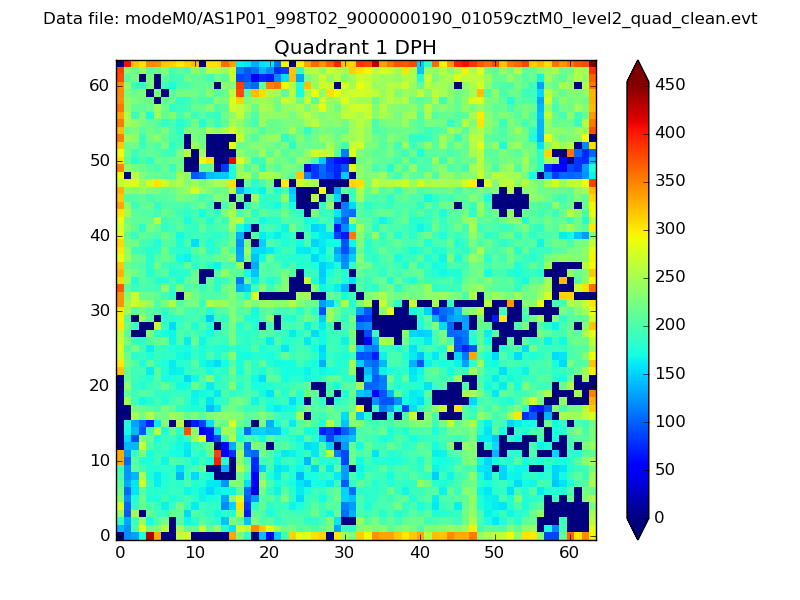 |
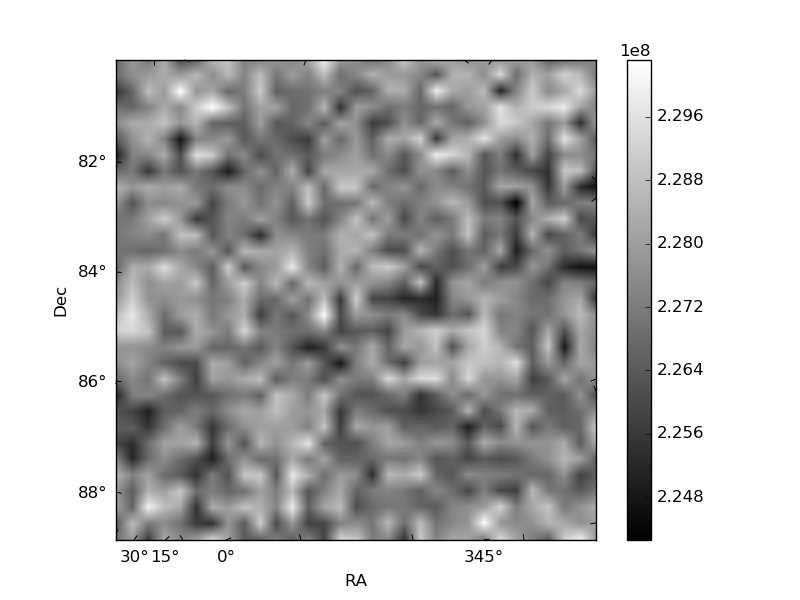
Quadrant B |
|---|---|---|---|
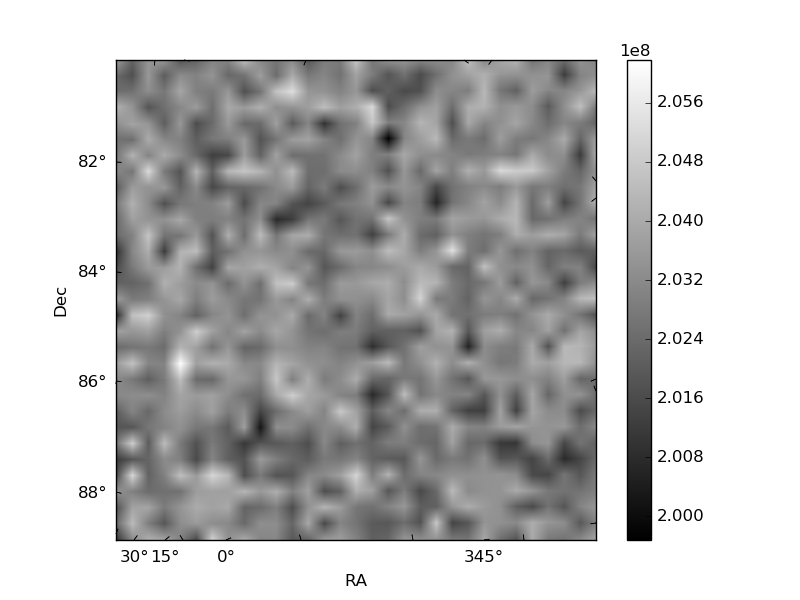
| Quadrant D | 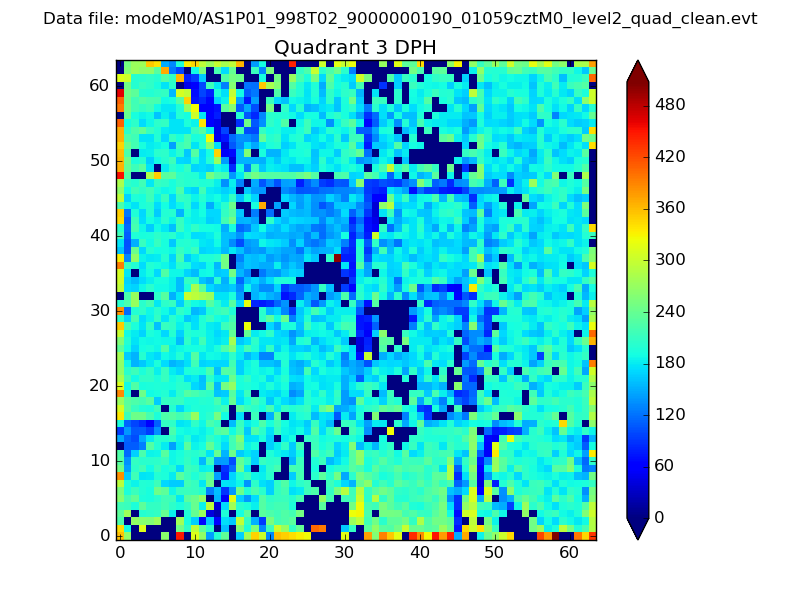 |
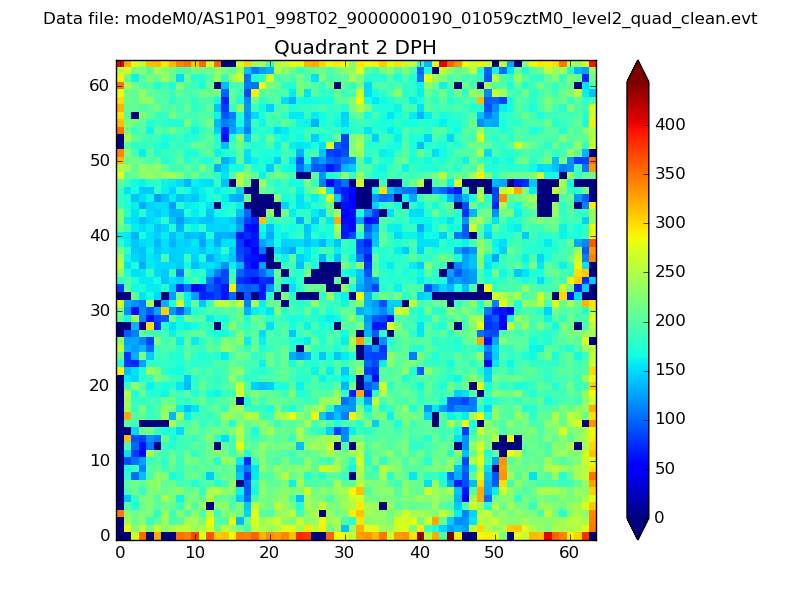 |
Quadrant C |
| Plot type | Count rate plots | Images |
|---|---|---|
| Comparison with Poisson distribution Blue bars denote a histogram of data divided into 1 sec bins. Red curve is a Poisson curve with rate = median count rate of data. |
 |
 |
| Quadrant-wise count rates Data is divided into 100 sec bins |
 |
|
| Module-wise count rates for Quadrant A Data is divided into 100 sec bins |
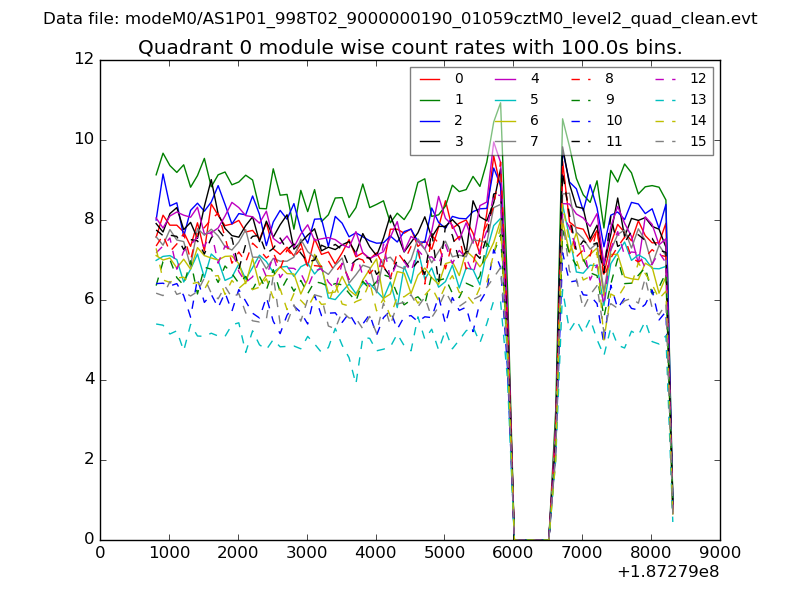 |
 |
| Module-wise count rates for Quadrant B Data is divided into 100 sec bins |
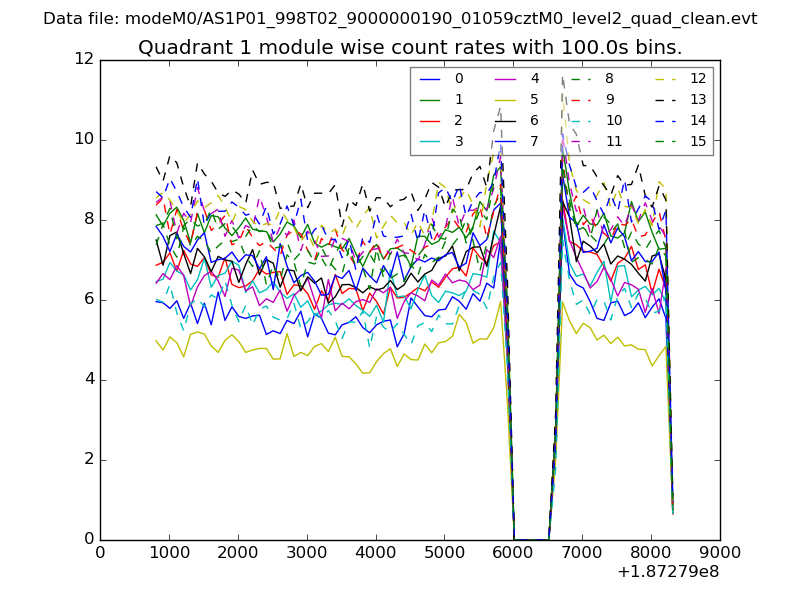 |
 |
| Module-wise count rates for Quadrant C Data is divided into 100 sec bins |
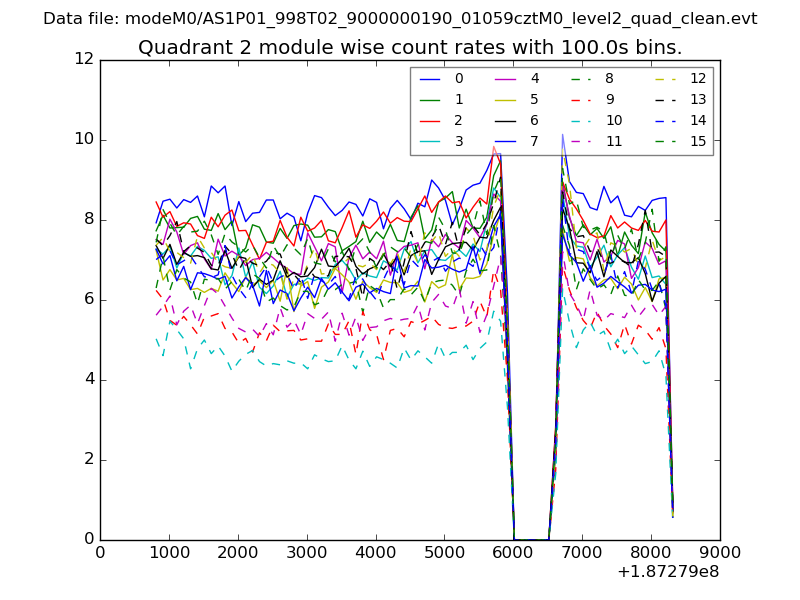 |
 |
| Module-wise count rates for Quadrant D Data is divided into 100 sec bins |
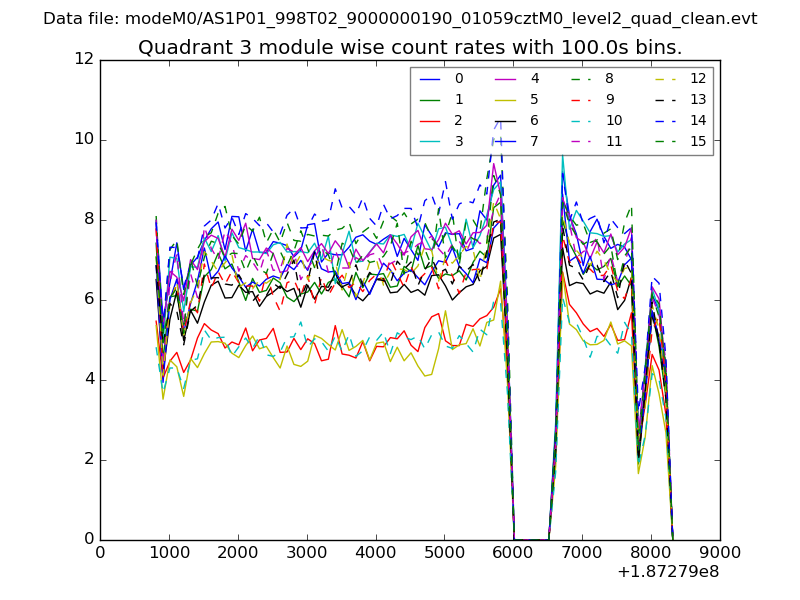 |
 |
| Parameter | Plot |
|---|---|
| CZT HV Monitor | 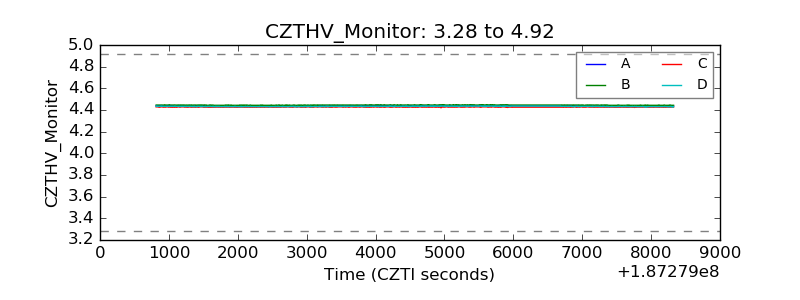 |
| D_VDD | 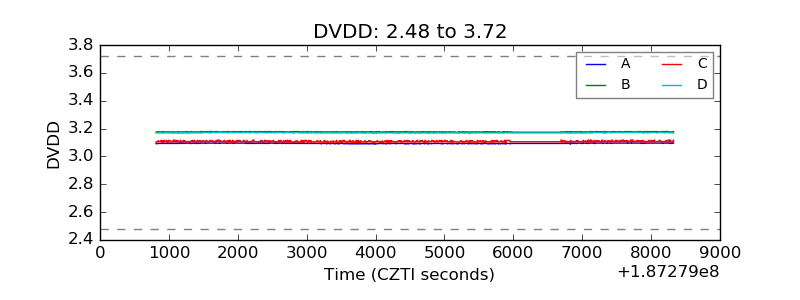 |
| Temperature 1 | 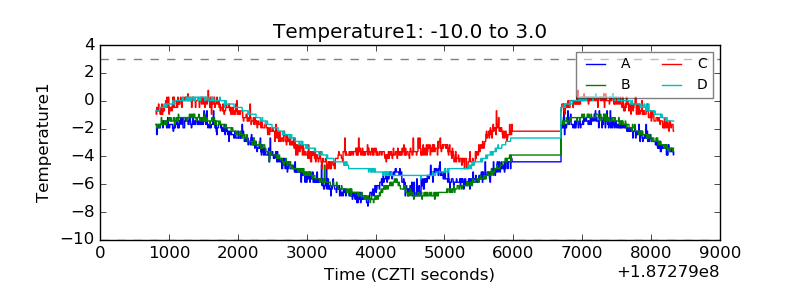 |
| Veto HV Monitor | 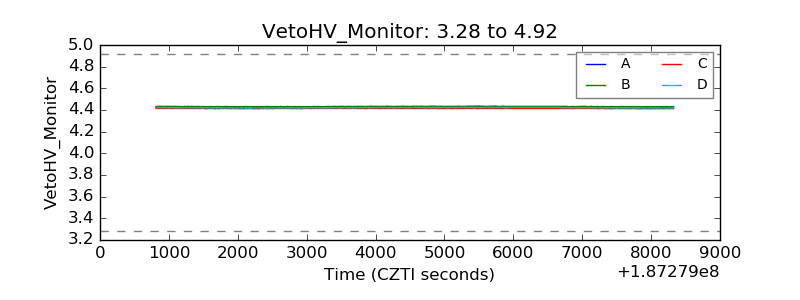 |
| Veto LLD | 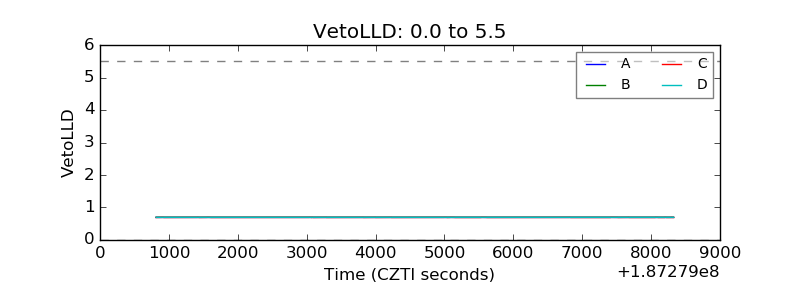 |
| Alpha Counter | 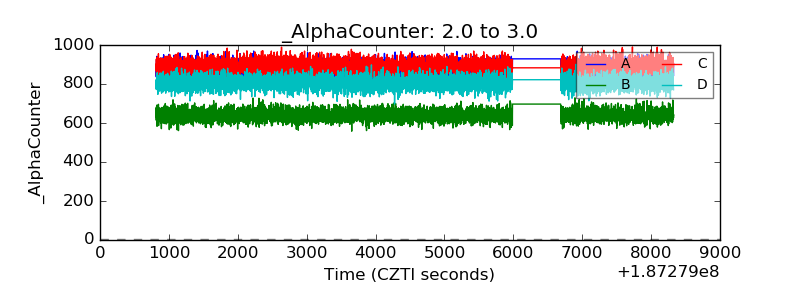 |
| _CPM_Rate | 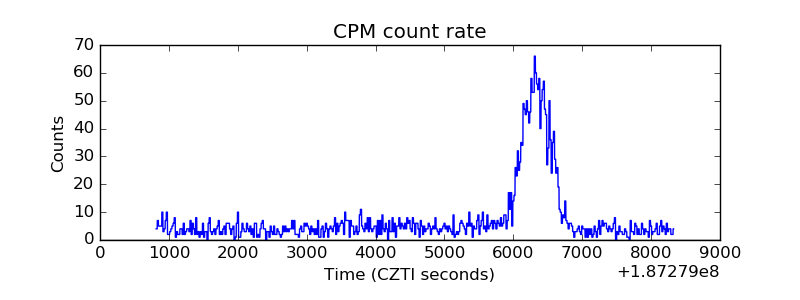 |
| CZT Counter | 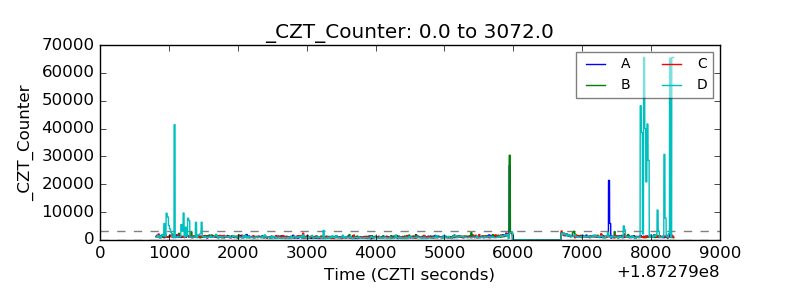 |
| +2.5 Volts monitor |  |
| +5 Volts monitor |  |
| _ROLL_ROT | 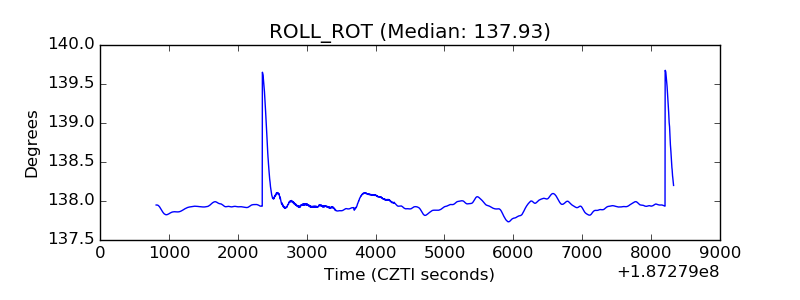 |
| _Roll_DEC | 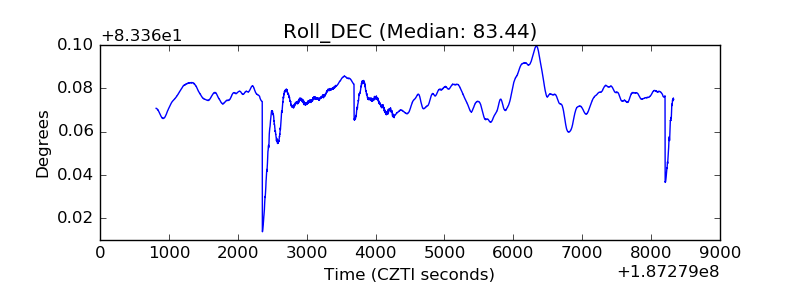 |
| _Roll_RA | 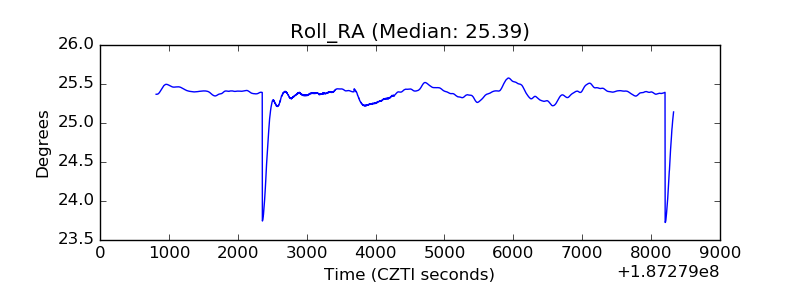 |
| Veto Counter | 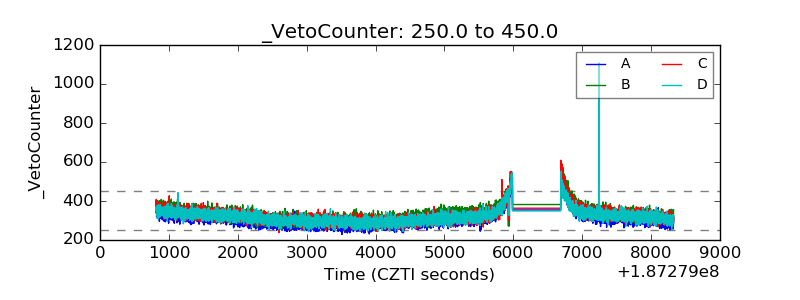 |