| Param | Original file | Final file |
|---|---|---|
| Filename | modeM0/AS1P01_998T02_9000000190_01061cztM0_level2.evt | modeM0/AS1P01_998T02_9000000190_01061cztM0_level2_quad_clean.evt |
| Size (bytes) | 1,141,416,000 | 120,965,760 |
| Size | 1.1 GB | 115.4 MB |
| Events in quadrant A | 8,394,437 | 803,926 |
| Events in quadrant B | 8,881,686 | 806,234 |
| Events in quadrant C | 8,892,144 | 779,778 |
| Events in quadrant D | 7,921,880 | 772,183 |
| Mode M0 | |||
|---|---|---|---|
| Quadrant | BADHDUFLAG | Total packets | Discarded packets |
| A | 0 | 30049 | 2 |
| B | 0 | 31497 | 1 |
| C | 0 | 31524 | 1 |
| D | 0 | 28719 | 1 |
| Mode SS | |||
|---|---|---|---|
| Quadrant | BADHDUFLAG | Total packets | Discarded packets |
| A | 0 | 146 | 0 |
| B | 0 | 146 | 0 |
| C | 0 | 146 | 0 |
| D | 0 | 146 | 0 |
| Mode M9 | |||
|---|---|---|---|
| Quadrant | BADHDUFLAG | Total packets | Discarded packets |
| A | 0 | 2 | 0 |
| B | 0 | 2 | 0 |
| C | 0 | 2 | 0 |
| D | 0 | 2 | 0 |
| Quadrant | Total seconds | Saturated seconds | Saturation percentage |
|---|---|---|---|
| A | 7206 | 7 | 0.097141% |
| B | 7206 | 22 | 0.305301% |
| C | 7206 | 22 | 0.305301% |
| D | 7206 | 19 | 0.263669% |
Noise dominated data is calculated using 1-second bins in cleaned event files. If a bin has >2000 counts, and if more than 50% of those come from <1% of pixels, then it is considered to be noise-dominated and hence unusable.
| Quadrant | # 1 sec bins | Bins with >0 counts | Bins with >2000 counts | High rate bins dominated by noise | Noise dominated (total time) | Noise dominated (detector-on time) | Marked lightcurve |
|---|---|---|---|---|---|---|---|
| A | 7371 | 7209 | 245 | 245 | 3.32% | 3.40% | 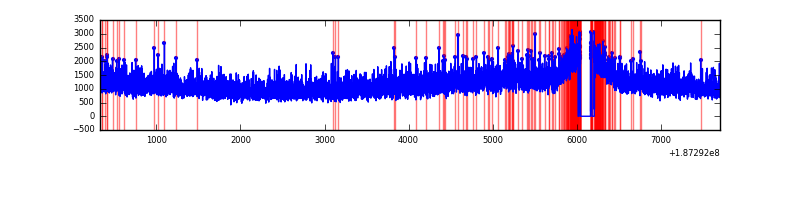 |
| B | 7371 | 7209 | 340 | 340 | 4.61% | 4.72% | 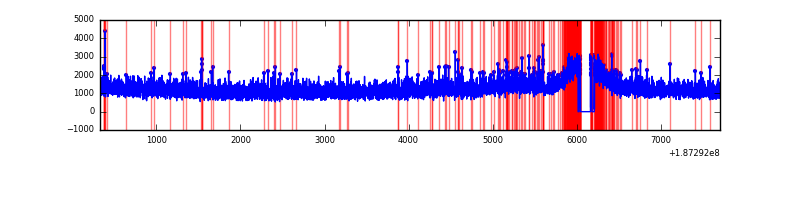 |
| C | 7371 | 7209 | 372 | 372 | 5.05% | 5.16% | 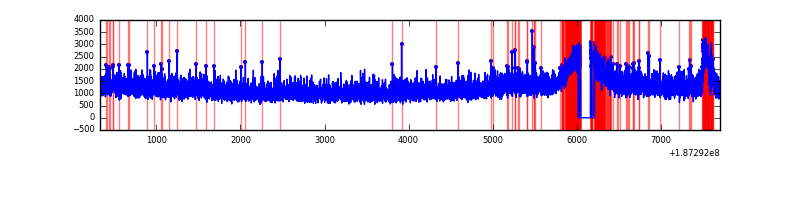 |
| D | 7371 | 7209 | 211 | 211 | 2.86% | 2.93% | 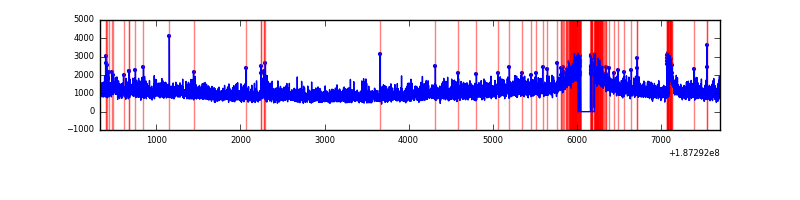 |
Top three noisy pixels from each quadrant. If the there are fewer than three noisy pixels in the level2.evt file, extra rows are filled as -1
| Pixel properties | Quadrant properties | ||||||
|---|---|---|---|---|---|---|---|
| Quadrant | DetID | PixID | Counts | Sigma | Mean | Median | Sigma |
| A | 11 | 79 | 8686 | 12.39 | 2186 | 2193 | 524.0 |
| A | 3 | 111 | 6475 | 8.17 | 2186 | 2193 | 524.0 |
| A | 14 | 203 | 5817 | 6.91 | 2186 | 2193 | 524.0 |
| B | 5 | 249 | 56583 | 100.94 | 2291 | 2294 | 537.8 |
| B | 15 | 22 | 47401 | 83.86 | 2291 | 2294 | 537.8 |
| B | 12 | 52 | 19137 | 31.31 | 2291 | 2294 | 537.8 |
| C | 15 | 241 | 378597 | 636.72 | 2115 | 2194 | 591.2 |
| C | 9 | 52 | 159740 | 266.5 | 2115 | 2194 | 591.2 |
| C | 3 | 79 | 45754 | 73.69 | 2115 | 2194 | 591.2 |
| D | 13 | 13 | 95369 | 147.42 | 2051 | 2125 | 632.5 |
| D | 2 | 170 | 71772 | 110.12 | 2051 | 2125 | 632.5 |
| D | 2 | 216 | 44179 | 66.49 | 2051 | 2125 | 632.5 |
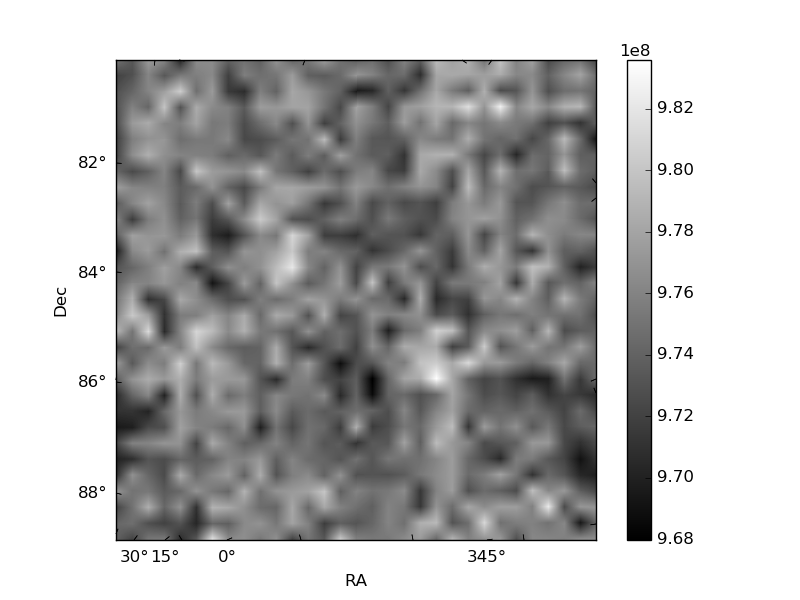
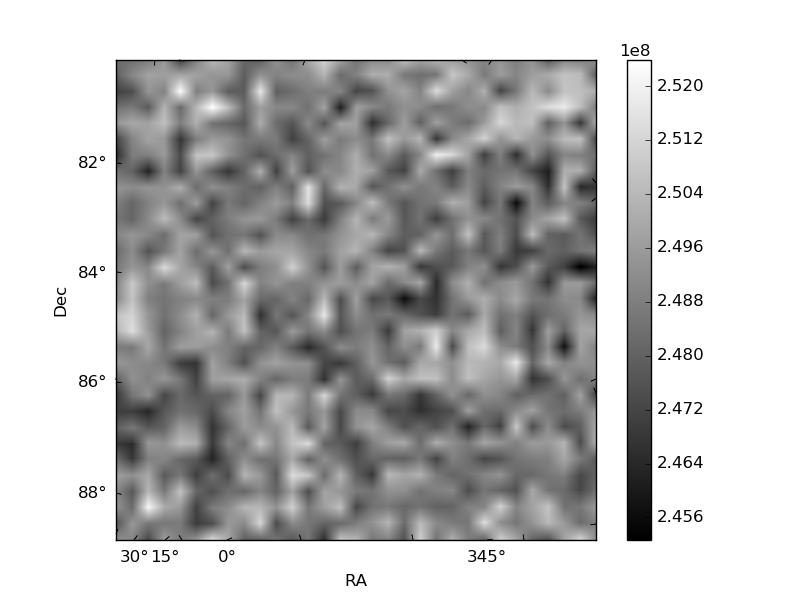
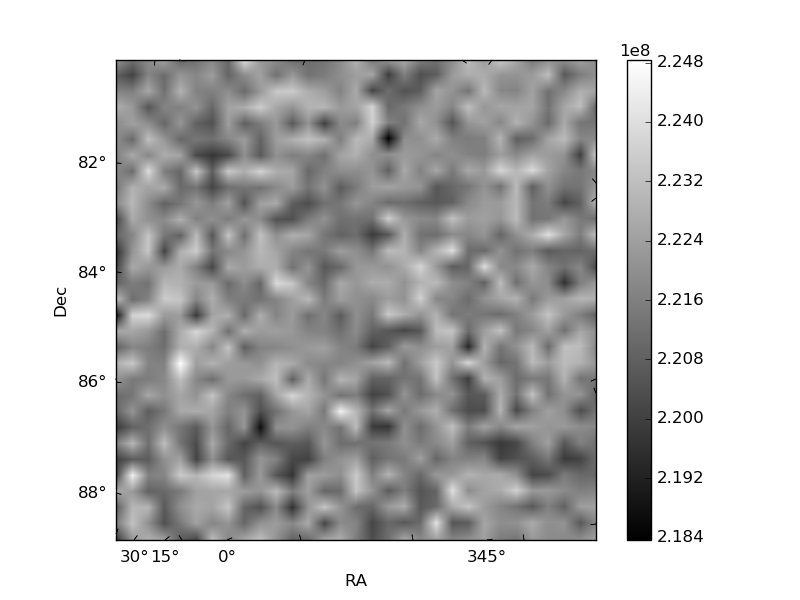
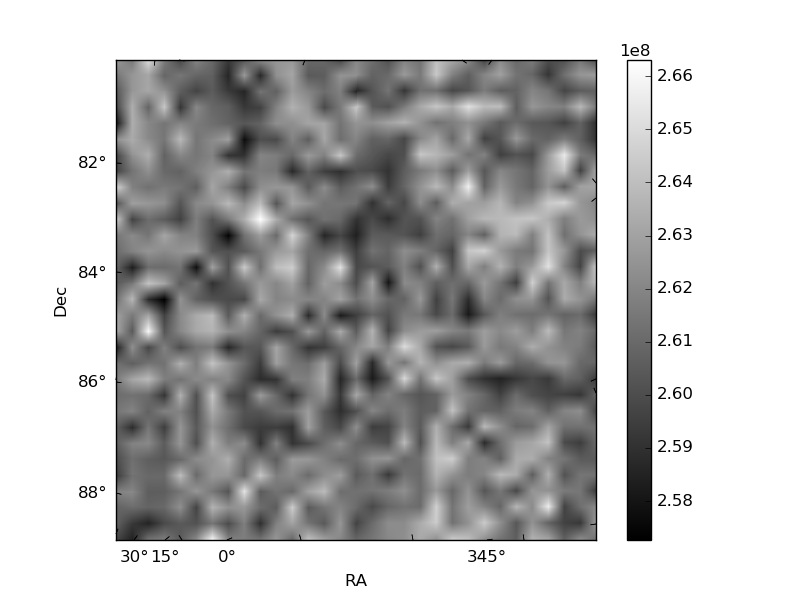
Histogram calculated using DETX and DETY for each event in the final _common_clean file
| Quadrant A | 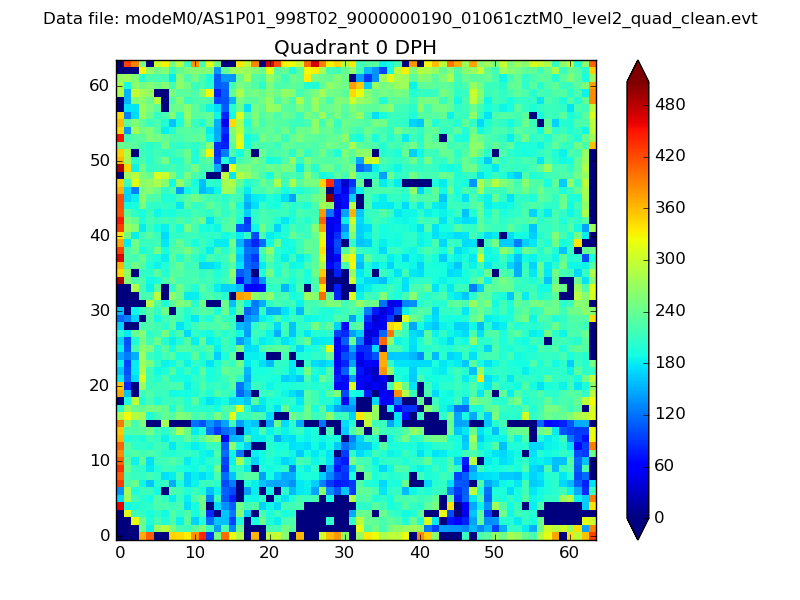 |
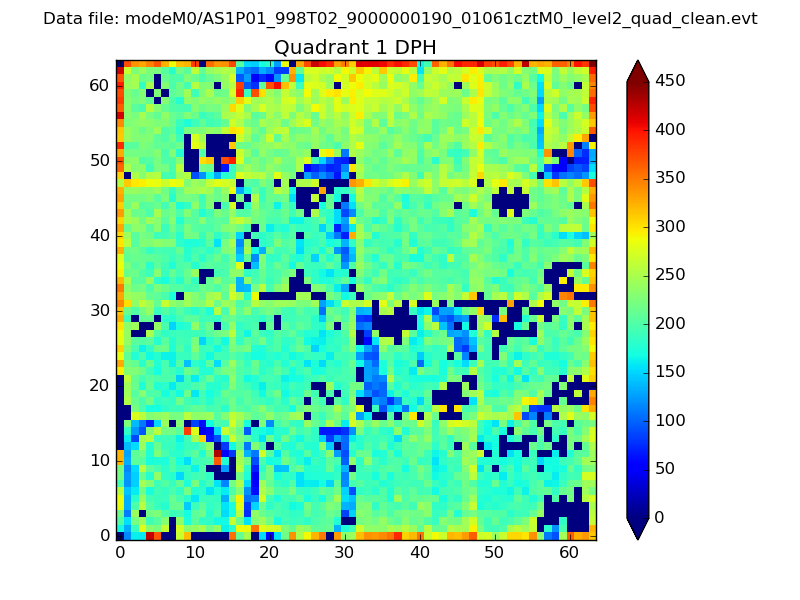 |
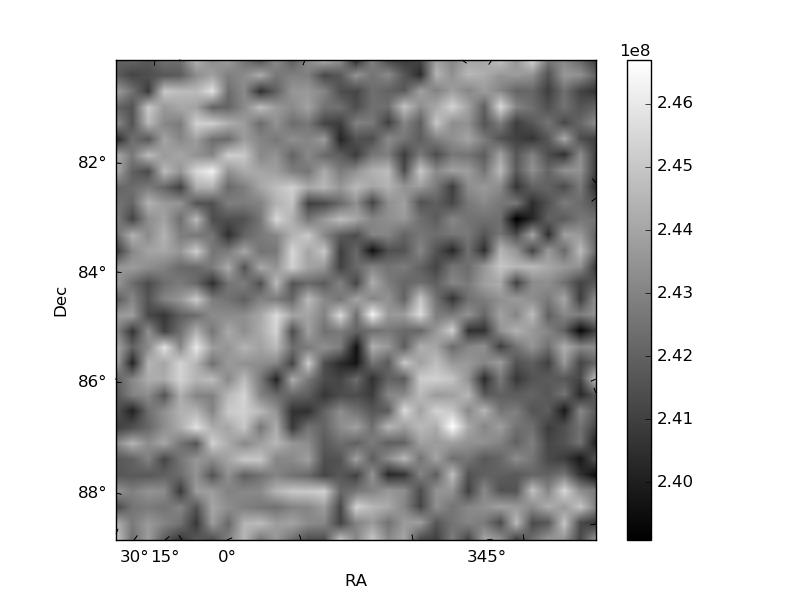
Quadrant B |
|---|---|---|---|
| Quadrant D | 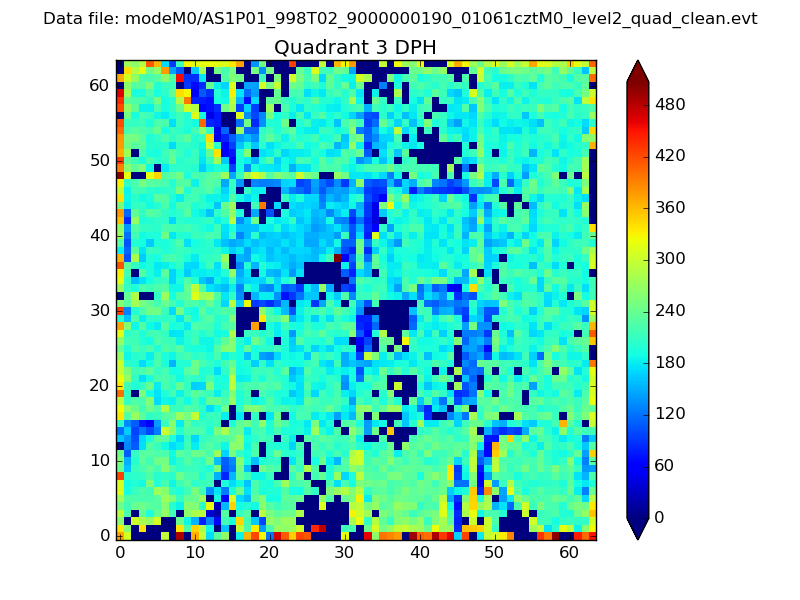 |
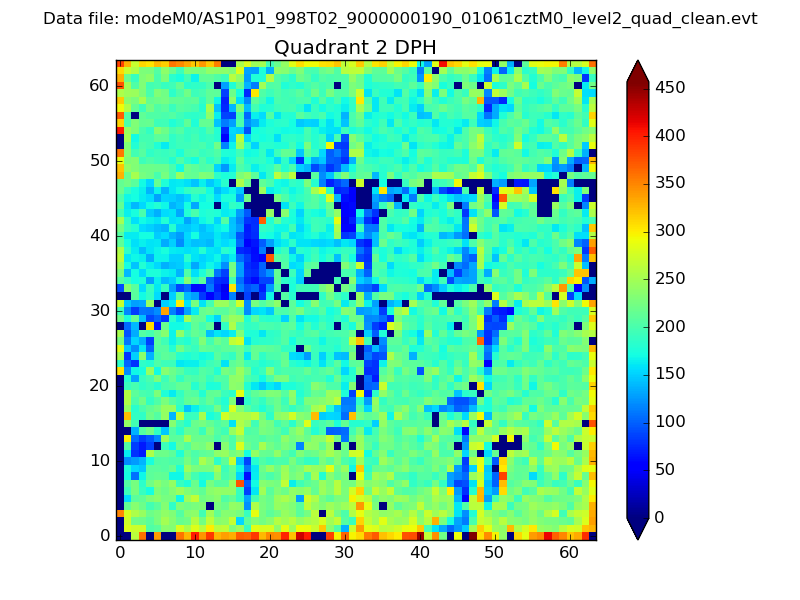 |
Quadrant C |
| Plot type | Count rate plots | Images |
|---|---|---|
| Comparison with Poisson distribution Blue bars denote a histogram of data divided into 1 sec bins. Red curve is a Poisson curve with rate = median count rate of data. |
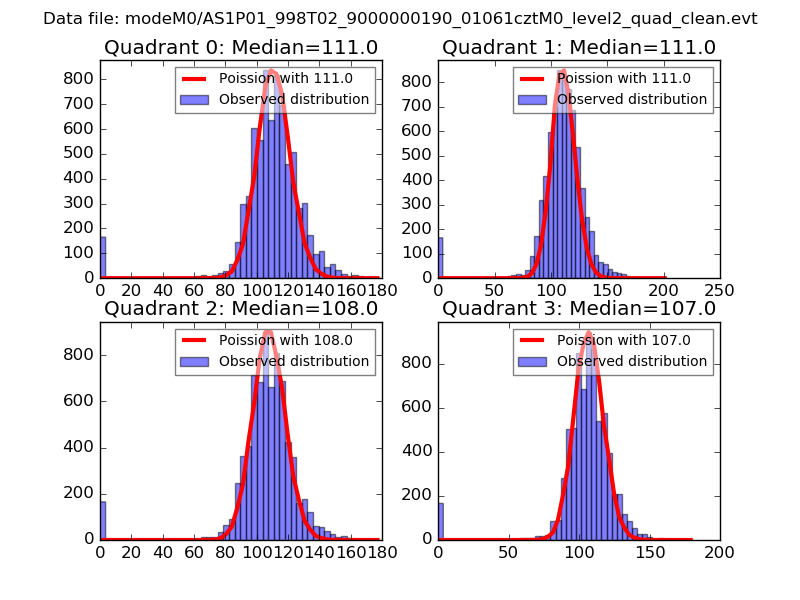 |
 |
| Quadrant-wise count rates Data is divided into 100 sec bins |
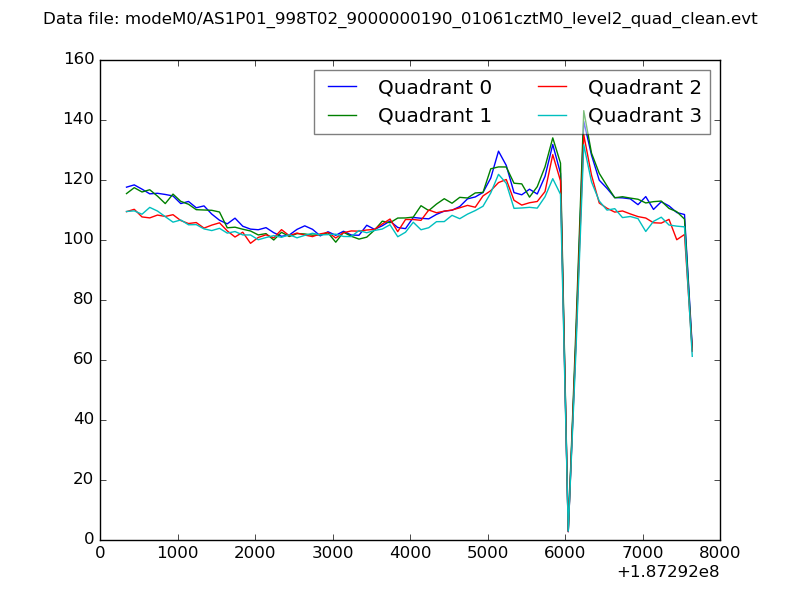 |
|
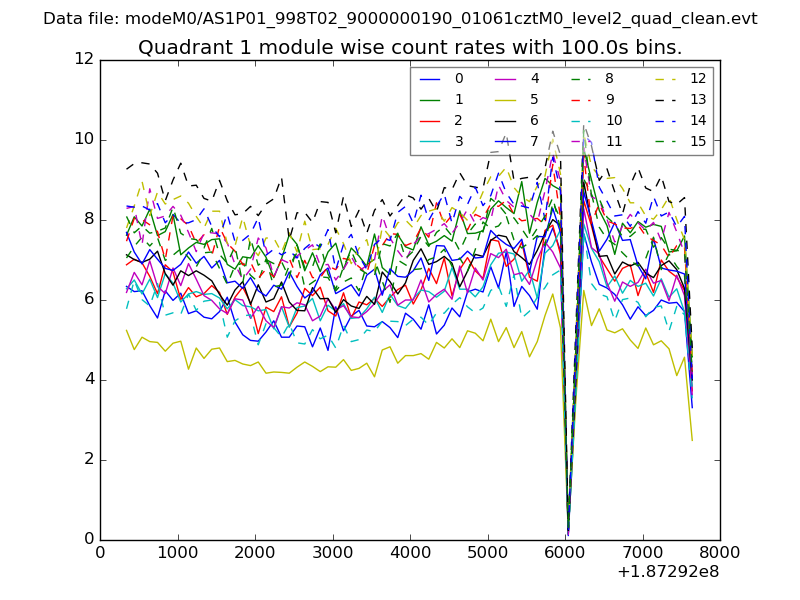
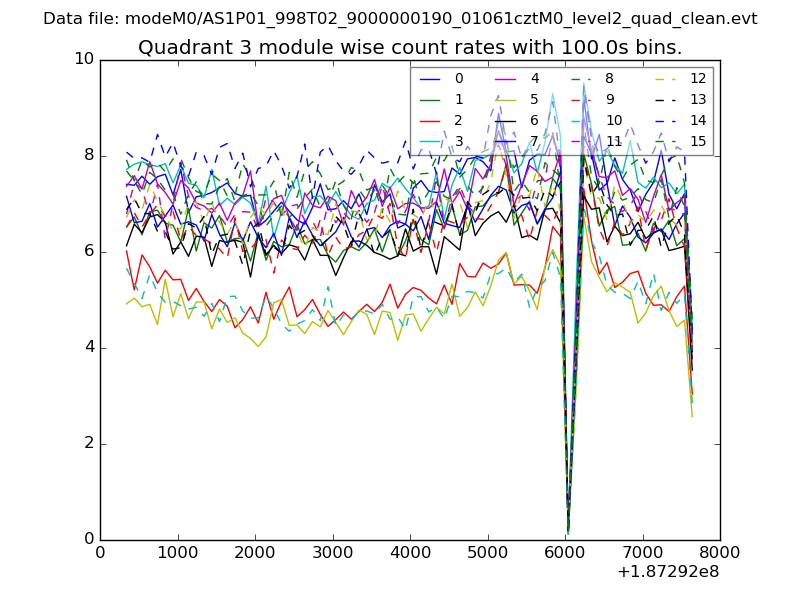
| Module-wise count rates for Quadrant A Data is divided into 100 sec bins |
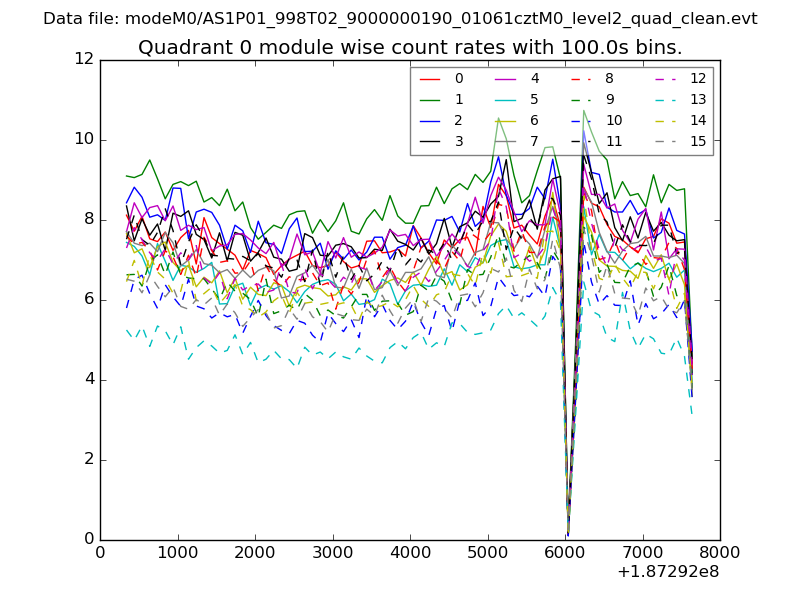 |
 |
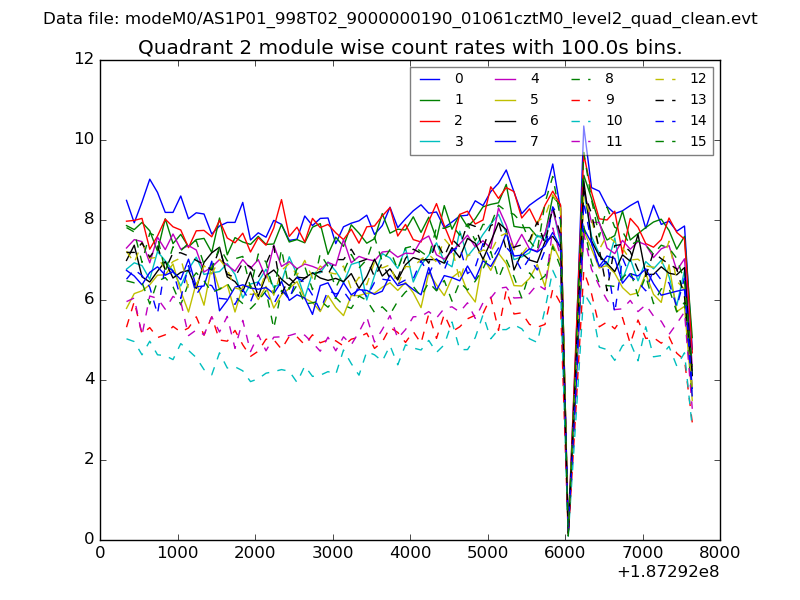
| Module-wise count rates for Quadrant B Data is divided into 100 sec bins |
 |
 |
| Module-wise count rates for Quadrant C Data is divided into 100 sec bins |
 |
 |
| Module-wise count rates for Quadrant D Data is divided into 100 sec bins |
 |
 |
| Parameter | Plot |
|---|---|
| CZT HV Monitor | 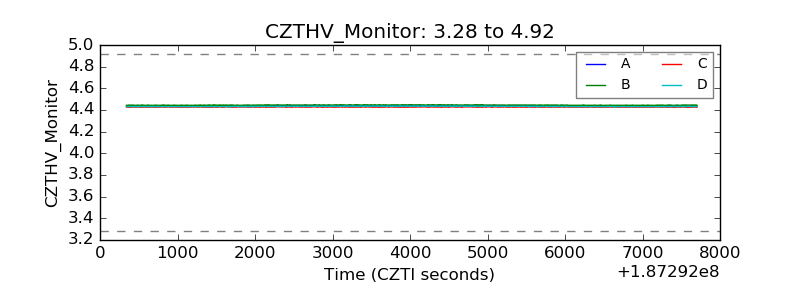 |
| D_VDD | 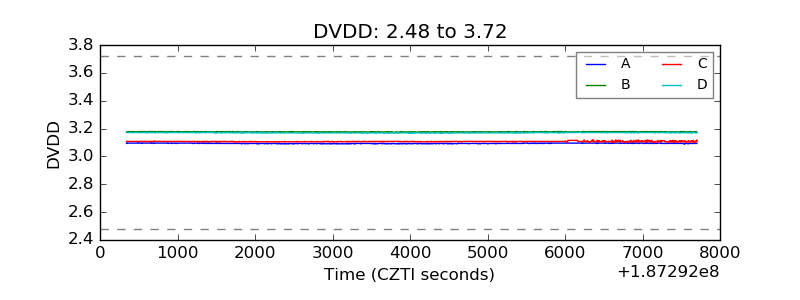 |
| Temperature 1 | 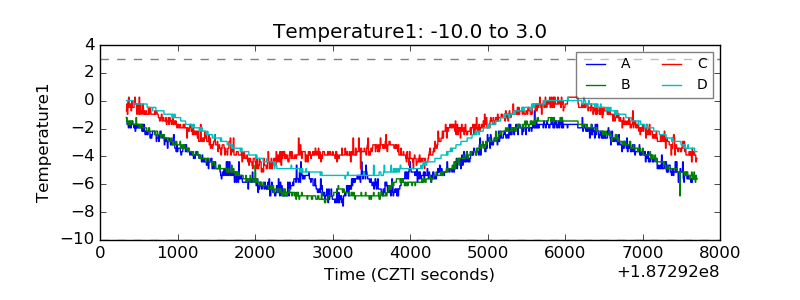 |
| Veto HV Monitor | 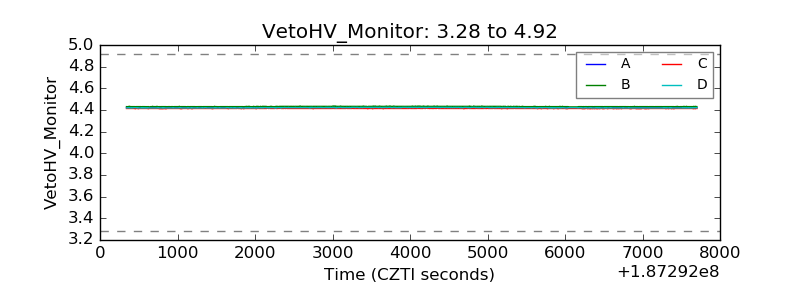 |
| Veto LLD | 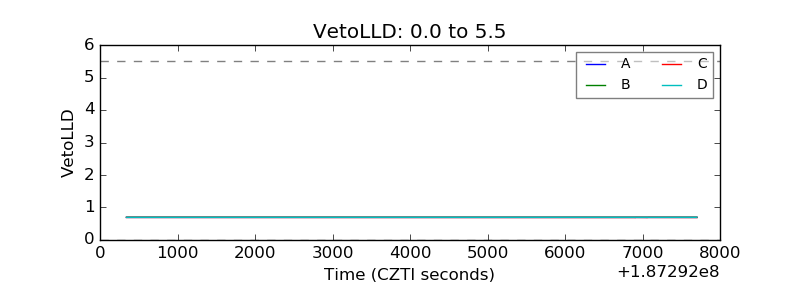 |
| Alpha Counter | 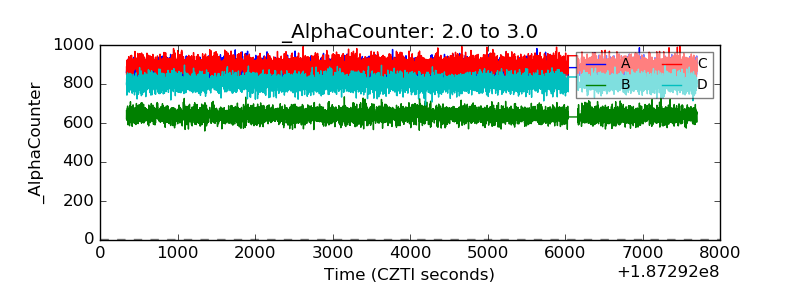 |
| _CPM_Rate | 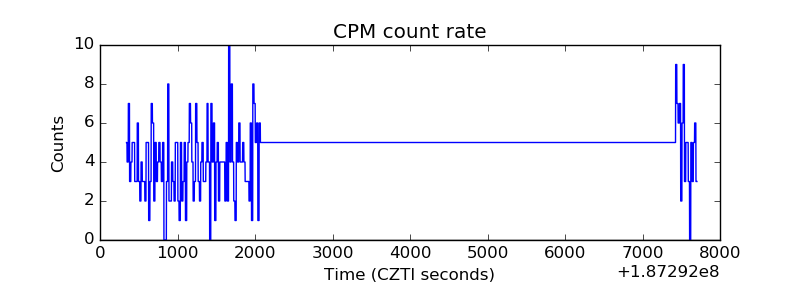 |
| CZT Counter | 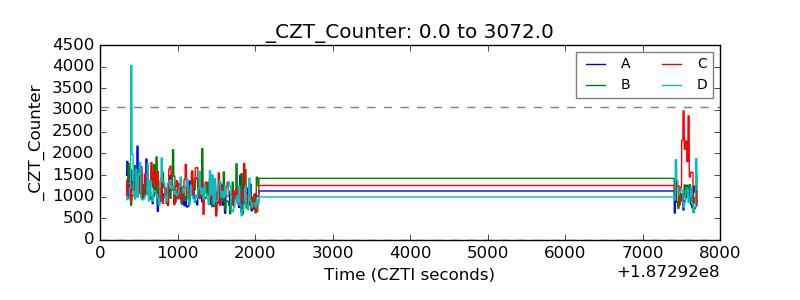 |
| +2.5 Volts monitor |  |
| +5 Volts monitor |  |
| _ROLL_ROT | 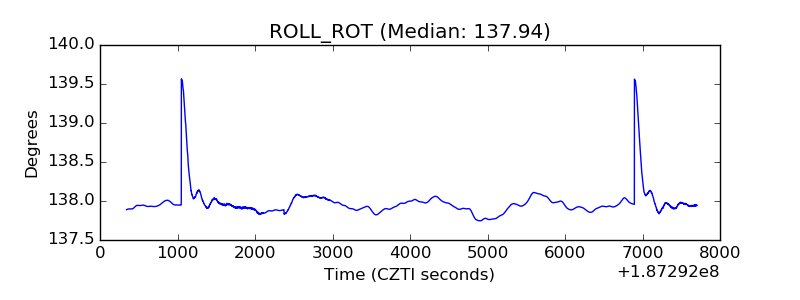 |
| _Roll_DEC | 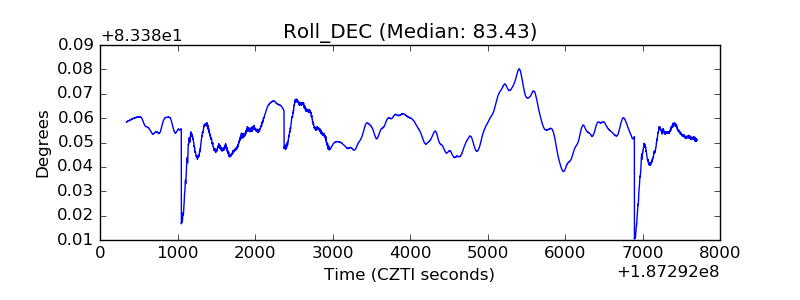 |
| _Roll_RA | 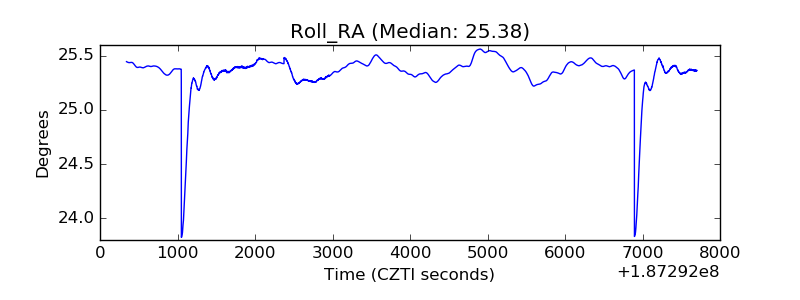 |
| Veto Counter | 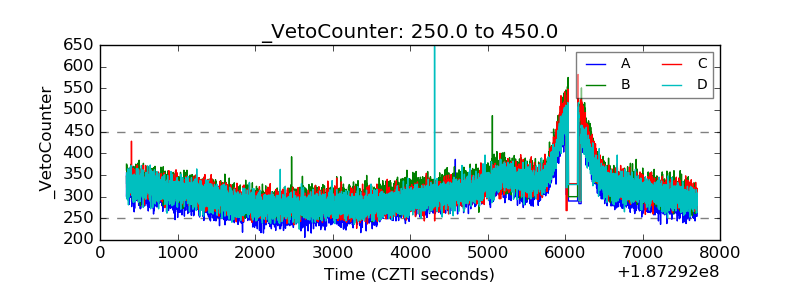 |