| Param | Original file | Final file |
|---|---|---|
| Filename | modeM0/AS1P01_998T02_9000000190_01062cztM0_level2.evt | modeM0/AS1P01_998T02_9000000190_01062cztM0_level2_quad_clean.evt |
| Size (bytes) | 1,188,947,520 | 124,257,600 |
| Size | 1.1 GB | 118.5 MB |
| Events in quadrant A | 8,631,693 | 822,320 |
| Events in quadrant B | 9,143,238 | 829,610 |
| Events in quadrant C | 9,199,759 | 802,377 |
| Events in quadrant D | 8,539,044 | 790,801 |
| Mode M0 | |||
|---|---|---|---|
| Quadrant | BADHDUFLAG | Total packets | Discarded packets |
| A | 0 | 30914 | 2 |
| B | 0 | 32465 | 2 |
| C | 0 | 32634 | 6 |
| D | 0 | 30678 | 2 |
| Mode SS | |||
|---|---|---|---|
| Quadrant | BADHDUFLAG | Total packets | Discarded packets |
| A | 0 | 152 | 0 |
| B | 0 | 152 | 0 |
| C | 0 | 152 | 0 |
| D | 0 | 152 | 0 |
| Mode M9 | |||
|---|---|---|---|
| Quadrant | BADHDUFLAG | Total packets | Discarded packets |
| A | 0 | 4 | 0 |
| B | 0 | 4 | 0 |
| C | 0 | 4 | 0 |
| D | 0 | 4 | 0 |
| Quadrant | Total seconds | Saturated seconds | Saturation percentage |
|---|---|---|---|
| A | 7447 | 6 | 0.080569% |
| B | 7447 | 21 | 0.281993% |
| C | 7446 | 20 | 0.268601% |
| D | 7447 | 71 | 0.953404% |
Noise dominated data is calculated using 1-second bins in cleaned event files. If a bin has >2000 counts, and if more than 50% of those come from <1% of pixels, then it is considered to be noise-dominated and hence unusable.
| Quadrant | # 1 sec bins | Bins with >0 counts | Bins with >2000 counts | High rate bins dominated by noise | Noise dominated (total time) | Noise dominated (detector-on time) | Marked lightcurve |
|---|---|---|---|---|---|---|---|
| A | 7847 | 7448 | 189 | 189 | 2.41% | 2.54% | 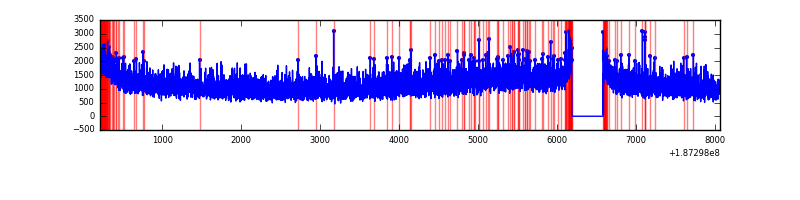 |
| B | 7847 | 7448 | 271 | 271 | 3.45% | 3.64% | 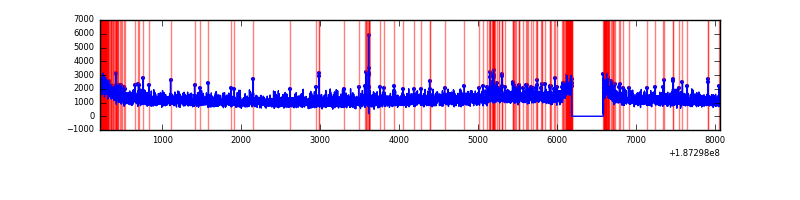 |
| C | 7846 | 7447 | 341 | 341 | 4.35% | 4.58% | 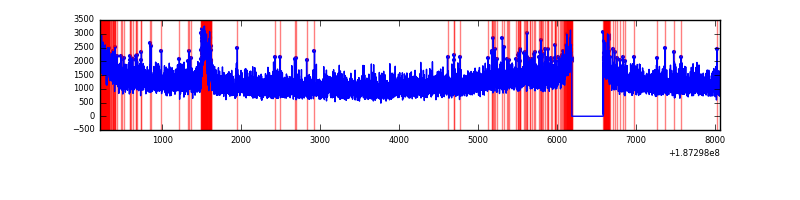 |
| D | 7847 | 7448 | 273 | 273 | 3.48% | 3.67% | 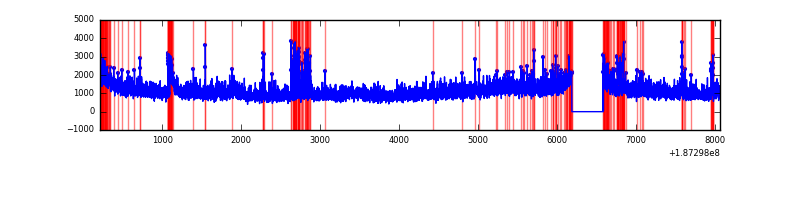 |
Top three noisy pixels from each quadrant. If the there are fewer than three noisy pixels in the level2.evt file, extra rows are filled as -1
| Pixel properties | Quadrant properties | ||||||
|---|---|---|---|---|---|---|---|
| Quadrant | DetID | PixID | Counts | Sigma | Mean | Median | Sigma |
| A | 15 | 233 | 19075 | 31.39 | 2243 | 2257 | 535.7 |
| A | 11 | 79 | 8816 | 12.24 | 2243 | 2257 | 535.7 |
| A | 3 | 111 | 6608 | 8.12 | 2243 | 2257 | 535.7 |
| B | 5 | 191 | 76505 | 134.95 | 2347 | 2357 | 549.5 |
| B | 5 | 249 | 46211 | 79.81 | 2347 | 2357 | 549.5 |
| B | 15 | 22 | 44075 | 75.93 | 2347 | 2357 | 549.5 |
| C | 15 | 241 | 389271 | 638.26 | 2172 | 2253 | 606.4 |
| C | 9 | 52 | 193855 | 315.98 | 2172 | 2253 | 606.4 |
| C | 3 | 79 | 39128 | 60.81 | 2172 | 2253 | 606.4 |
| D | 7 | 207 | 197205 | 305.83 | 2083 | 2161 | 637.8 |
| D | 1 | 83 | 121585 | 187.26 | 2083 | 2161 | 637.8 |
| D | 13 | 13 | 87851 | 134.36 | 2083 | 2161 | 637.8 |
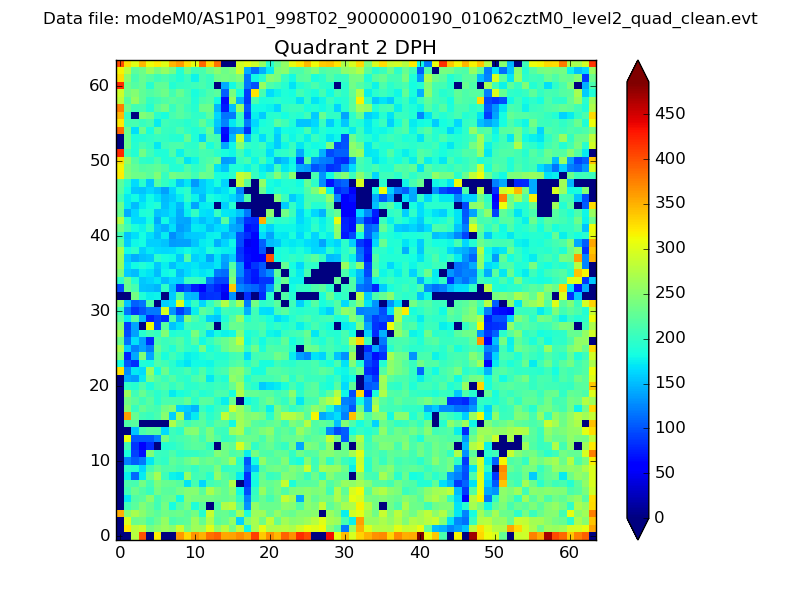
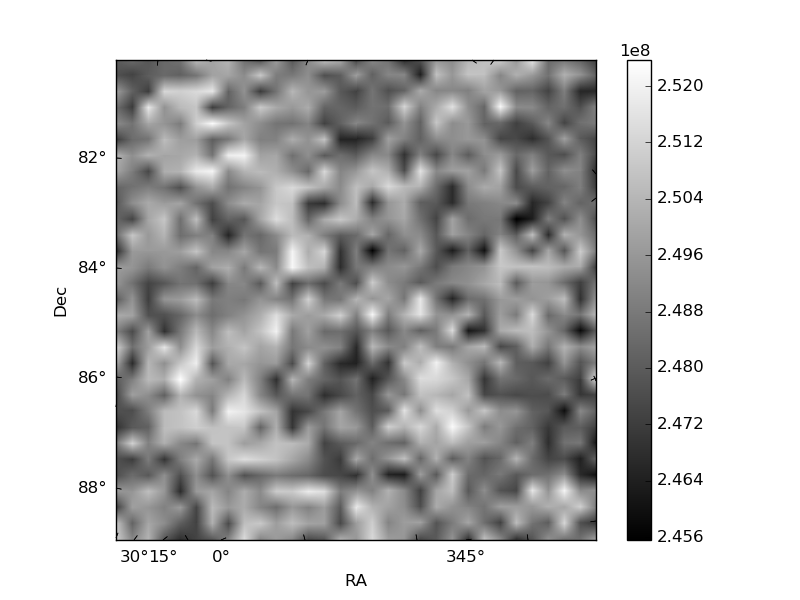
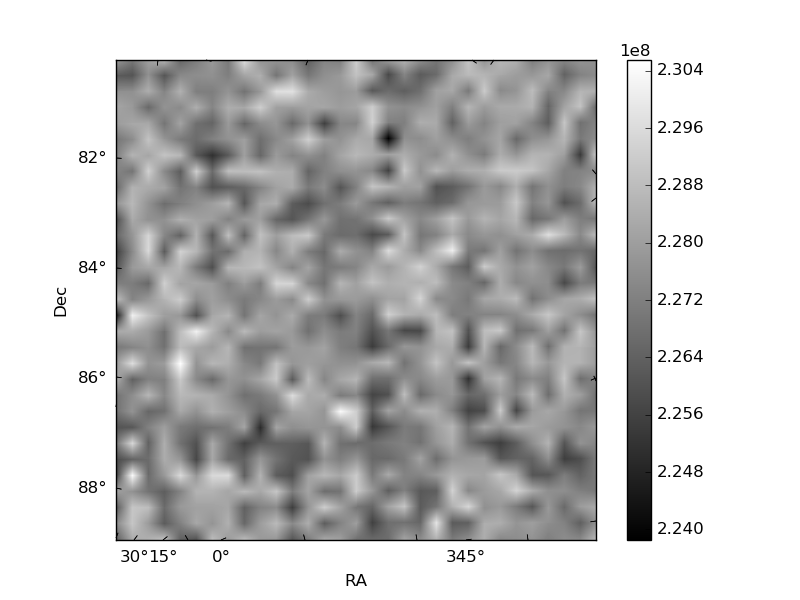
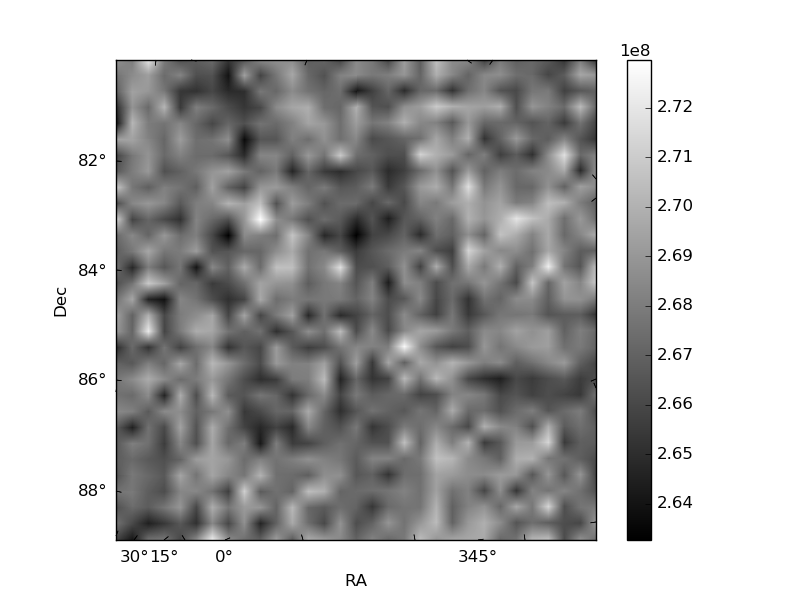
Histogram calculated using DETX and DETY for each event in the final _common_clean file
| Quadrant A | 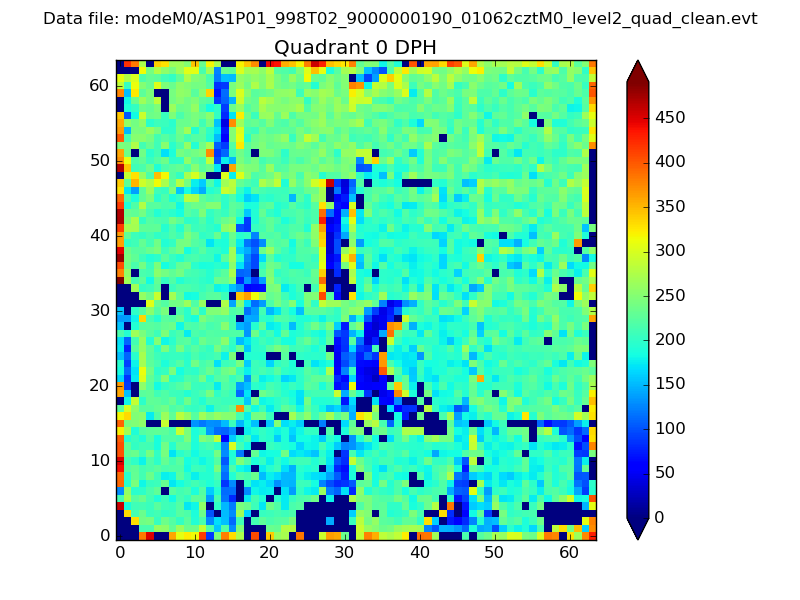 |
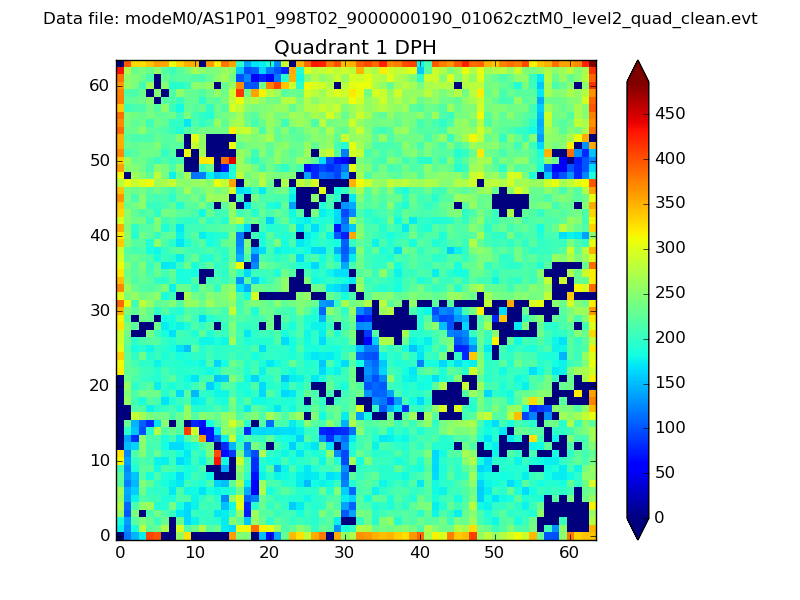 |
Quadrant B |
|---|---|---|---|
| Quadrant D | 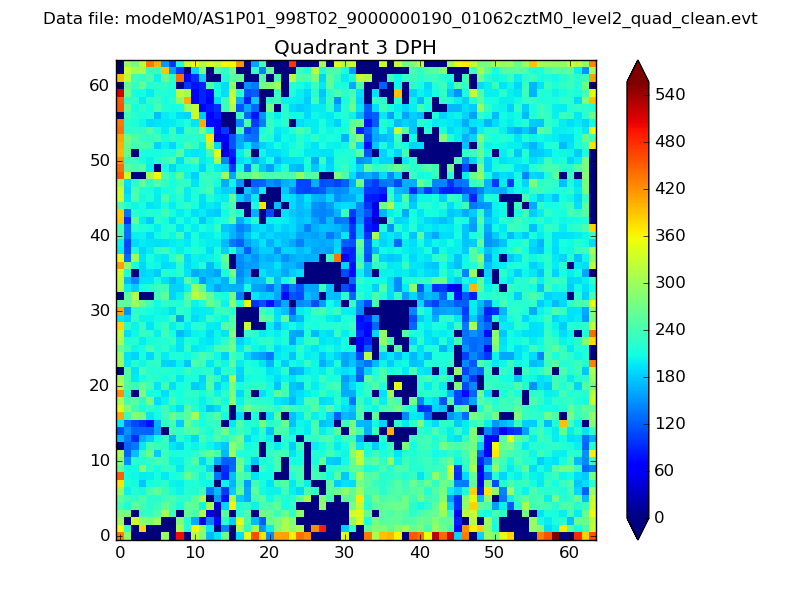 |
 |
Quadrant C |
| Plot type | Count rate plots | Images |
|---|---|---|
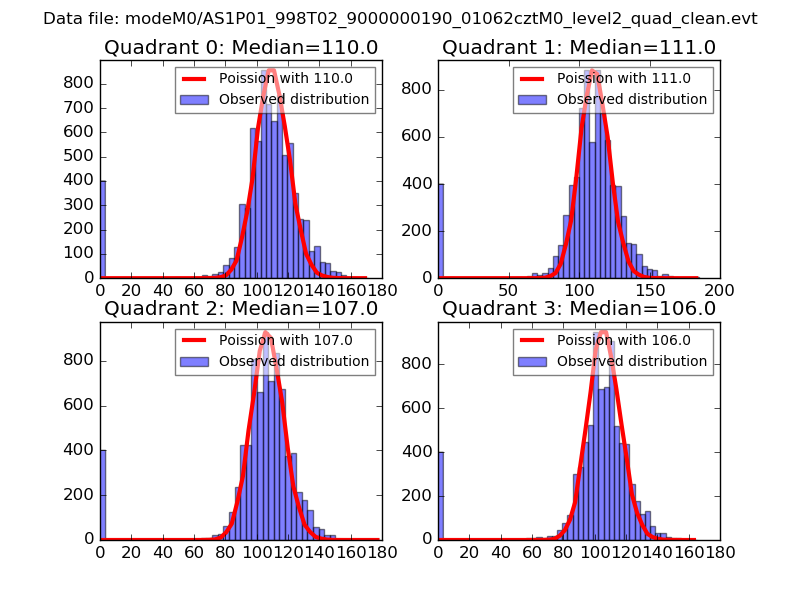
| Comparison with Poisson distribution Blue bars denote a histogram of data divided into 1 sec bins. Red curve is a Poisson curve with rate = median count rate of data. |
 |
 |
| Quadrant-wise count rates Data is divided into 100 sec bins |
 |
|
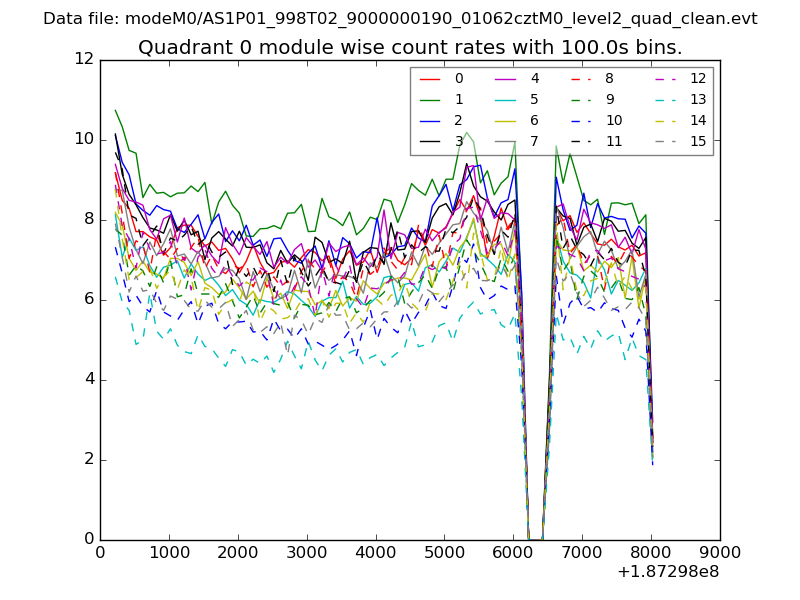
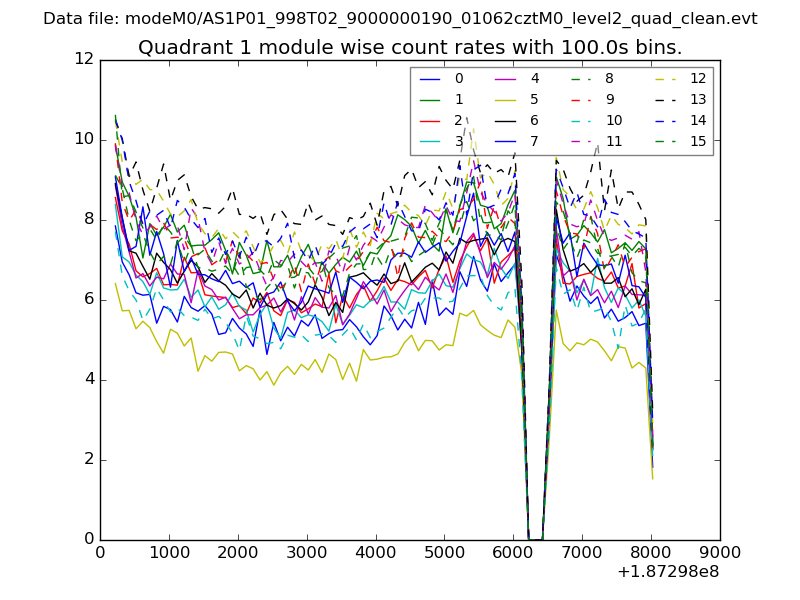
| Module-wise count rates for Quadrant A Data is divided into 100 sec bins |
 |
 |
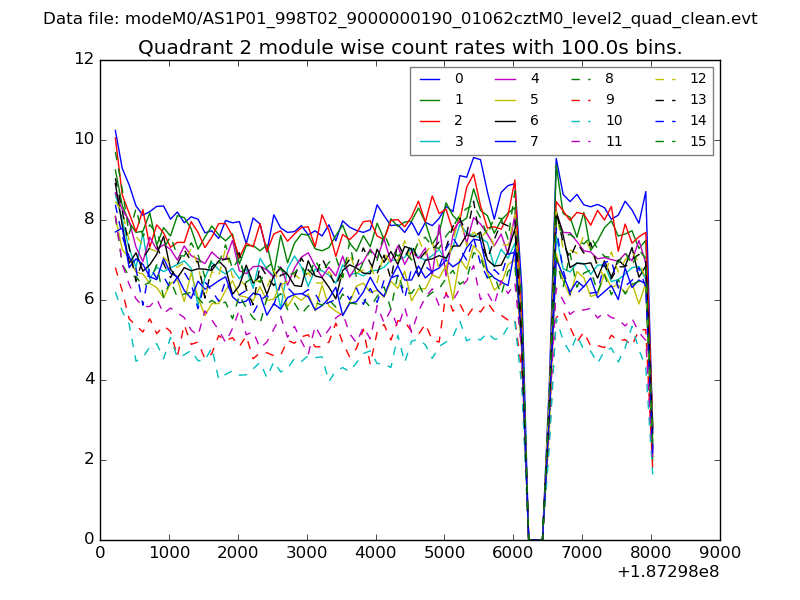
| Module-wise count rates for Quadrant B Data is divided into 100 sec bins |
 |
 |
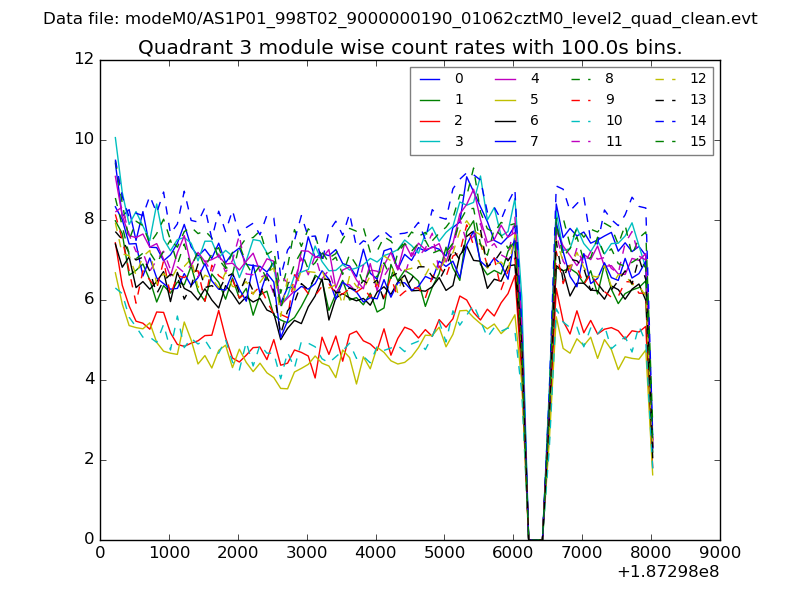
| Module-wise count rates for Quadrant C Data is divided into 100 sec bins |
 |
 |
| Module-wise count rates for Quadrant D Data is divided into 100 sec bins |
 |
 |
| Parameter | Plot |
|---|---|
| CZT HV Monitor | 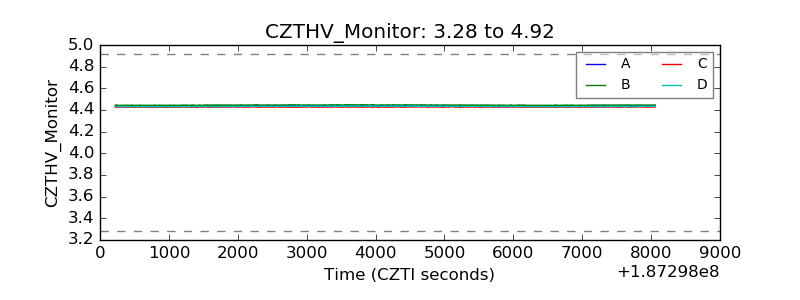 |
| D_VDD | 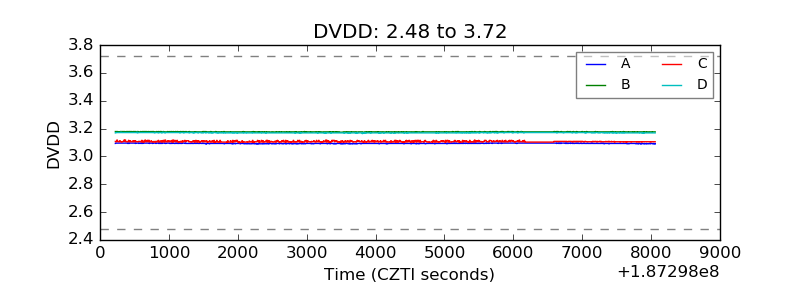 |
| Temperature 1 | 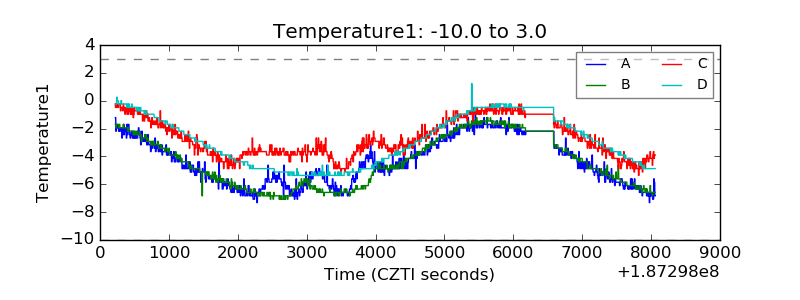 |
| Veto HV Monitor | 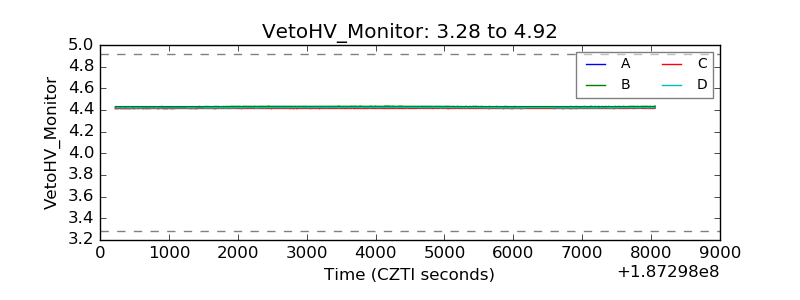 |
| Veto LLD | 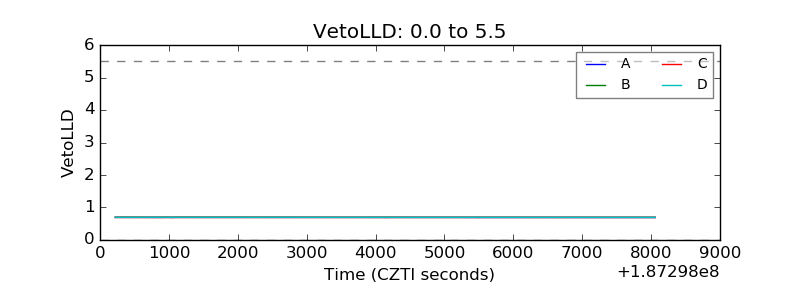 |
| Alpha Counter | 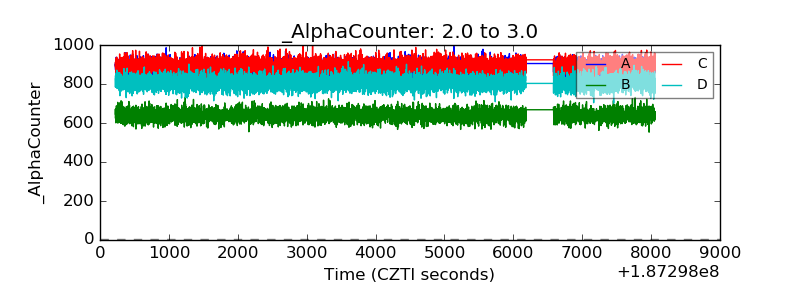 |
| _CPM_Rate | 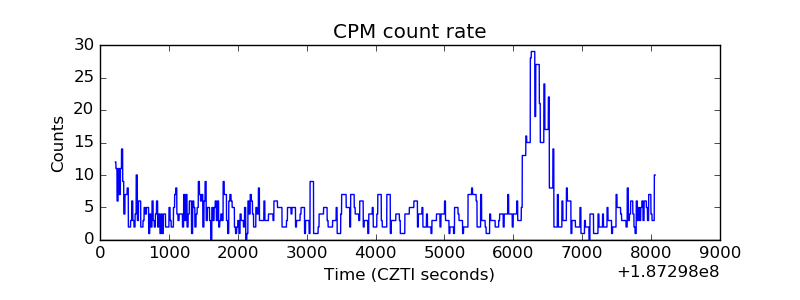 |
| CZT Counter | 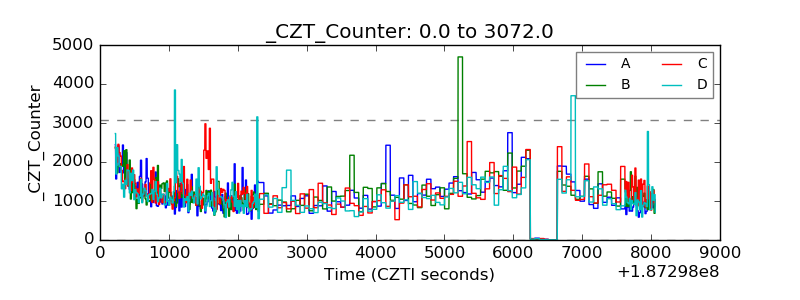 |
| +2.5 Volts monitor |  |
| +5 Volts monitor |  |
| _ROLL_ROT | 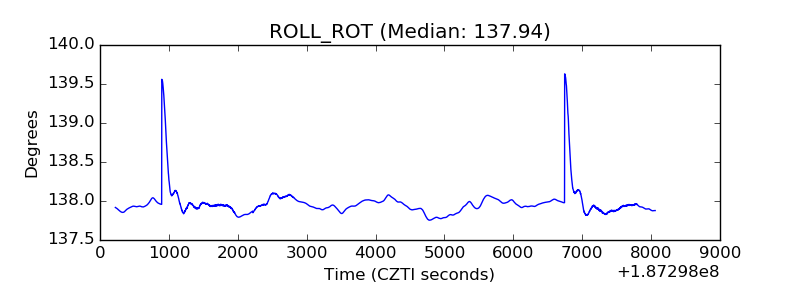 |
| _Roll_DEC | 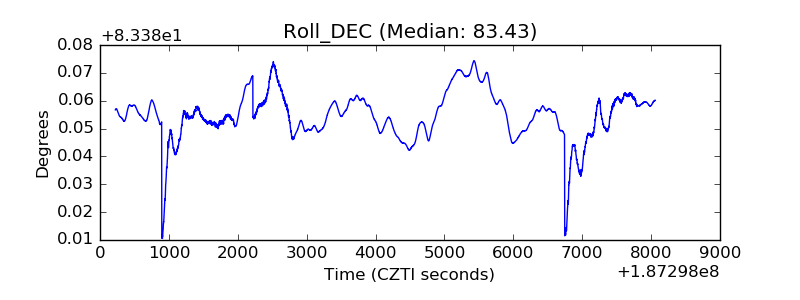 |
| _Roll_RA | 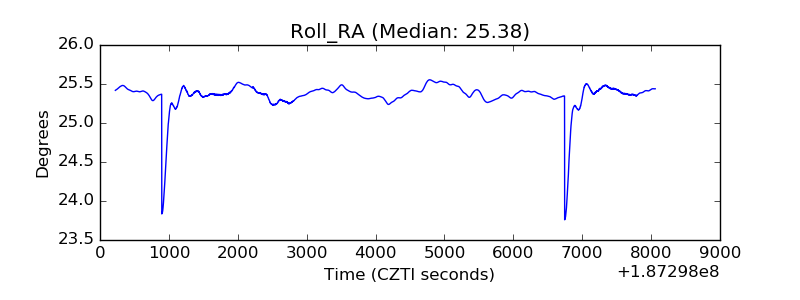 |
| Veto Counter | 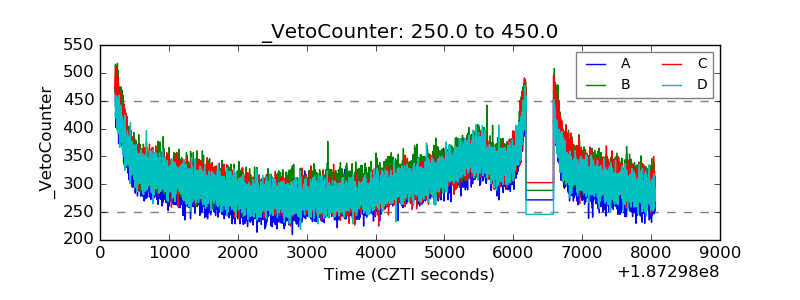 |