| Param | Original file | Final file |
|---|---|---|
| Filename | modeM0/AS1P01_998T02_9000000190_01064cztM0_level2.evt | modeM0/AS1P01_998T02_9000000190_01064cztM0_level2_quad_clean.evt |
| Size (bytes) | 1,172,577,600 | 124,525,440 |
| Size | 1.1 GB | 118.8 MB |
| Events in quadrant A | 8,682,505 | 820,596 |
| Events in quadrant B | 9,253,716 | 825,623 |
| Events in quadrant C | 8,909,605 | 809,974 |
| Events in quadrant D | 8,169,592 | 794,706 |
| Mode M0 | |||
|---|---|---|---|
| Quadrant | BADHDUFLAG | Total packets | Discarded packets |
| A | 0 | 31081 | 2 |
| B | 0 | 32803 | 2 |
| C | 0 | 31797 | 2 |
| D | 0 | 29675 | 2 |
| Mode SS | |||
|---|---|---|---|
| Quadrant | BADHDUFLAG | Total packets | Discarded packets |
| A | 0 | 152 | 0 |
| B | 0 | 152 | 0 |
| C | 0 | 152 | 0 |
| D | 0 | 152 | 0 |
| Mode M9 | |||
|---|---|---|---|
| Quadrant | BADHDUFLAG | Total packets | Discarded packets |
| A | 0 | 13 | 0 |
| B | 0 | 13 | 0 |
| C | 0 | 13 | 0 |
| D | 0 | 13 | 0 |
| Quadrant | Total seconds | Saturated seconds | Saturation percentage |
|---|---|---|---|
| A | 7489 | 5 | 0.066765% |
| B | 7490 | 40 | 0.534045% |
| C | 7490 | 8 | 0.106809% |
| D | 7490 | 50 | 0.667557% |
Noise dominated data is calculated using 1-second bins in cleaned event files. If a bin has >2000 counts, and if more than 50% of those come from <1% of pixels, then it is considered to be noise-dominated and hence unusable.
| Quadrant | # 1 sec bins | Bins with >0 counts | Bins with >2000 counts | High rate bins dominated by noise | Noise dominated (total time) | Noise dominated (detector-on time) | Marked lightcurve |
|---|---|---|---|---|---|---|---|
| A | 8689 | 7491 | 153 | 153 | 1.76% | 2.04% | 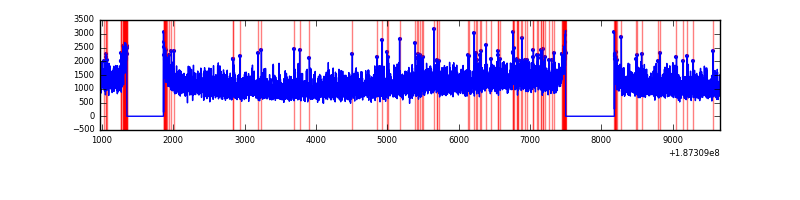 |
| B | 8690 | 7492 | 268 | 268 | 3.08% | 3.58% | 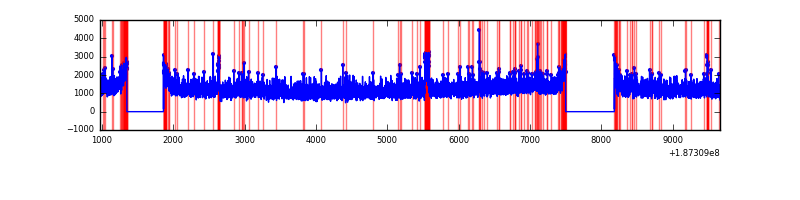 |
| C | 8690 | 7492 | 217 | 217 | 2.50% | 2.90% | 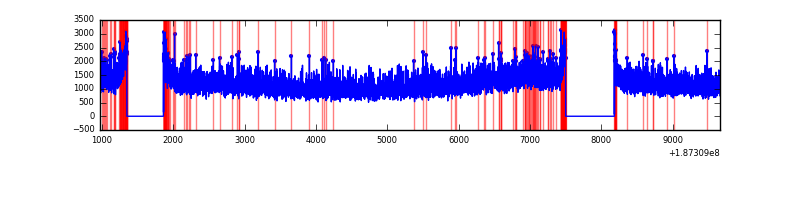 |
| D | 8690 | 7492 | 224 | 224 | 2.58% | 2.99% | 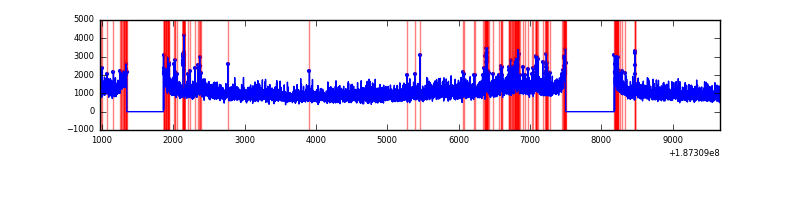 |
Top three noisy pixels from each quadrant. If the there are fewer than three noisy pixels in the level2.evt file, extra rows are filled as -1
| Pixel properties | Quadrant properties | ||||||
|---|---|---|---|---|---|---|---|
| Quadrant | DetID | PixID | Counts | Sigma | Mean | Median | Sigma |
| A | 0 | 253 | 44165 | 77.33 | 2251 | 2272 | 541.8 |
| A | 11 | 79 | 9002 | 12.42 | 2251 | 2272 | 541.8 |
| A | 3 | 111 | 6993 | 8.71 | 2251 | 2272 | 541.8 |
| B | 5 | 191 | 132263 | 235.32 | 2364 | 2372 | 552.0 |
| B | 15 | 22 | 37345 | 63.36 | 2364 | 2372 | 552.0 |
| B | 4 | 141 | 32677 | 54.9 | 2364 | 2372 | 552.0 |
| C | 15 | 241 | 389710 | 640.62 | 2165 | 2245 | 604.8 |
| C | 3 | 79 | 31504 | 48.38 | 2165 | 2245 | 604.8 |
| C | 3 | 111 | 31351 | 48.12 | 2165 | 2245 | 604.8 |
| D | 9 | 64 | 126153 | 192.02 | 2085 | 2167 | 645.7 |
| D | 13 | 73 | 57826 | 86.2 | 2085 | 2167 | 645.7 |
| D | 10 | 102 | 55050 | 81.9 | 2085 | 2167 | 645.7 |
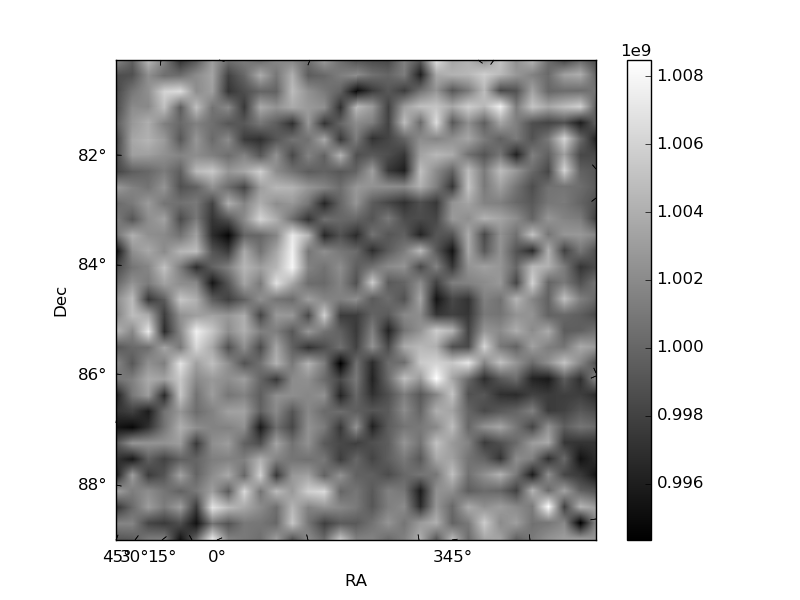
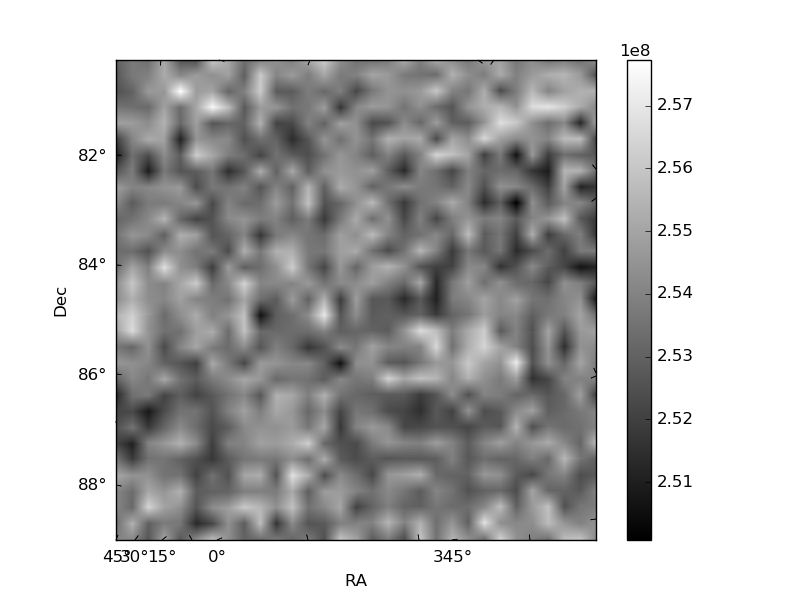
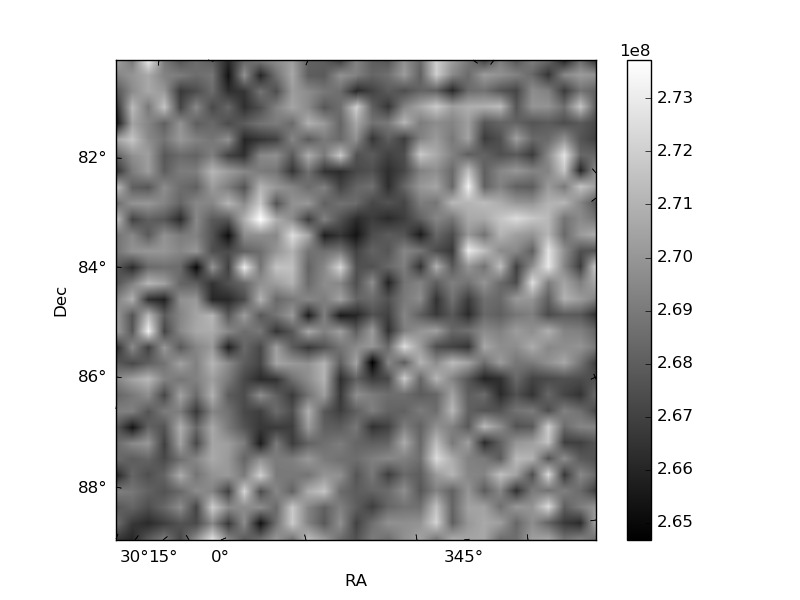
Histogram calculated using DETX and DETY for each event in the final _common_clean file
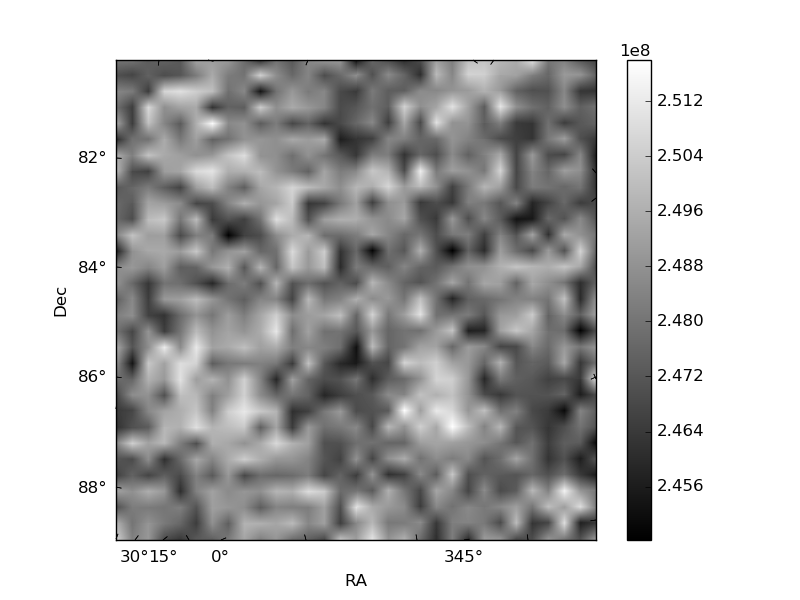
| Quadrant A | 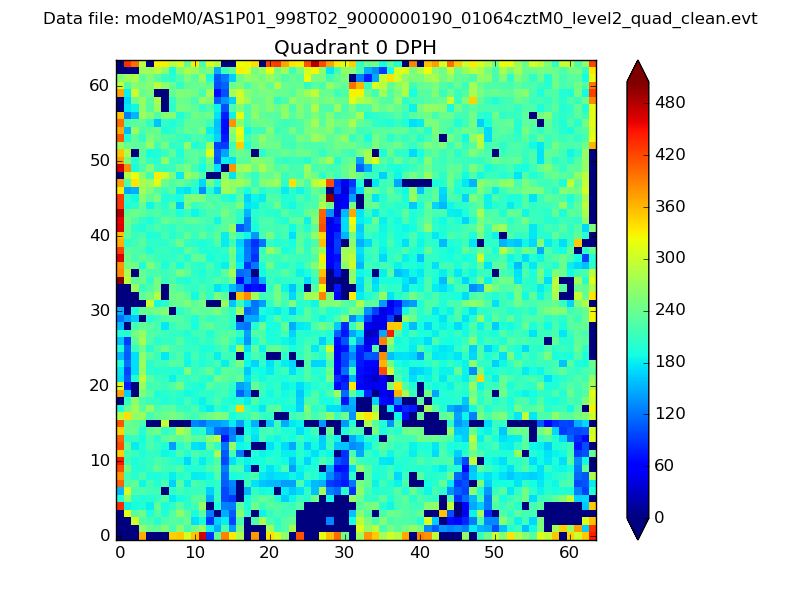 |
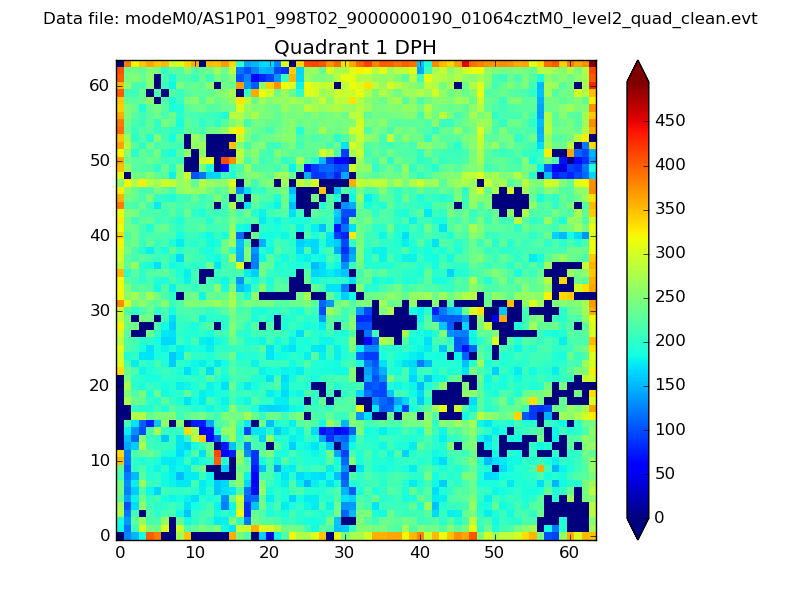 |
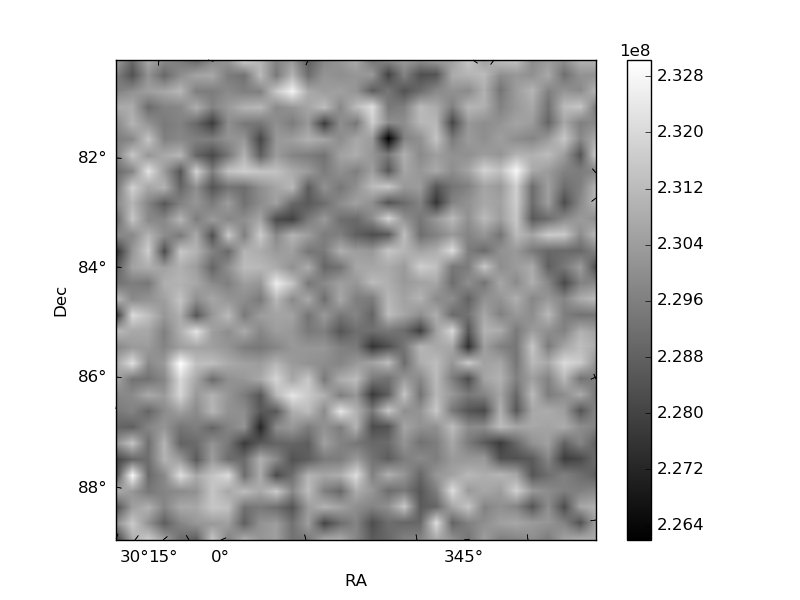
Quadrant B |
|---|---|---|---|
| Quadrant D | 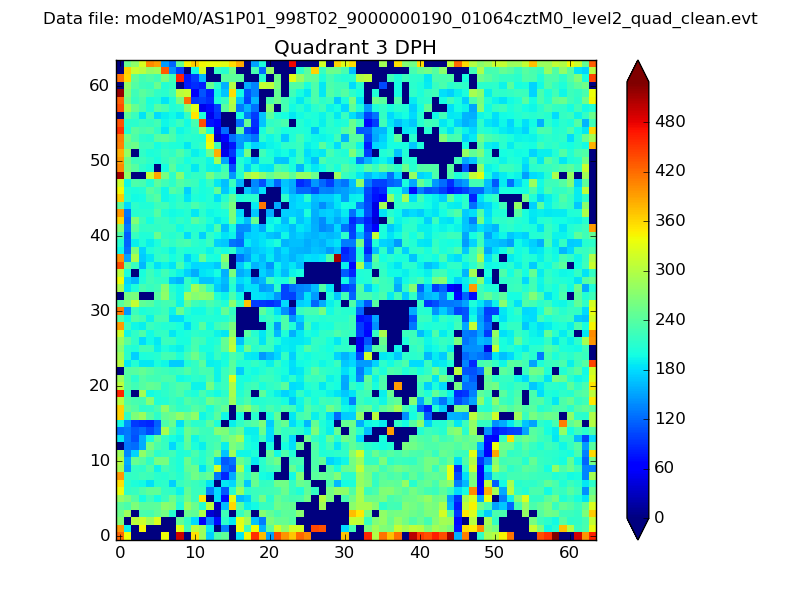 |
 |
Quadrant C |
| Plot type | Count rate plots | Images |
|---|---|---|
| Comparison with Poisson distribution Blue bars denote a histogram of data divided into 1 sec bins. Red curve is a Poisson curve with rate = median count rate of data. |
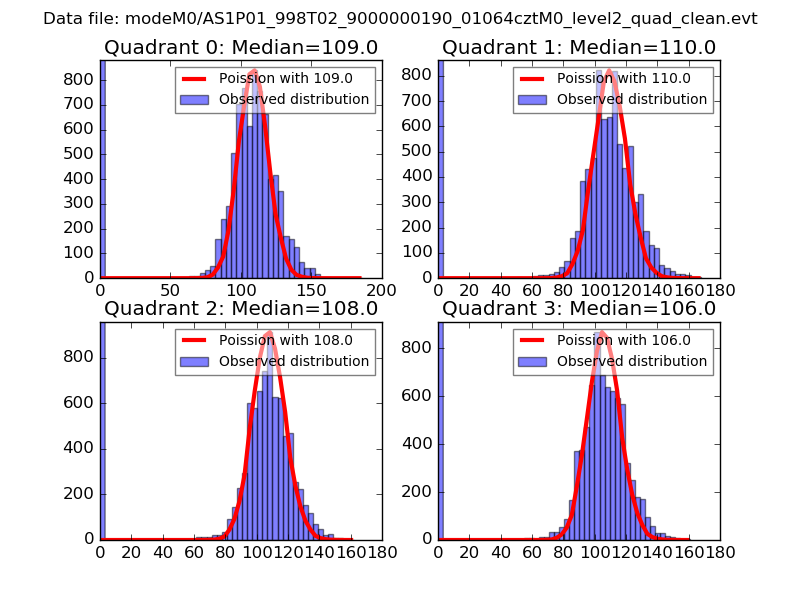 |
 |
| Quadrant-wise count rates Data is divided into 100 sec bins |
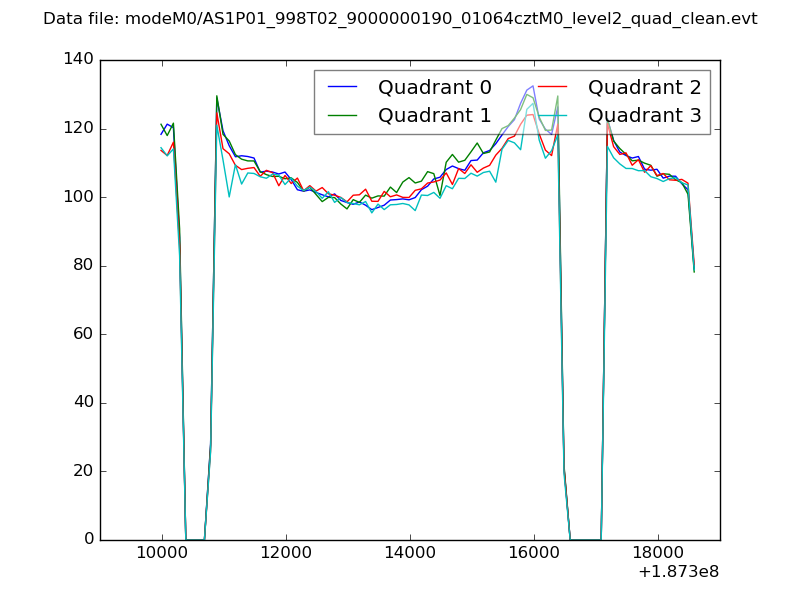 |
|
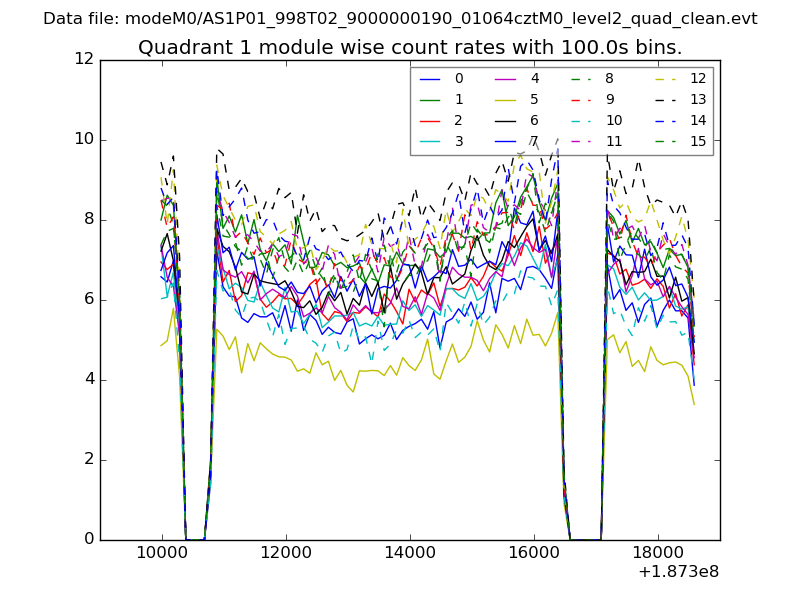
| Module-wise count rates for Quadrant A Data is divided into 100 sec bins |
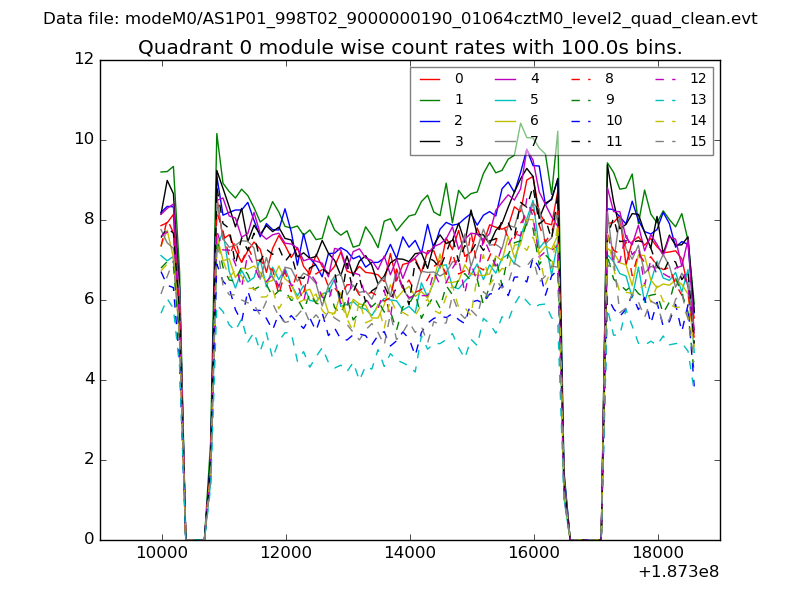 |
 |
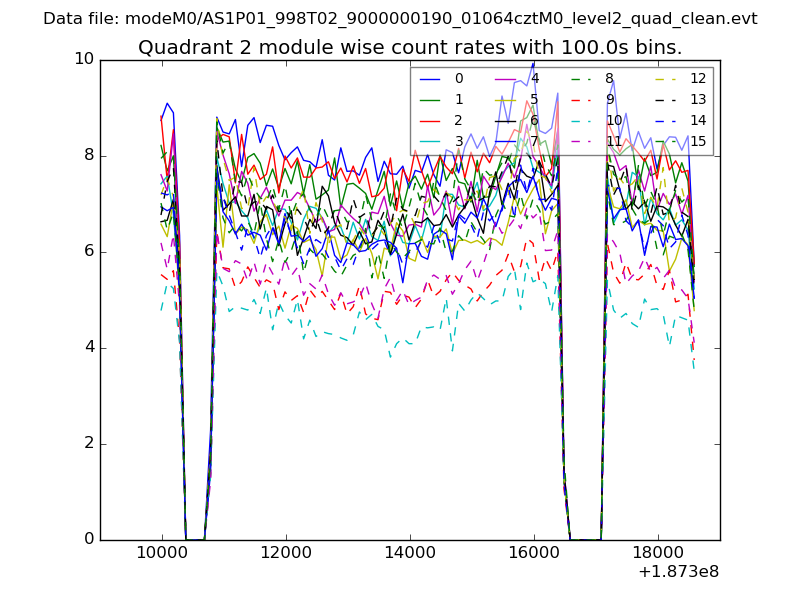
| Module-wise count rates for Quadrant B Data is divided into 100 sec bins |
 |
 |
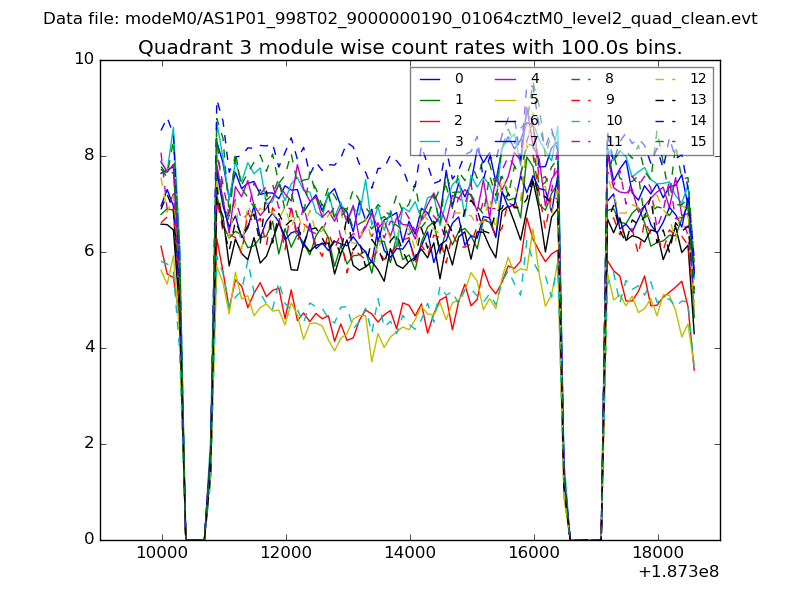
| Module-wise count rates for Quadrant C Data is divided into 100 sec bins |
 |
 |
| Module-wise count rates for Quadrant D Data is divided into 100 sec bins |
 |
 |
| Parameter | Plot |
|---|---|
| CZT HV Monitor | 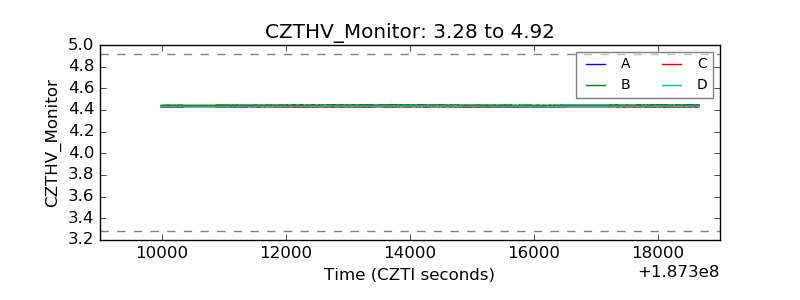 |
| D_VDD | 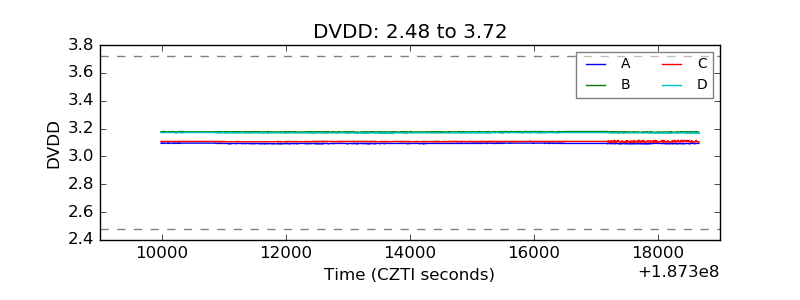 |
| Temperature 1 | 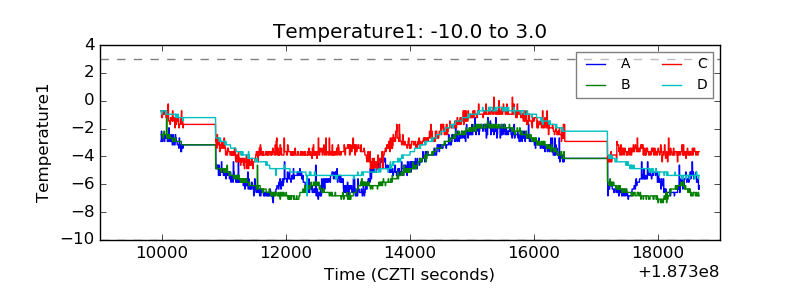 |
| Veto HV Monitor | 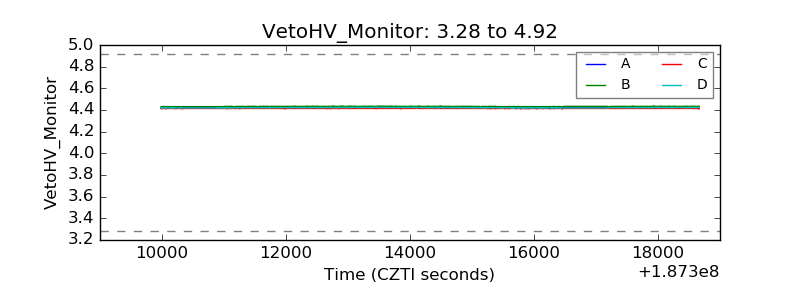 |
| Veto LLD |  |
| Alpha Counter | 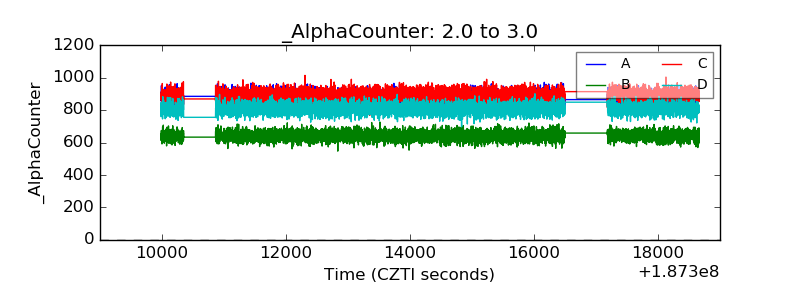 |
| _CPM_Rate | 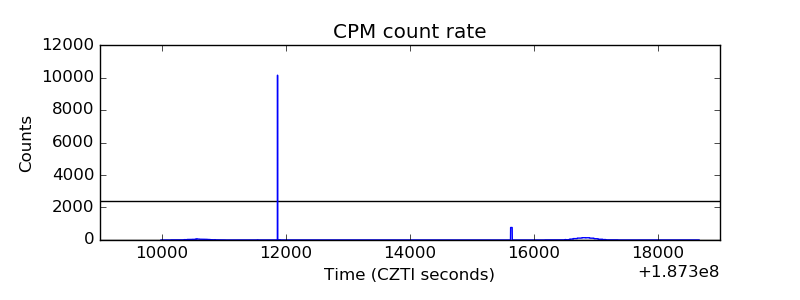 |
| CZT Counter | 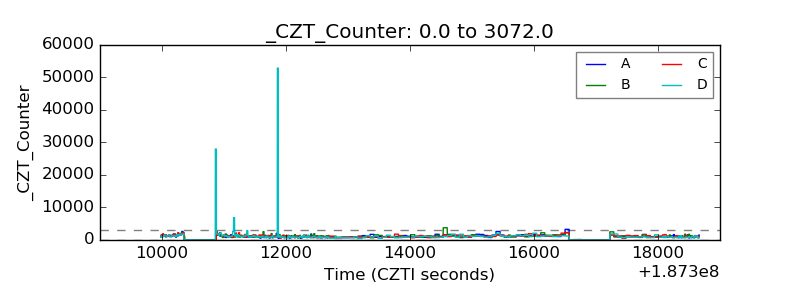 |
| +2.5 Volts monitor |  |
| +5 Volts monitor |  |
| _ROLL_ROT |  |
| _Roll_DEC | 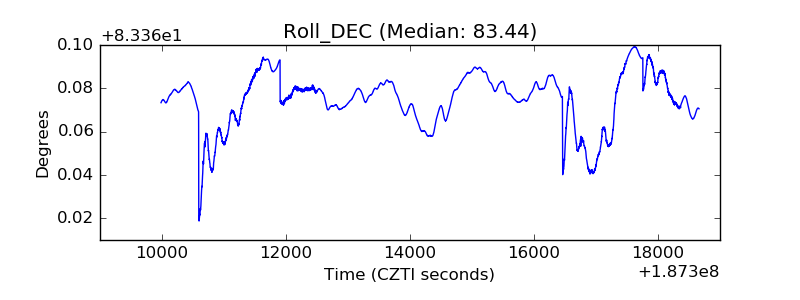 |
| _Roll_RA | 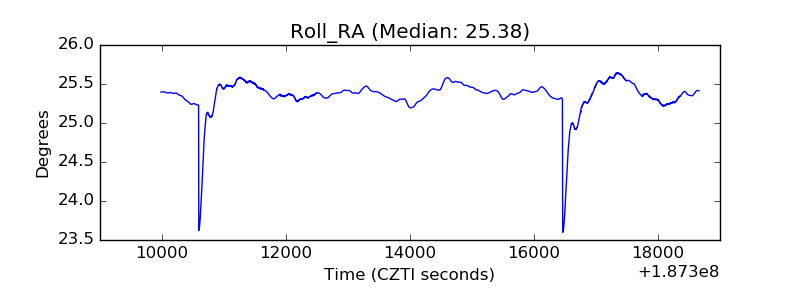 |
| Veto Counter | 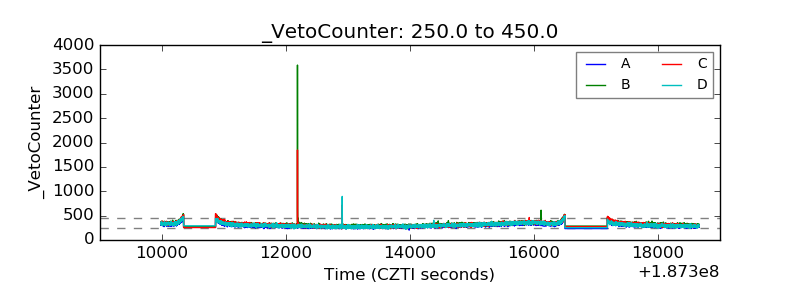 |