| Param | Original file | Final file |
|---|---|---|
| Filename | modeM0/AS1P01_998T02_9000000190_01066cztM0_level2.evt | modeM0/AS1P01_998T02_9000000190_01066cztM0_level2_quad_clean.evt |
| Size (bytes) | 1,157,244,480 | 105,062,400 |
| Size | 1.1 GB | 100.2 MB |
| Events in quadrant A | 7,529,506 | 723,148 |
| Events in quadrant B | 8,131,891 | 727,065 |
| Events in quadrant C | 11,909,247 | 577,987 |
| Events in quadrant D | 7,043,634 | 697,449 |
| Mode M0 | |||
|---|---|---|---|
| Quadrant | BADHDUFLAG | Total packets | Discarded packets |
| A | 0 | 27014 | 1 |
| B | 0 | 28788 | 1 |
| C | 0 | 40350 | 1 |
| D | 0 | 25584 | 1 |
| Mode SS | |||
|---|---|---|---|
| Quadrant | BADHDUFLAG | Total packets | Discarded packets |
| A | 0 | 134 | 0 |
| B | 0 | 134 | 0 |
| C | 0 | 134 | 0 |
| D | 0 | 134 | 0 |
| Mode M9 | |||
|---|---|---|---|
| Quadrant | BADHDUFLAG | Total packets | Discarded packets |
| A | 0 | 9 | 0 |
| B | 0 | 9 | 0 |
| C | 0 | 9 | 0 |
| D | 0 | 9 | 0 |
| Quadrant | Total seconds | Saturated seconds | Saturation percentage |
|---|---|---|---|
| A | 6523 | 31 | 0.475241% |
| B | 6523 | 91 | 1.395064% |
| C | 6523 | 2192 | 33.604170% |
| D | 6523 | 43 | 0.659206% |
Noise dominated data is calculated using 1-second bins in cleaned event files. If a bin has >2000 counts, and if more than 50% of those come from <1% of pixels, then it is considered to be noise-dominated and hence unusable.
| Quadrant | # 1 sec bins | Bins with >0 counts | Bins with >2000 counts | High rate bins dominated by noise | Noise dominated (total time) | Noise dominated (detector-on time) | Marked lightcurve |
|---|---|---|---|---|---|---|---|
| A | 7463 | 6524 | 135 | 135 | 1.81% | 2.07% | 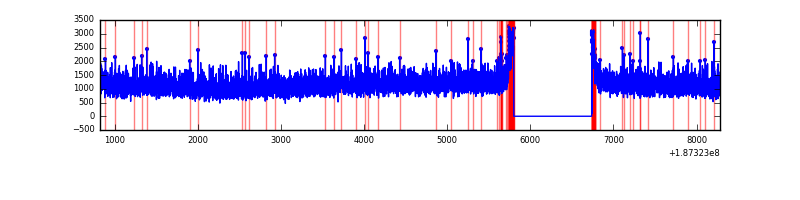 |
| B | 7463 | 6524 | 300 | 300 | 4.02% | 4.60% | 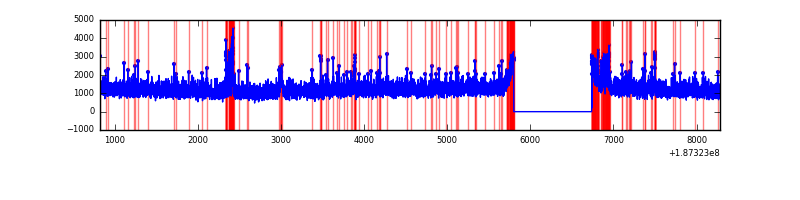 |
| C | 7463 | 6524 | 2305 | 2305 | 30.89% | 35.33% | 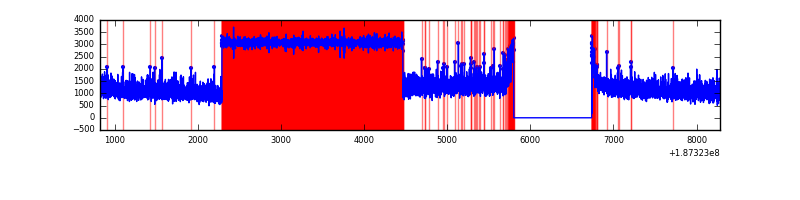 |
| D | 7463 | 6524 | 208 | 208 | 2.79% | 3.19% |  |
Top three noisy pixels from each quadrant. If the there are fewer than three noisy pixels in the level2.evt file, extra rows are filled as -1
| Pixel properties | Quadrant properties | ||||||
|---|---|---|---|---|---|---|---|
| Quadrant | DetID | PixID | Counts | Sigma | Mean | Median | Sigma |
| A | 0 | 253 | 64240 | 134.07 | 1944 | 1960 | 464.5 |
| A | 11 | 79 | 7198 | 11.28 | 1944 | 1960 | 464.5 |
| A | 3 | 111 | 6215 | 9.16 | 1944 | 1960 | 464.5 |
| B | 5 | 191 | 292081 | 599.61 | 2030 | 2044 | 483.7 |
| B | 15 | 22 | 67789 | 135.92 | 2030 | 2044 | 483.7 |
| B | 7 | 221 | 29947 | 57.69 | 2030 | 2044 | 483.7 |
| C | 0 | 191 | 5529319 | 12741.27 | 1551 | 1607 | 433.8 |
| C | 15 | 241 | 281834 | 645.92 | 1551 | 1607 | 433.8 |
| C | 3 | 111 | 20414 | 43.35 | 1551 | 1607 | 433.8 |
| D | 9 | 64 | 162341 | 295.72 | 1764 | 1824 | 542.8 |
| D | 13 | 73 | 88701 | 160.05 | 1764 | 1824 | 542.8 |
| D | 10 | 125 | 73728 | 132.47 | 1764 | 1824 | 542.8 |
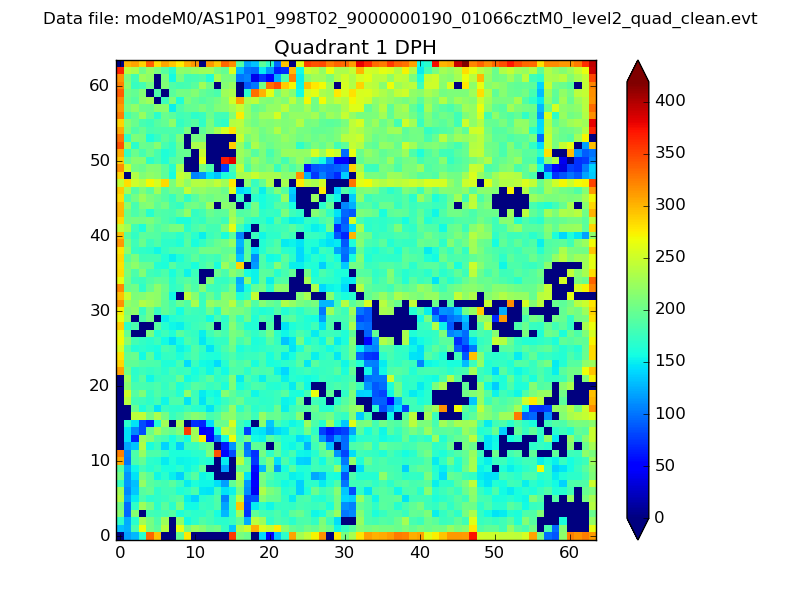
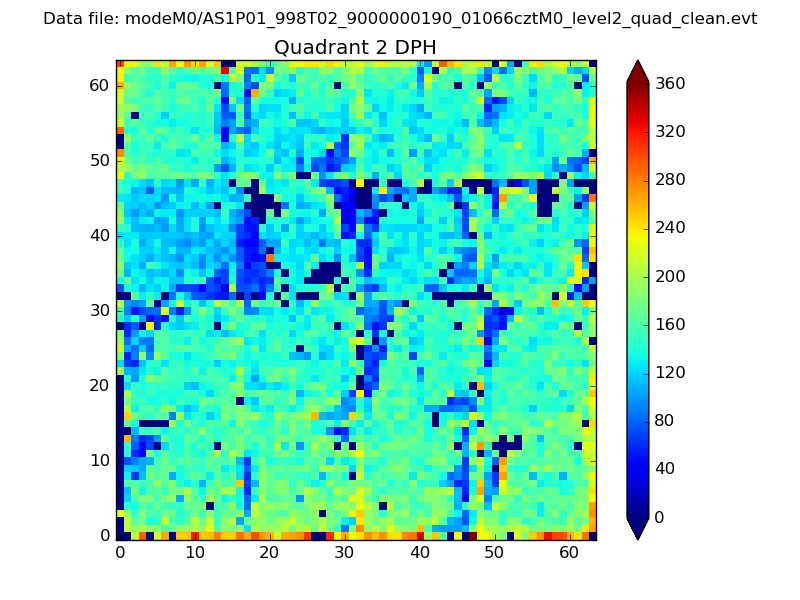
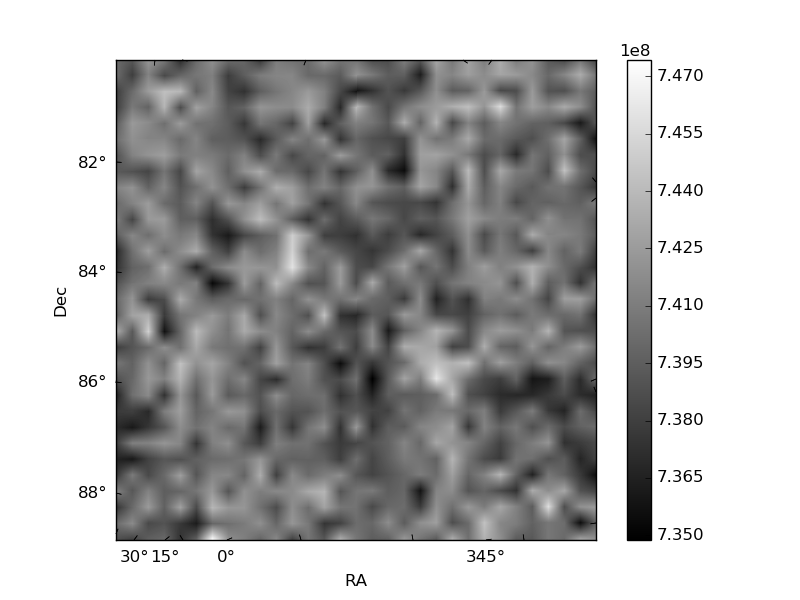
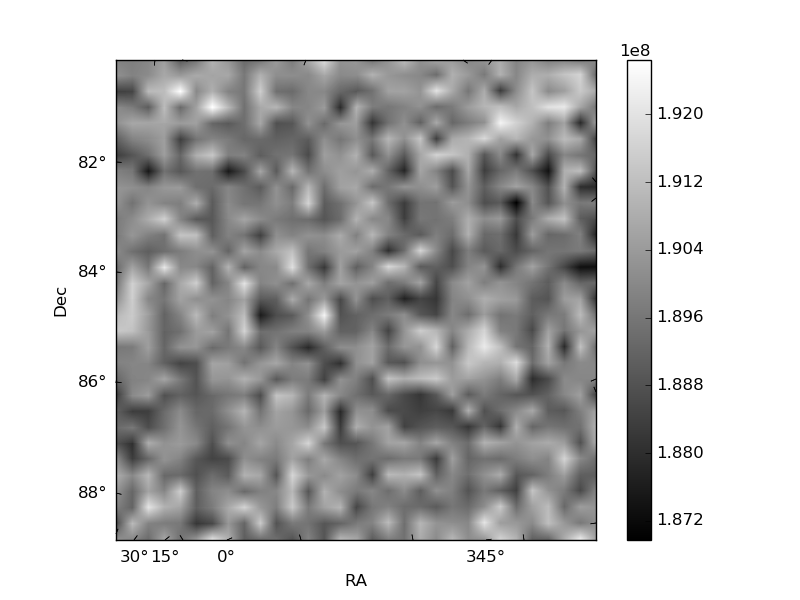
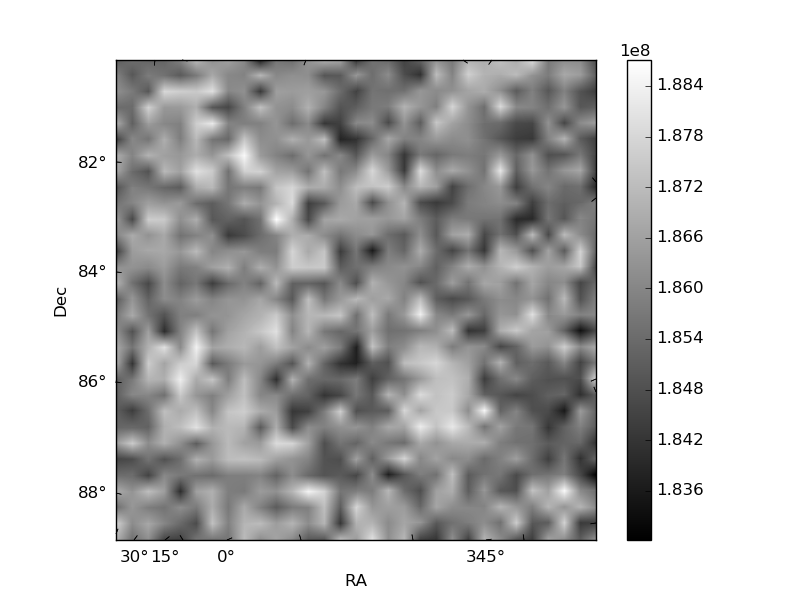
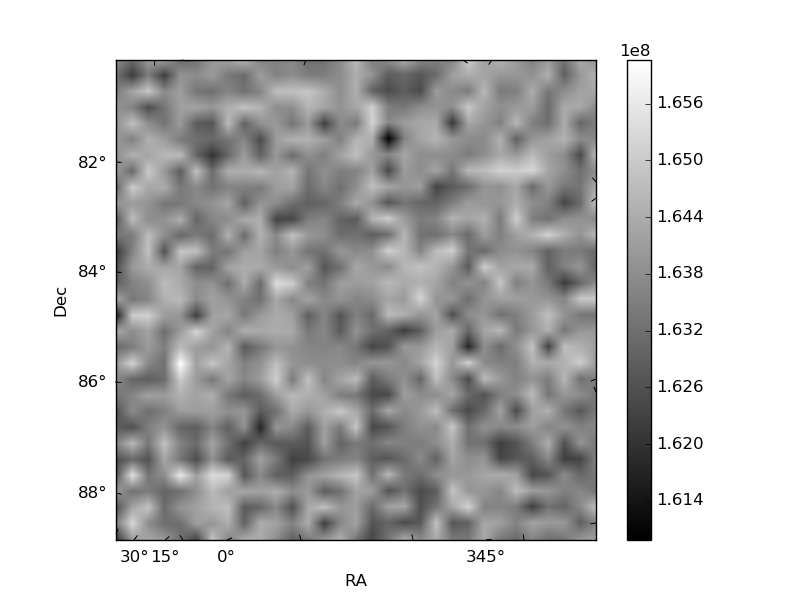
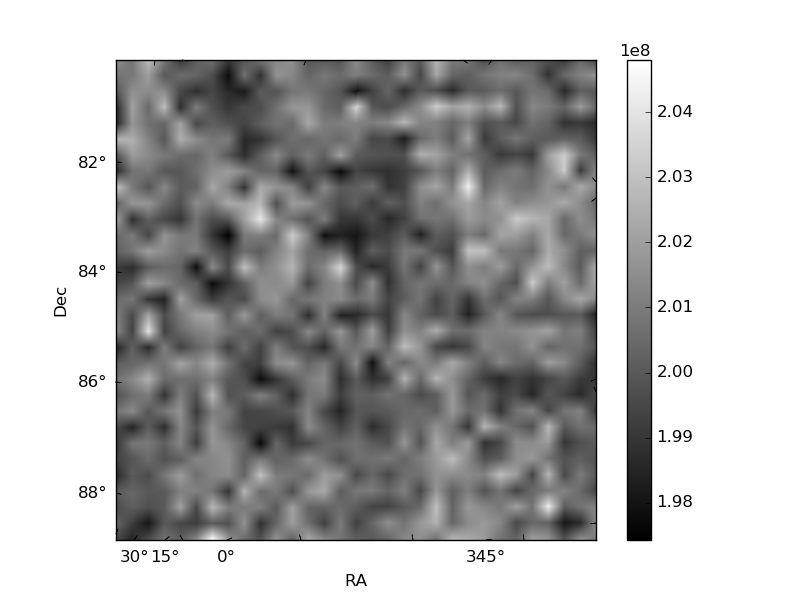
Histogram calculated using DETX and DETY for each event in the final _common_clean file
| Quadrant A | 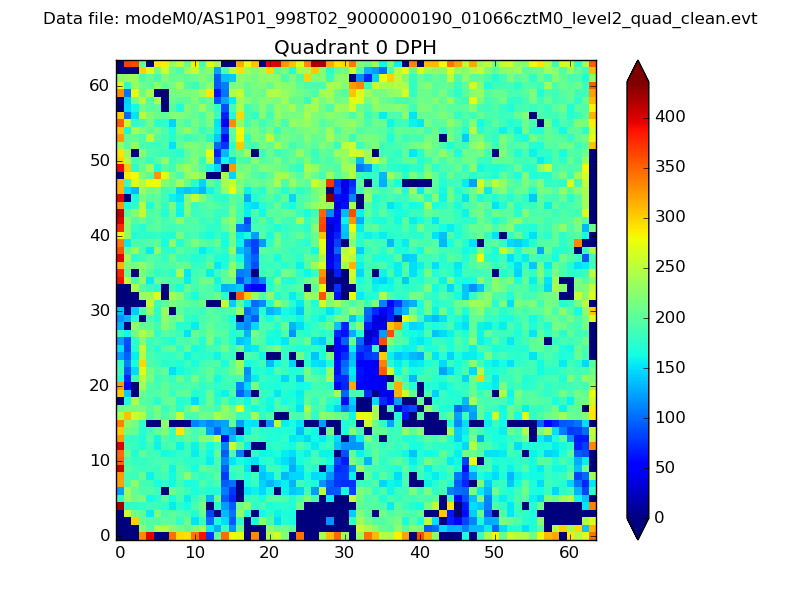 |
 |
Quadrant B |
|---|---|---|---|
| Quadrant D | 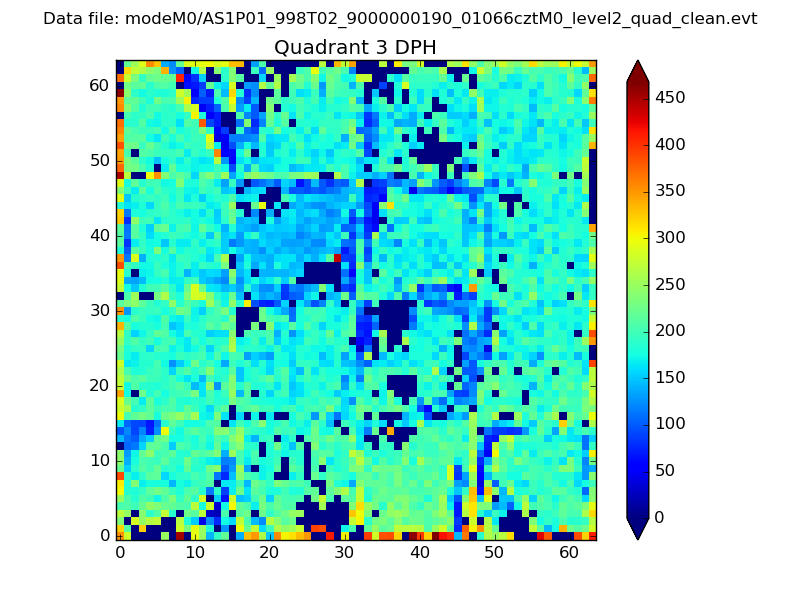 |
 |
Quadrant C |
| Plot type | Count rate plots | Images |
|---|---|---|
| Comparison with Poisson distribution Blue bars denote a histogram of data divided into 1 sec bins. Red curve is a Poisson curve with rate = median count rate of data. |
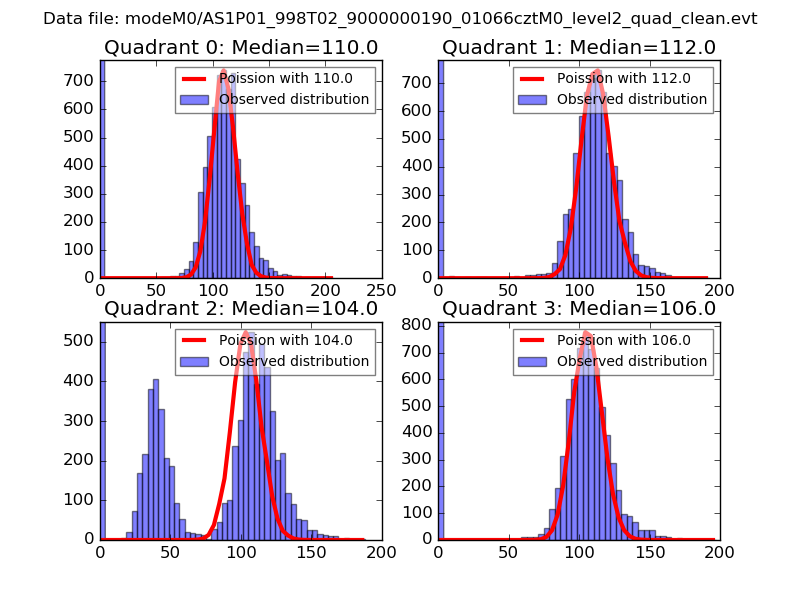 |
 |
| Quadrant-wise count rates Data is divided into 100 sec bins |
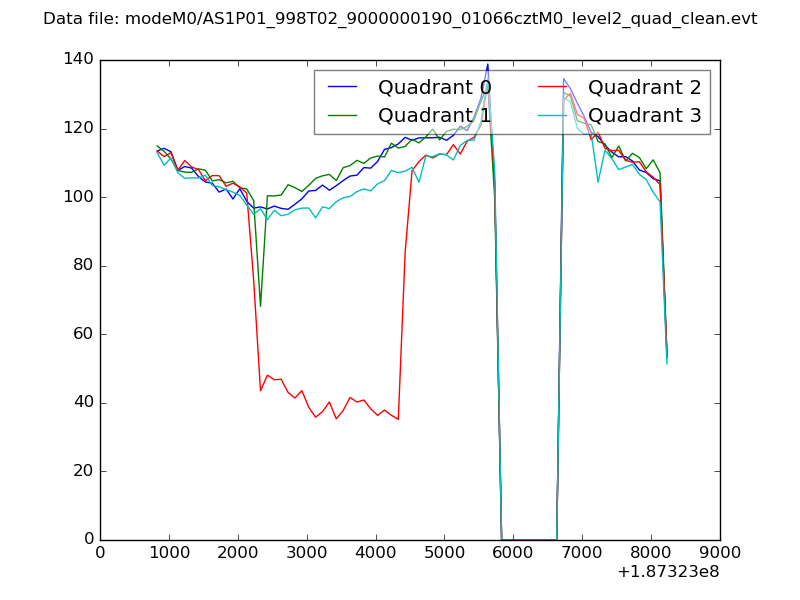 |
|
| Module-wise count rates for Quadrant A Data is divided into 100 sec bins |
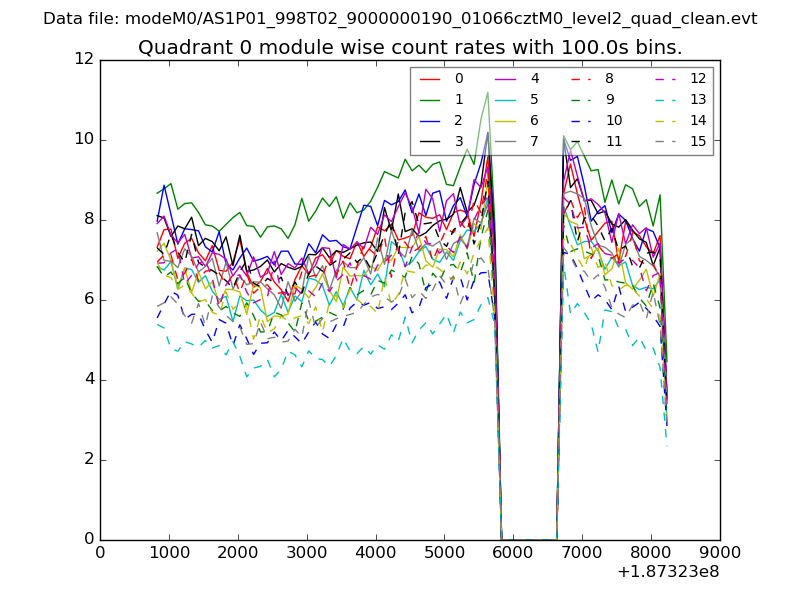 |
 |
| Module-wise count rates for Quadrant B Data is divided into 100 sec bins |
 |
 |
| Module-wise count rates for Quadrant C Data is divided into 100 sec bins |
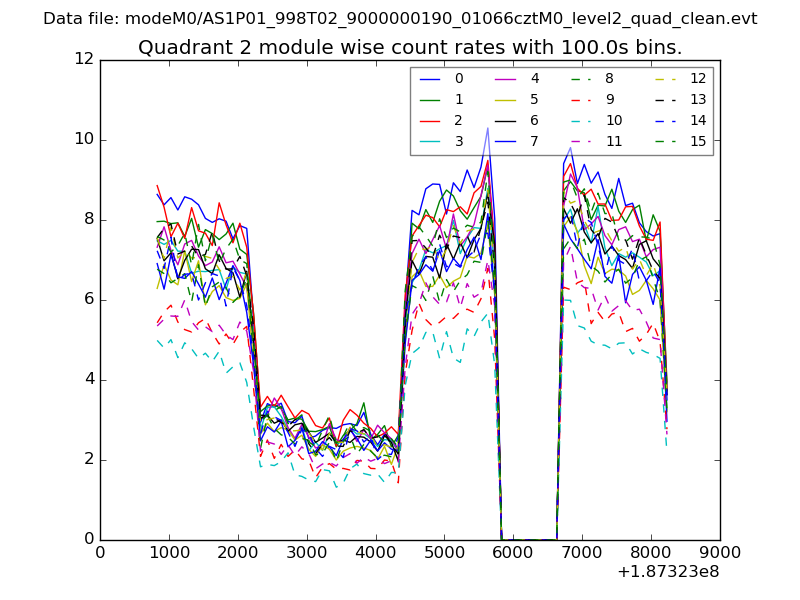 |
 |
| Module-wise count rates for Quadrant D Data is divided into 100 sec bins |
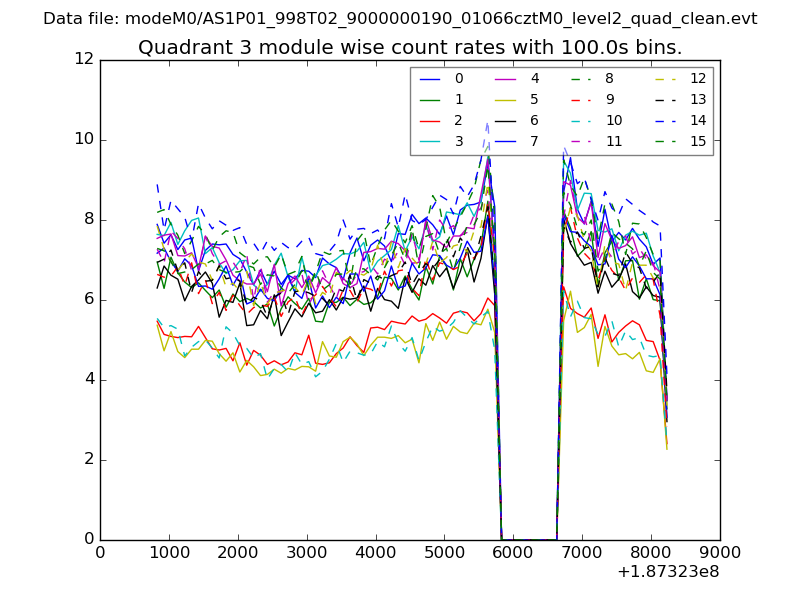 |
 |
| Parameter | Plot |
|---|---|
| CZT HV Monitor | 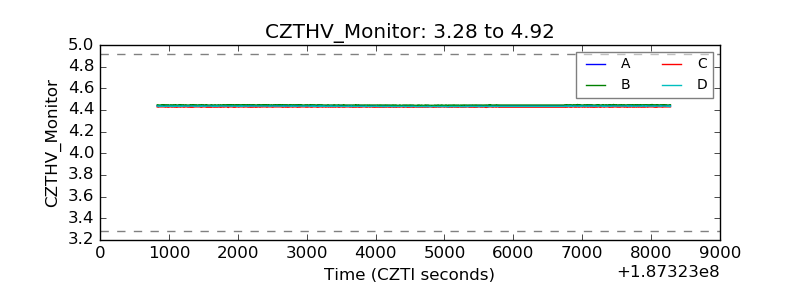 |
| D_VDD | 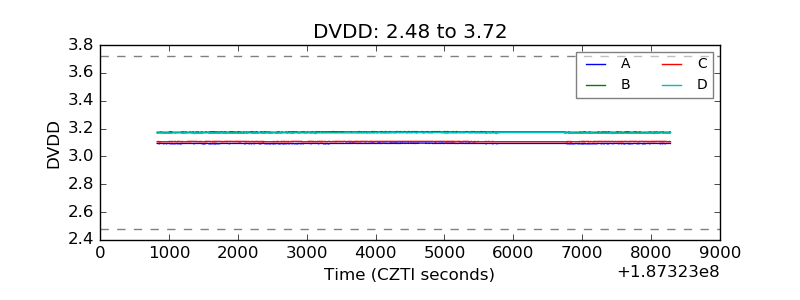 |
| Temperature 1 | 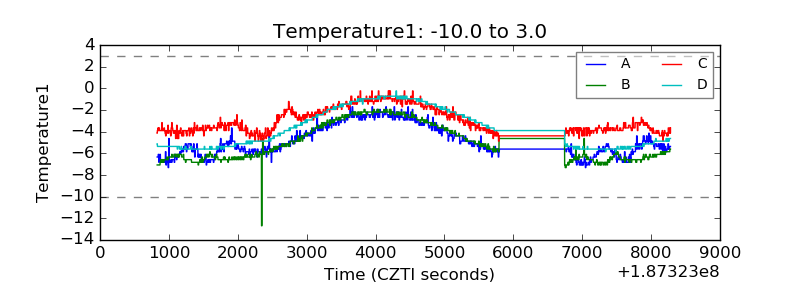 |
| Veto HV Monitor | 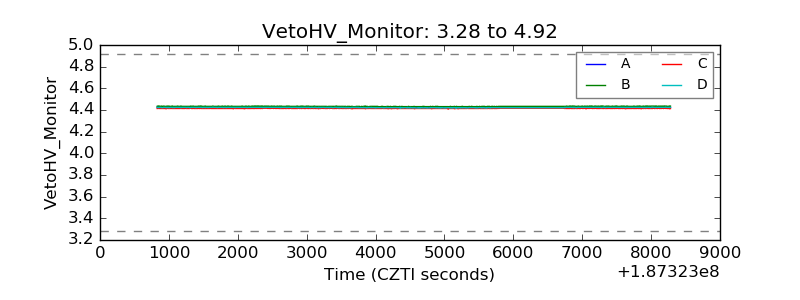 |
| Veto LLD | 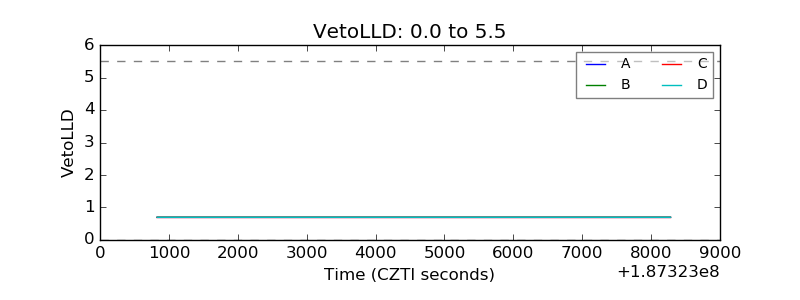 |
| Alpha Counter | 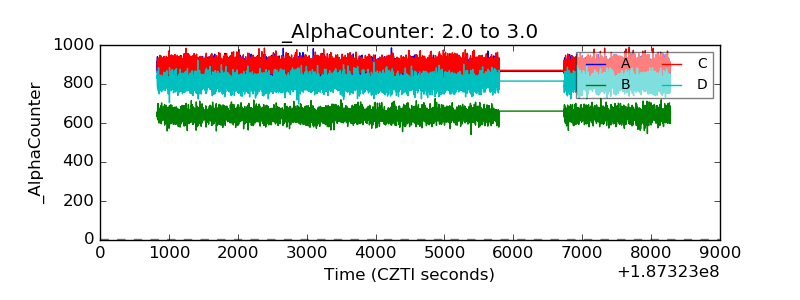 |
| _CPM_Rate | 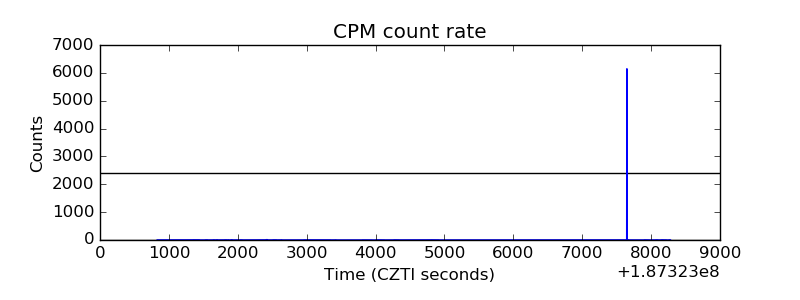 |
| CZT Counter | 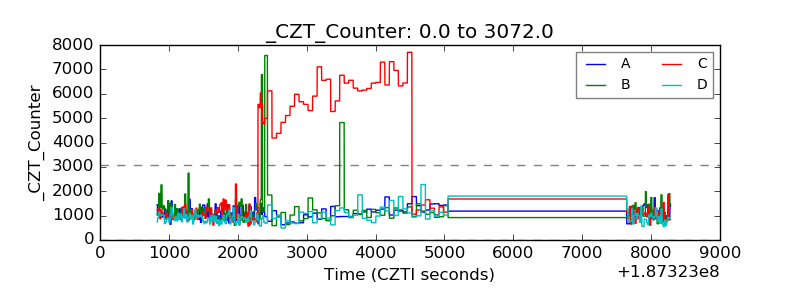 |
| +2.5 Volts monitor |  |
| +5 Volts monitor |  |
| _ROLL_ROT | 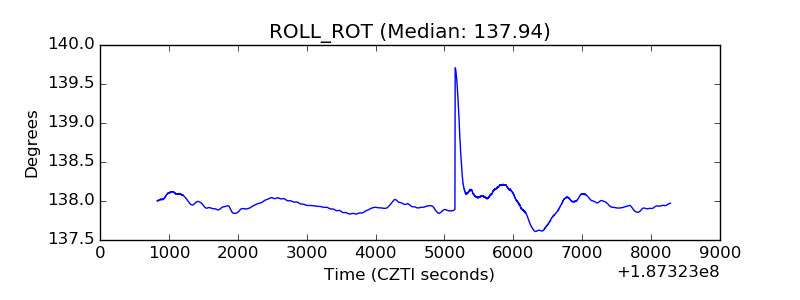 |
| _Roll_DEC | 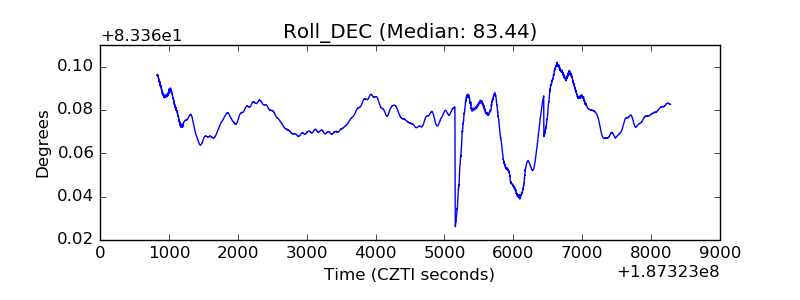 |
| _Roll_RA | 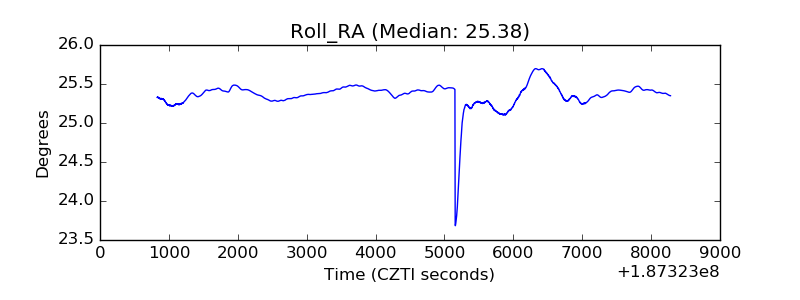 |
| Veto Counter | 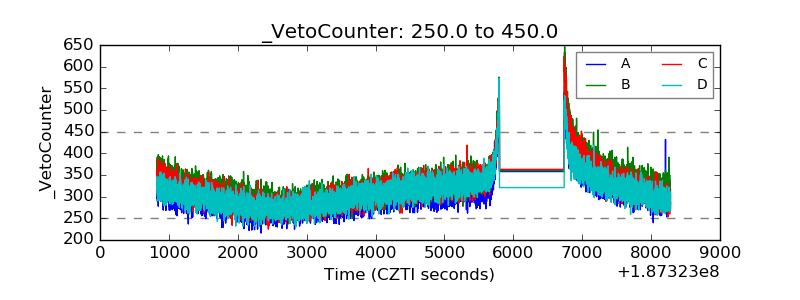 |