| Param | Original file | Final file |
|---|---|---|
| Filename | modeM0/AS1P01_998T02_9000000190_01068cztM0_level2.evt | modeM0/AS1P01_998T02_9000000190_01068cztM0_level2_quad_clean.evt |
| Size (bytes) | 921,715,200 | 99,751,680 |
| Size | 879.0 MB | 95.1 MB |
| Events in quadrant A | 6,769,846 | 665,646 |
| Events in quadrant B | 7,347,284 | 673,829 |
| Events in quadrant C | 6,881,062 | 640,499 |
| Events in quadrant D | 6,528,632 | 633,562 |
| Mode M0 | |||
|---|---|---|---|
| Quadrant | BADHDUFLAG | Total packets | Discarded packets |
| A | 0 | 24257 | 1 |
| B | 0 | 25945 | 6 |
| C | 0 | 24603 | 1 |
| D | 0 | 23569 | 1 |
| Mode SS | |||
|---|---|---|---|
| Quadrant | BADHDUFLAG | Total packets | Discarded packets |
| A | 0 | 118 | 0 |
| B | 0 | 118 | 0 |
| C | 0 | 118 | 0 |
| D | 0 | 118 | 0 |
| Mode M9 | |||
|---|---|---|---|
| Quadrant | BADHDUFLAG | Total packets | Discarded packets |
| A | 0 | 11 | 0 |
| B | 0 | 11 | 0 |
| C | 0 | 11 | 0 |
| D | 0 | 11 | 0 |
| Quadrant | Total seconds | Saturated seconds | Saturation percentage |
|---|---|---|---|
| A | 5833 | 16 | 0.274301% |
| B | 5833 | 40 | 0.685753% |
| C | 5833 | 74 | 1.268644% |
| D | 5833 | 33 | 0.565747% |
Noise dominated data is calculated using 1-second bins in cleaned event files. If a bin has >2000 counts, and if more than 50% of those come from <1% of pixels, then it is considered to be noise-dominated and hence unusable.
| Quadrant | # 1 sec bins | Bins with >0 counts | Bins with >2000 counts | High rate bins dominated by noise | Noise dominated (total time) | Noise dominated (detector-on time) | Marked lightcurve |
|---|---|---|---|---|---|---|---|
| A | 6918 | 5834 | 121 | 121 | 1.75% | 2.07% | 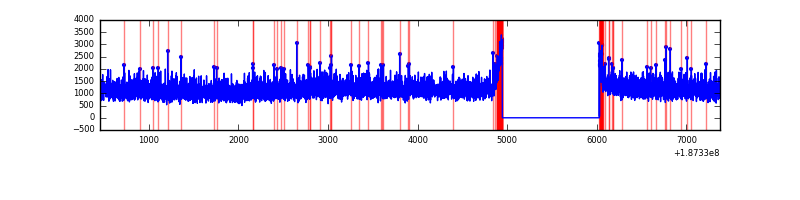 |
| B | 6918 | 5834 | 274 | 274 | 3.96% | 4.70% | 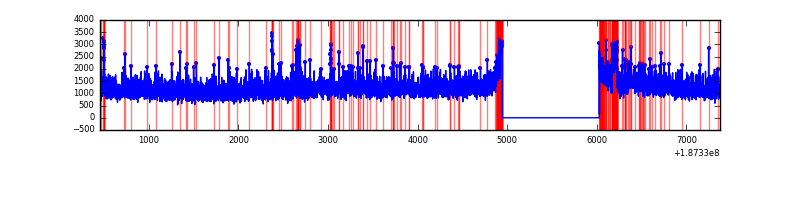 |
| C | 6918 | 5834 | 169 | 169 | 2.44% | 2.90% | 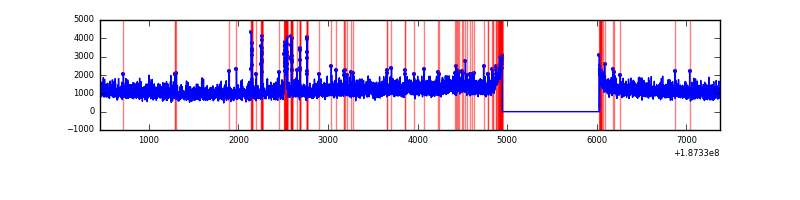 |
| D | 6918 | 5834 | 184 | 184 | 2.66% | 3.15% | 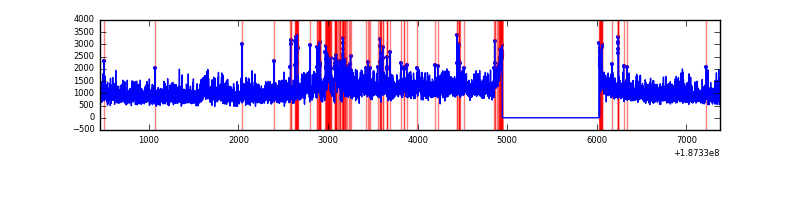 |
Top three noisy pixels from each quadrant. If the there are fewer than three noisy pixels in the level2.evt file, extra rows are filled as -1
| Pixel properties | Quadrant properties | ||||||
|---|---|---|---|---|---|---|---|
| Quadrant | DetID | PixID | Counts | Sigma | Mean | Median | Sigma |
| A | 0 | 253 | 6691 | 11.72 | 1762 | 1773 | 419.6 |
| A | 11 | 79 | 6590 | 11.48 | 1762 | 1773 | 419.6 |
| A | 3 | 111 | 5641 | 9.22 | 1762 | 1773 | 419.6 |
| B | 5 | 63 | 138247 | 315.95 | 1830 | 1842 | 431.7 |
| B | 5 | 191 | 111765 | 254.61 | 1830 | 1842 | 431.7 |
| B | 8 | 219 | 32503 | 71.02 | 1830 | 1842 | 431.7 |
| C | 15 | 241 | 290028 | 642.01 | 1613 | 1670 | 449.2 |
| C | 0 | 191 | 243006 | 537.31 | 1613 | 1670 | 449.2 |
| C | 3 | 111 | 21876 | 44.99 | 1613 | 1670 | 449.2 |
| D | 1 | 83 | 390916 | 786.79 | 1597 | 1655 | 494.7 |
| D | 2 | 216 | 71542 | 141.26 | 1597 | 1655 | 494.7 |
| D | 13 | 73 | 46149 | 89.93 | 1597 | 1655 | 494.7 |
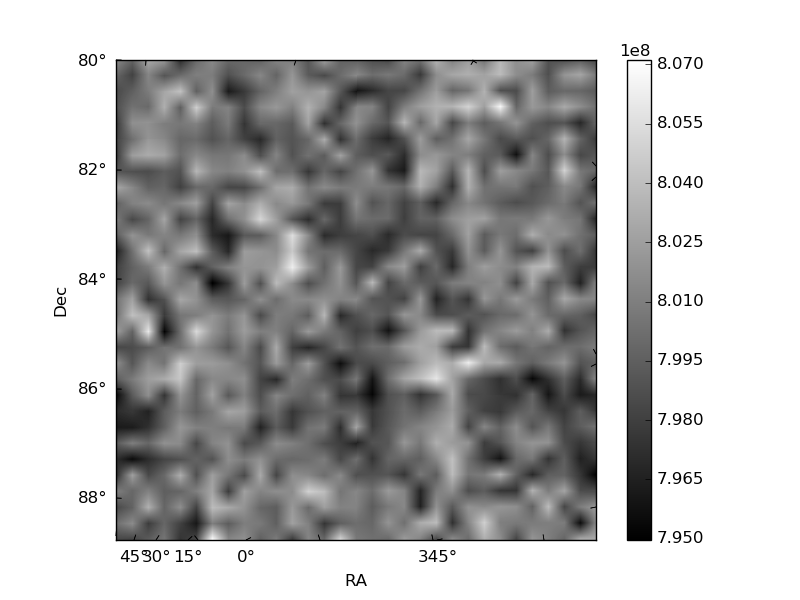
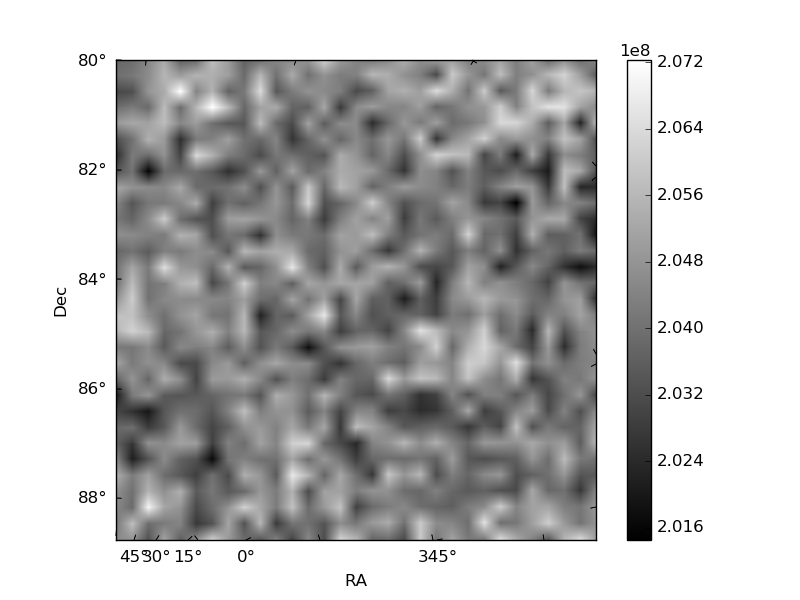
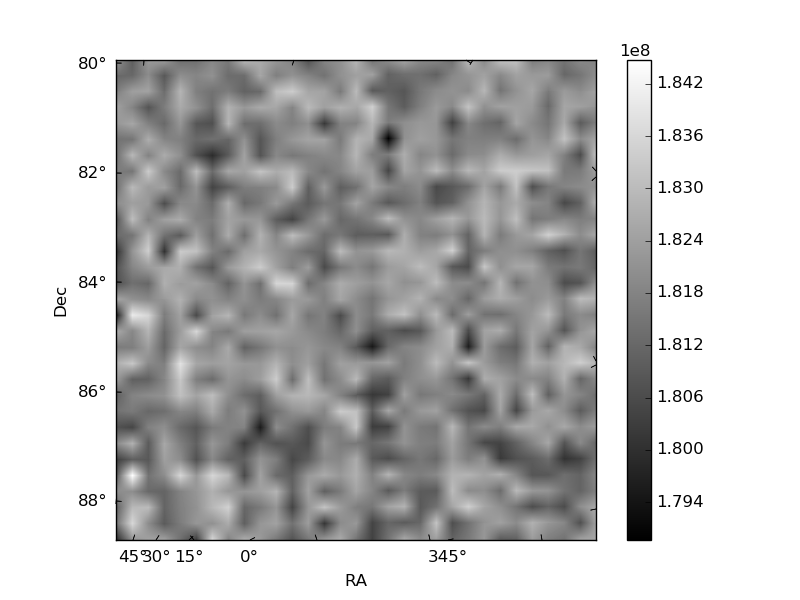
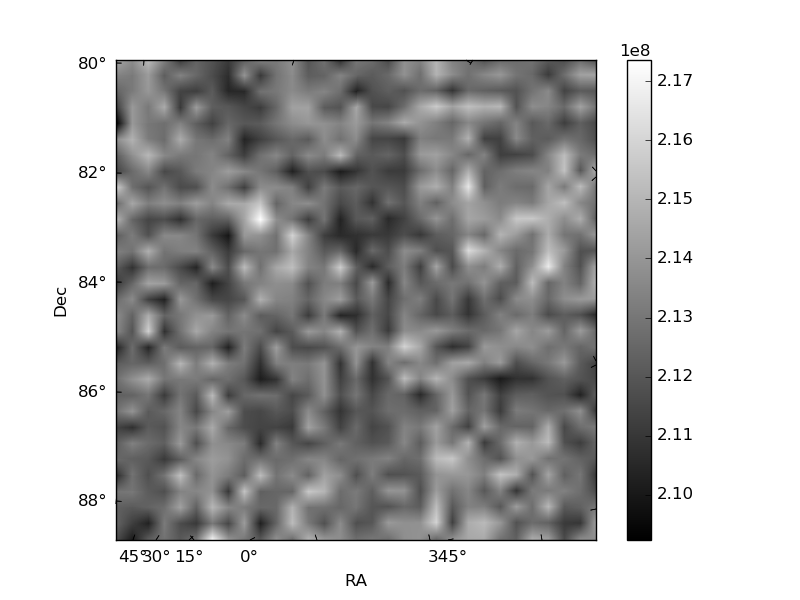
Histogram calculated using DETX and DETY for each event in the final _common_clean file
| Quadrant A | 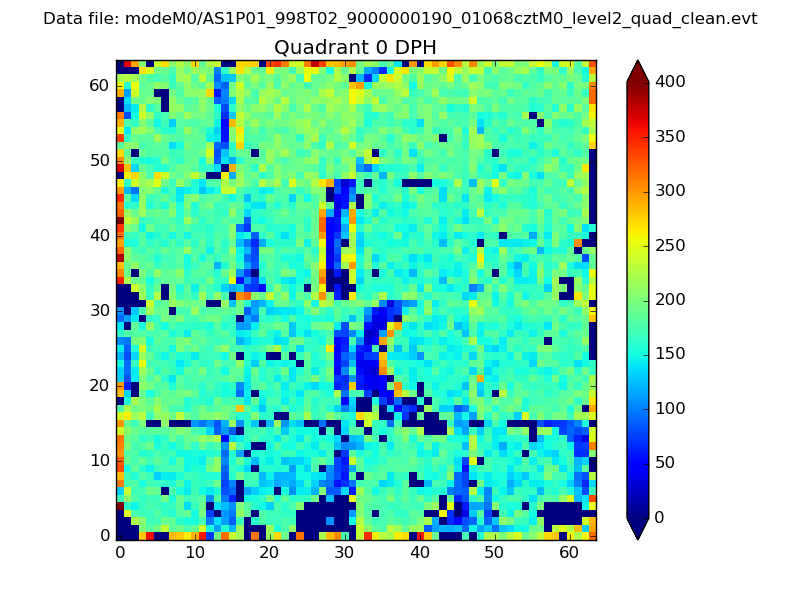 |
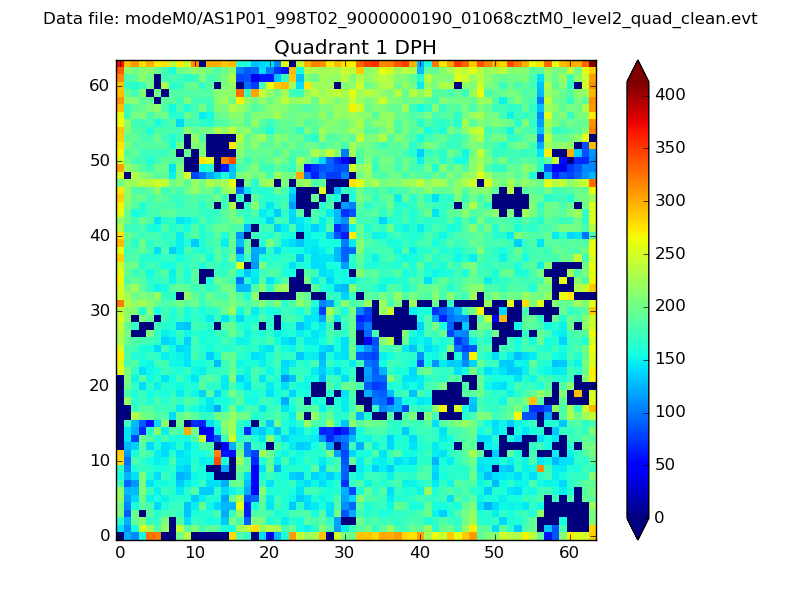 |
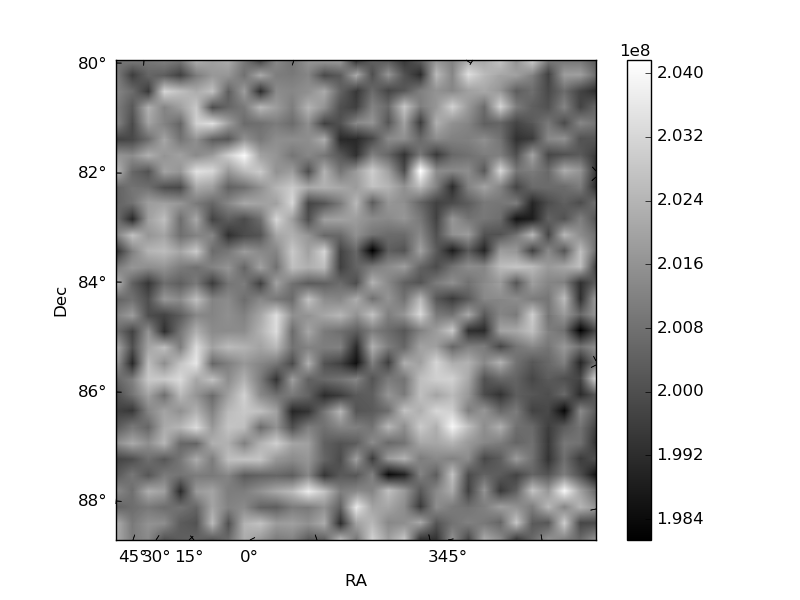
Quadrant B |
|---|---|---|---|
| Quadrant D | 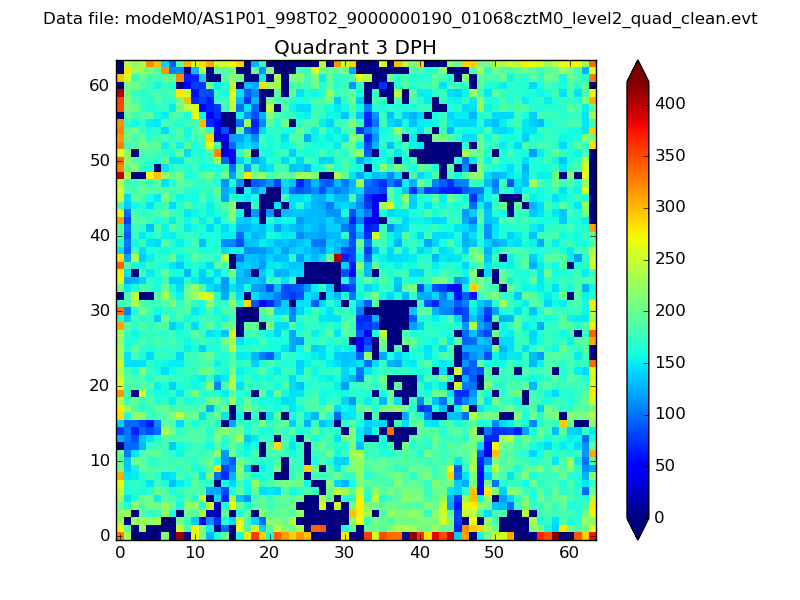 |
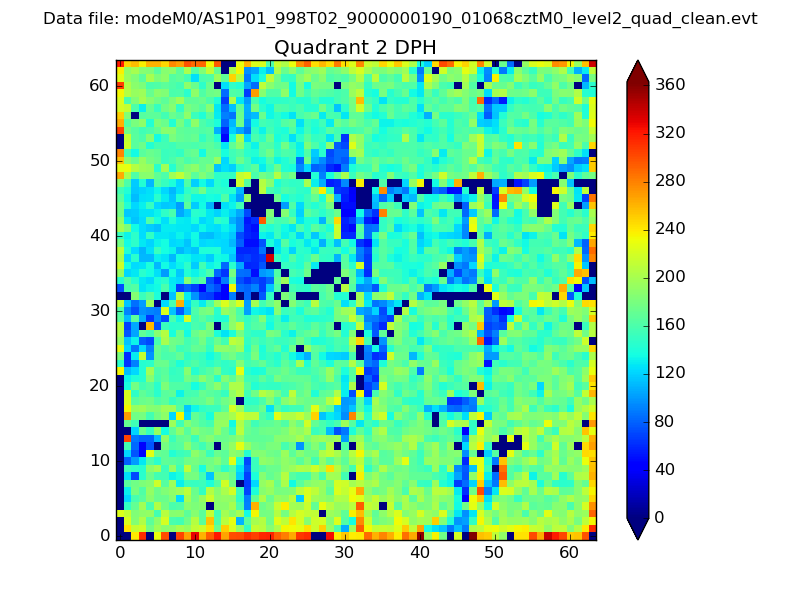 |
Quadrant C |
| Plot type | Count rate plots | Images |
|---|---|---|
| Comparison with Poisson distribution Blue bars denote a histogram of data divided into 1 sec bins. Red curve is a Poisson curve with rate = median count rate of data. |
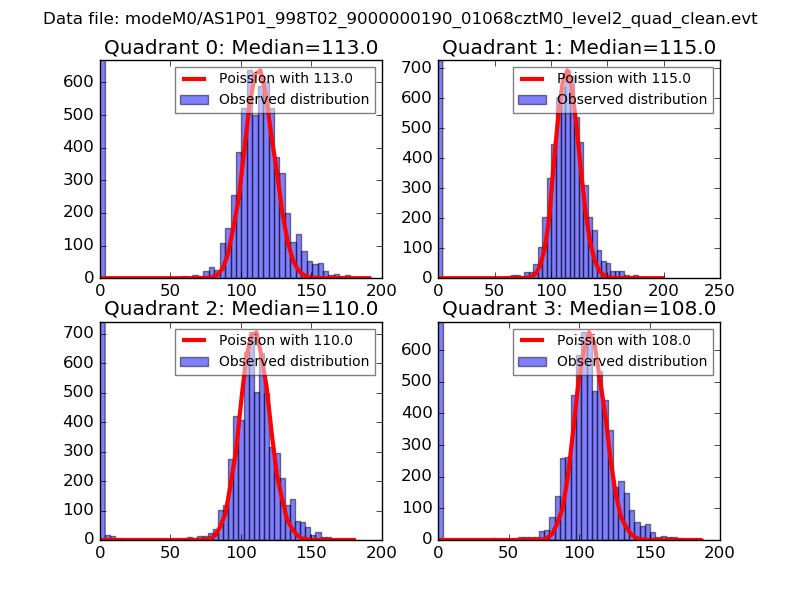 |
 |
| Quadrant-wise count rates Data is divided into 100 sec bins |
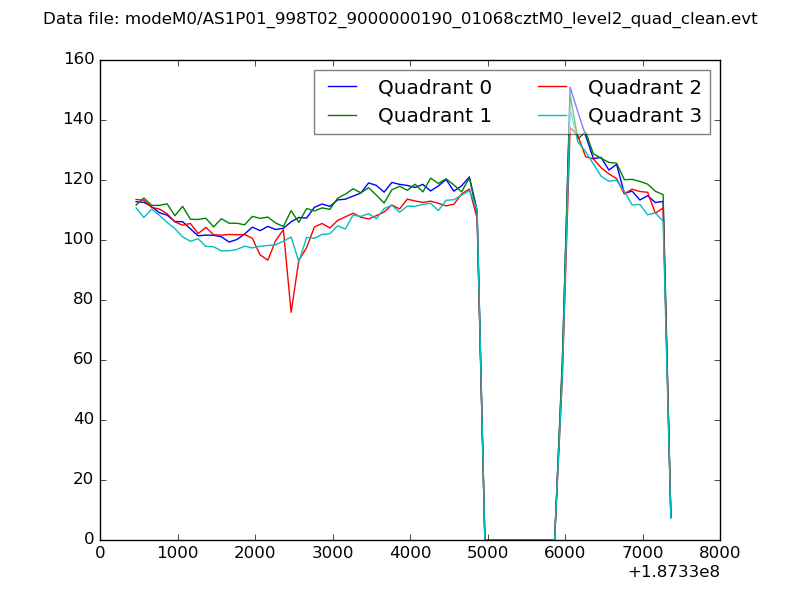 |
|
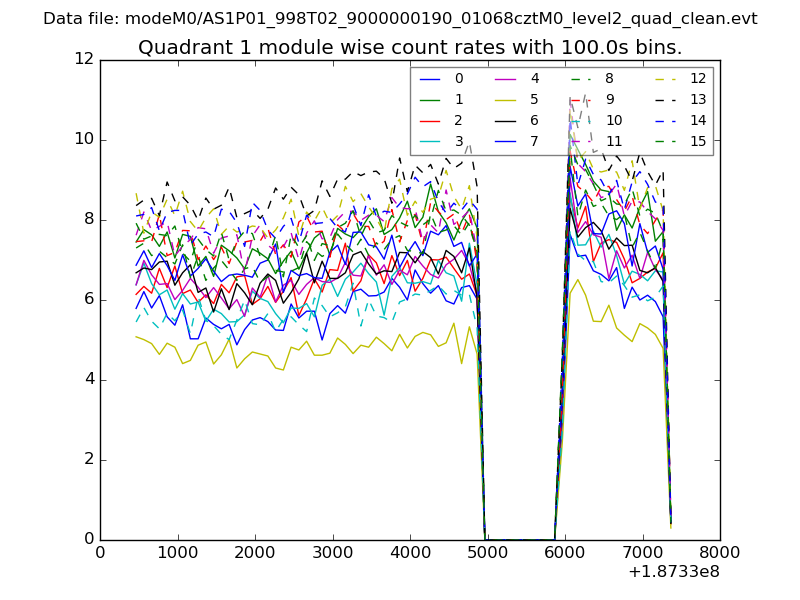
| Module-wise count rates for Quadrant A Data is divided into 100 sec bins |
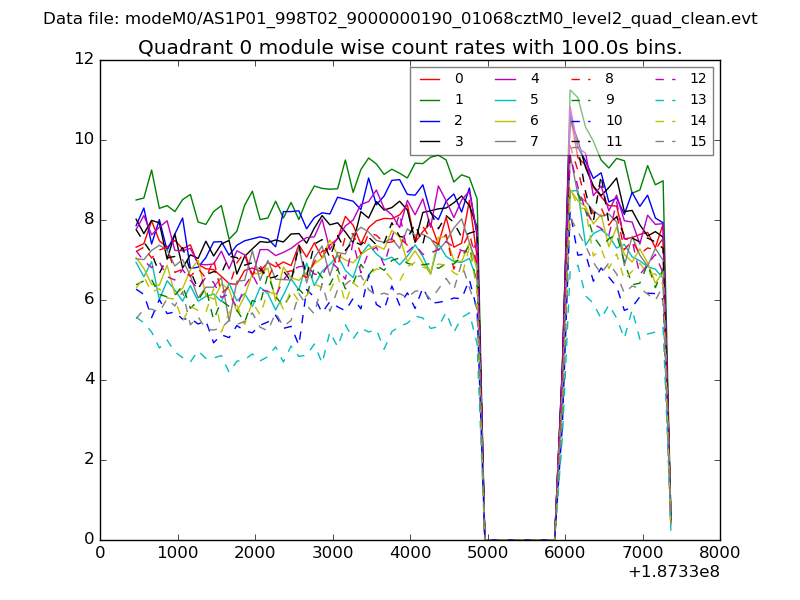 |
 |
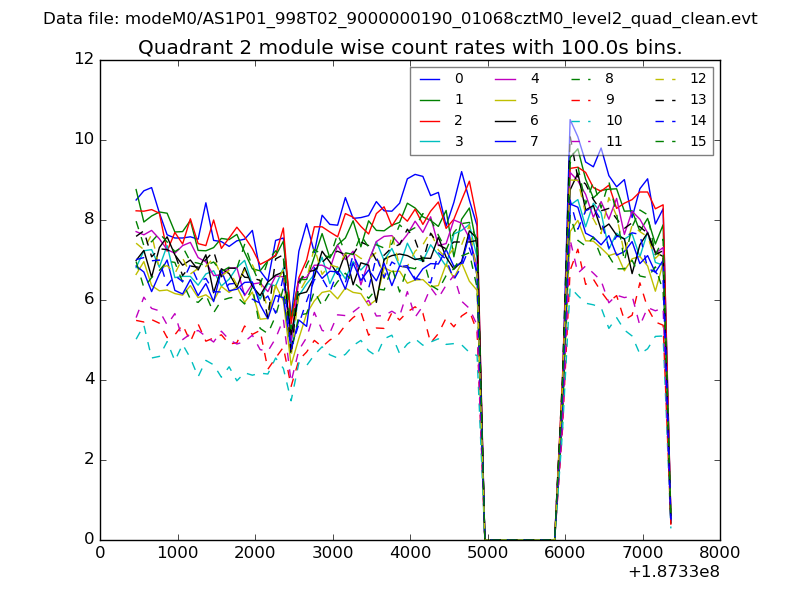
| Module-wise count rates for Quadrant B Data is divided into 100 sec bins |
 |
 |
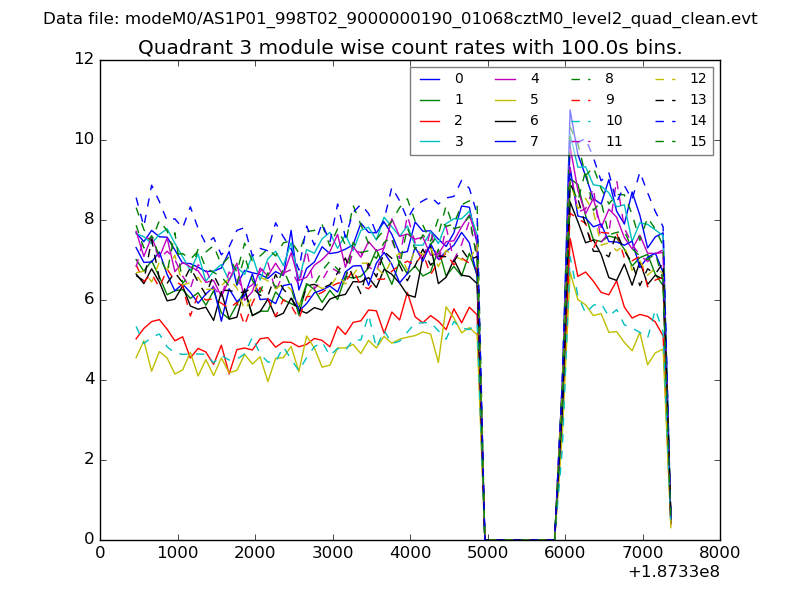
| Module-wise count rates for Quadrant C Data is divided into 100 sec bins |
 |
 |
| Module-wise count rates for Quadrant D Data is divided into 100 sec bins |
 |
 |
| Parameter | Plot |
|---|---|
| CZT HV Monitor | 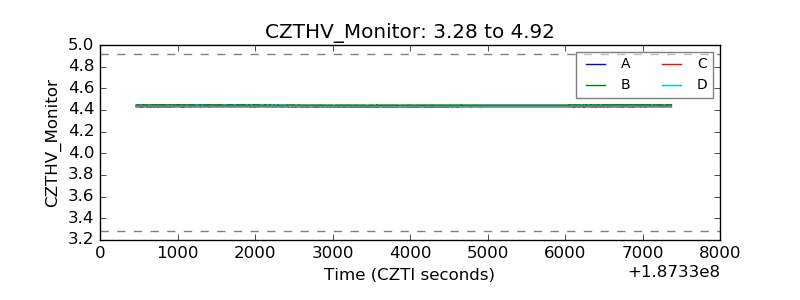 |
| D_VDD | 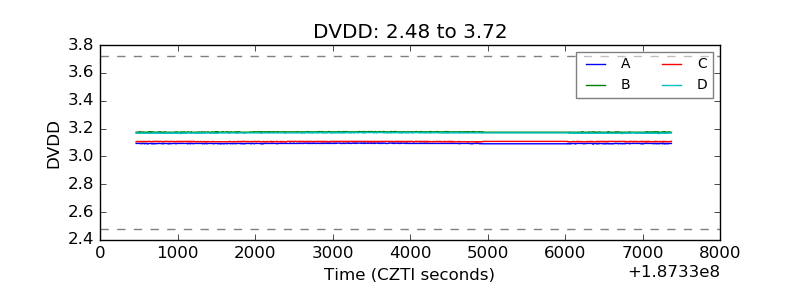 |
| Temperature 1 | 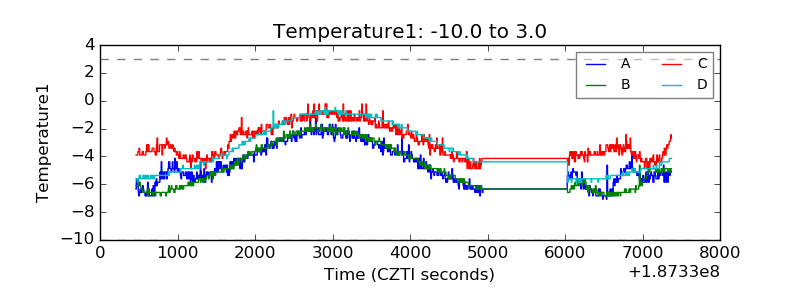 |
| Veto HV Monitor | 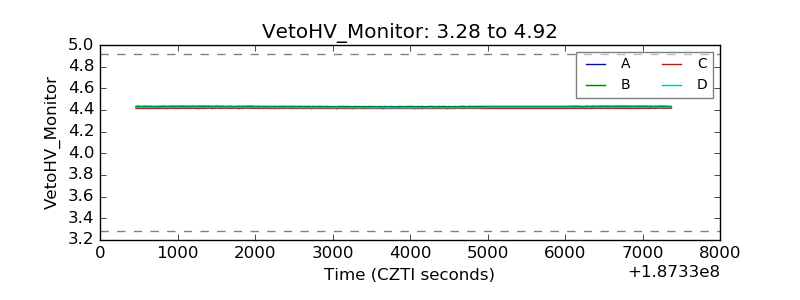 |
| Veto LLD | 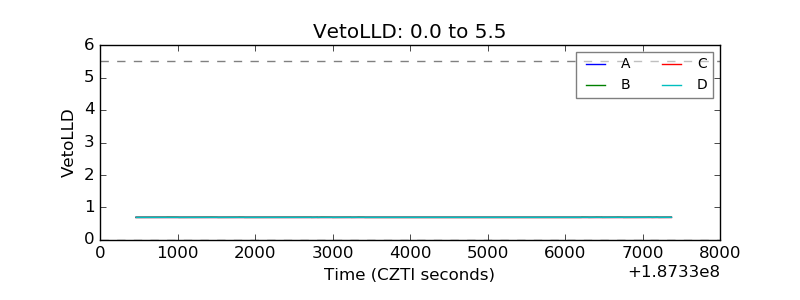 |
| Alpha Counter | 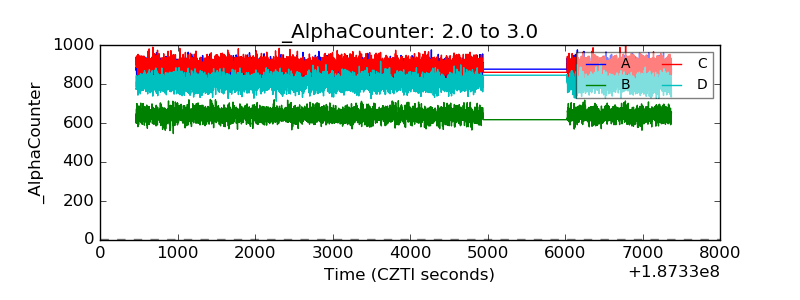 |
| _CPM_Rate | 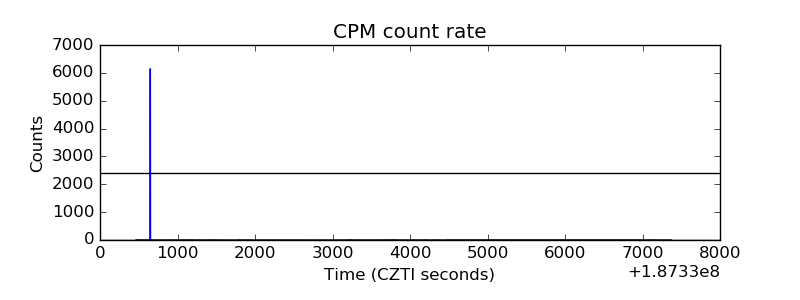 |
| CZT Counter | 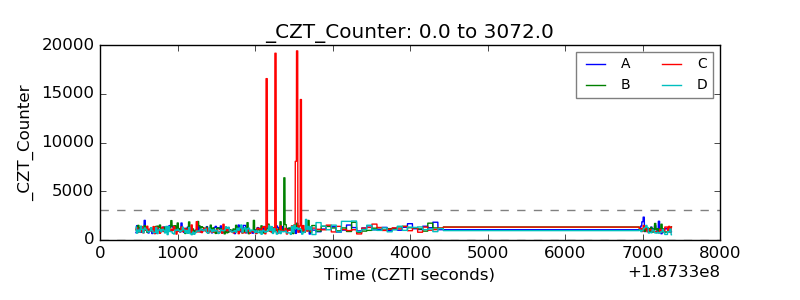 |
| +2.5 Volts monitor |  |
| +5 Volts monitor |  |
| _ROLL_ROT | 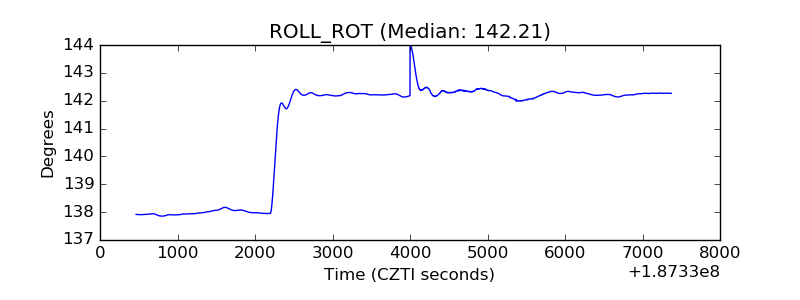 |
| _Roll_DEC | 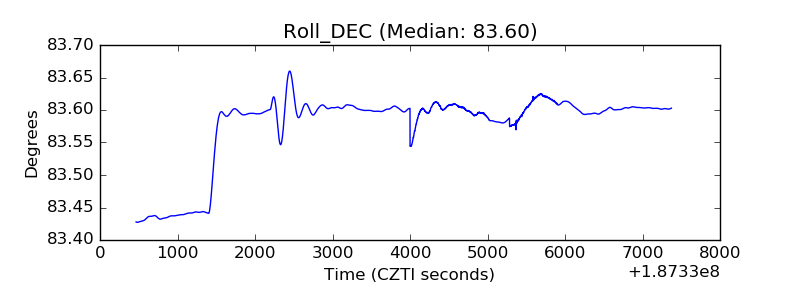 |
| _Roll_RA | 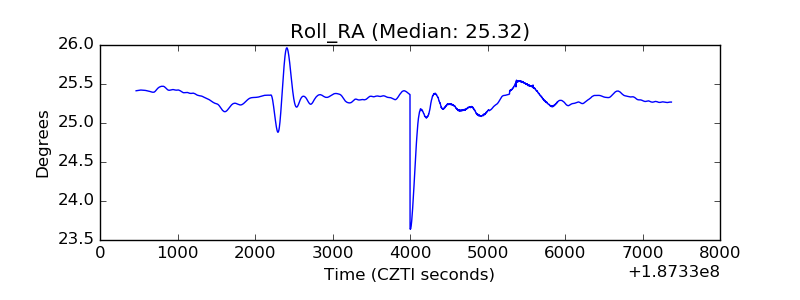 |
| Veto Counter | 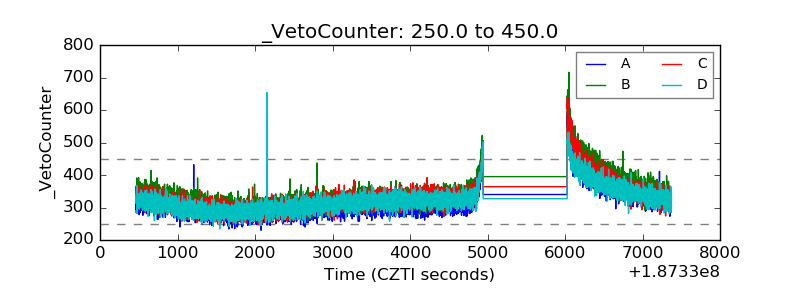 |