| Param | Original file | Final file |
|---|---|---|
| Filename | modeM0/AS1P01_998T02_9000000190_01070cztM0_level2.evt | modeM0/AS1P01_998T02_9000000190_01070cztM0_level2_quad_clean.evt |
| Size (bytes) | 911,632,320 | 102,545,280 |
| Size | 869.4 MB | 97.8 MB |
| Events in quadrant A | 7,006,246 | 691,568 |
| Events in quadrant B | 7,071,206 | 699,578 |
| Events in quadrant C | 6,733,282 | 660,990 |
| Events in quadrant D | 6,418,506 | 653,982 |
| Mode M0 | |||
|---|---|---|---|
| Quadrant | BADHDUFLAG | Total packets | Discarded packets |
| A | 0 | 24898 | 1 |
| B | 0 | 25066 | 1 |
| C | 0 | 24043 | 1 |
| D | 0 | 23101 | 1 |
| Mode SS | |||
|---|---|---|---|
| Quadrant | BADHDUFLAG | Total packets | Discarded packets |
| A | 0 | 116 | 0 |
| B | 0 | 116 | 0 |
| C | 0 | 116 | 0 |
| D | 0 | 116 | 0 |
| Mode M9 | |||
|---|---|---|---|
| Quadrant | BADHDUFLAG | Total packets | Discarded packets |
| A | 0 | 12 | 0 |
| B | 0 | 12 | 0 |
| C | 0 | 12 | 0 |
| D | 0 | 12 | 0 |
| Quadrant | Total seconds | Saturated seconds | Saturation percentage |
|---|---|---|---|
| A | 5716 | 28 | 0.489853% |
| B | 5716 | 40 | 0.699790% |
| C | 5717 | 20 | 0.349834% |
| D | 5717 | 33 | 0.577226% |
Noise dominated data is calculated using 1-second bins in cleaned event files. If a bin has >2000 counts, and if more than 50% of those come from <1% of pixels, then it is considered to be noise-dominated and hence unusable.
| Quadrant | # 1 sec bins | Bins with >0 counts | Bins with >2000 counts | High rate bins dominated by noise | Noise dominated (total time) | Noise dominated (detector-on time) | Marked lightcurve |
|---|---|---|---|---|---|---|---|
| A | 6926 | 5717 | 190 | 190 | 2.74% | 3.32% | 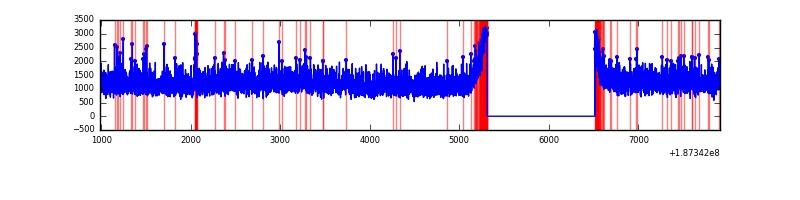 |
| B | 6926 | 5717 | 215 | 215 | 3.10% | 3.76% | 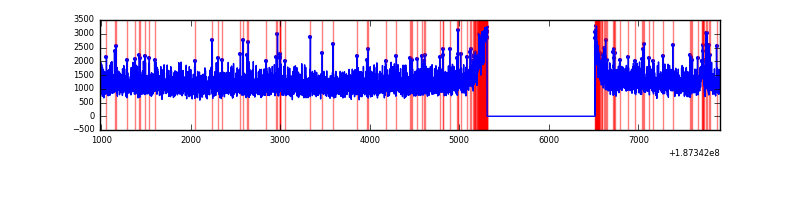 |
| C | 6927 | 5718 | 150 | 150 | 2.17% | 2.62% | 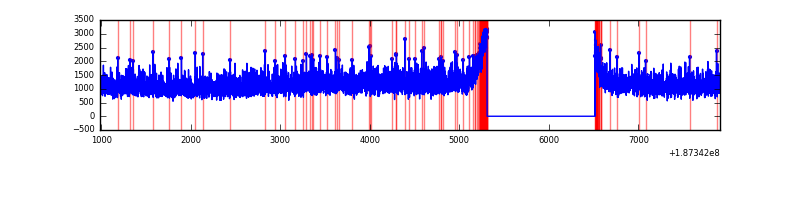 |
| D | 6927 | 5718 | 188 | 188 | 2.71% | 3.29% | 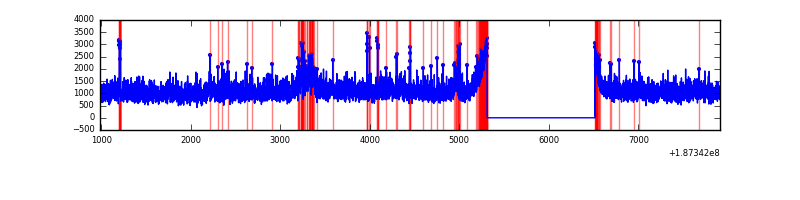 |
Top three noisy pixels from each quadrant. If the there are fewer than three noisy pixels in the level2.evt file, extra rows are filled as -1
| Pixel properties | Quadrant properties | ||||||
|---|---|---|---|---|---|---|---|
| Quadrant | DetID | PixID | Counts | Sigma | Mean | Median | Sigma |
| A | 13 | 164 | 162699 | 380.81 | 1772 | 1780 | 422.6 |
| A | 15 | 233 | 36116 | 81.25 | 1772 | 1780 | 422.6 |
| A | 0 | 253 | 8499 | 15.9 | 1772 | 1780 | 422.6 |
| B | 15 | 22 | 77262 | 176.79 | 1812 | 1821 | 426.7 |
| B | 5 | 191 | 51696 | 116.88 | 1812 | 1821 | 426.7 |
| B | 5 | 249 | 20046 | 42.71 | 1812 | 1821 | 426.7 |
| C | 15 | 241 | 287739 | 631.22 | 1636 | 1690 | 453.2 |
| C | 3 | 79 | 26607 | 54.98 | 1636 | 1690 | 453.2 |
| C | 3 | 111 | 23256 | 47.59 | 1636 | 1690 | 453.2 |
| D | 13 | 73 | 167894 | 334.37 | 1621 | 1678 | 497.1 |
| D | 2 | 216 | 47525 | 92.23 | 1621 | 1678 | 497.1 |
| D | 10 | 85 | 44158 | 85.46 | 1621 | 1678 | 497.1 |
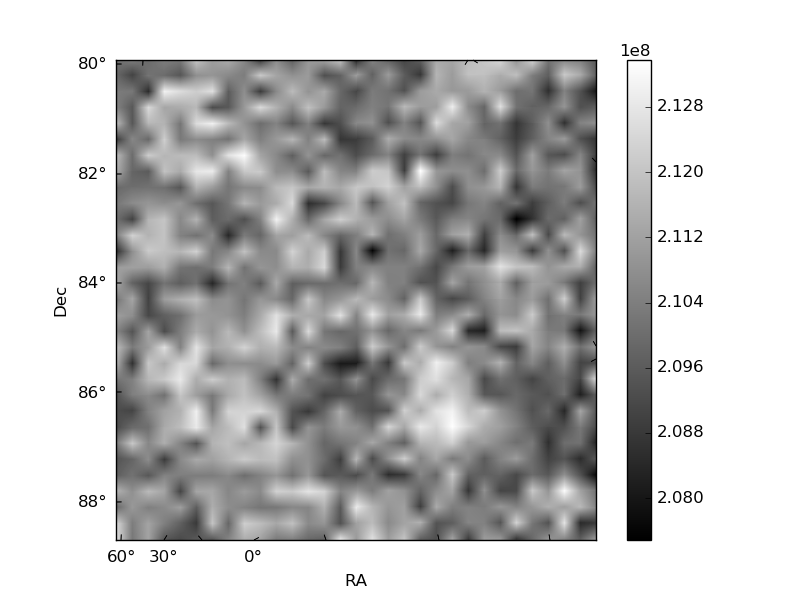
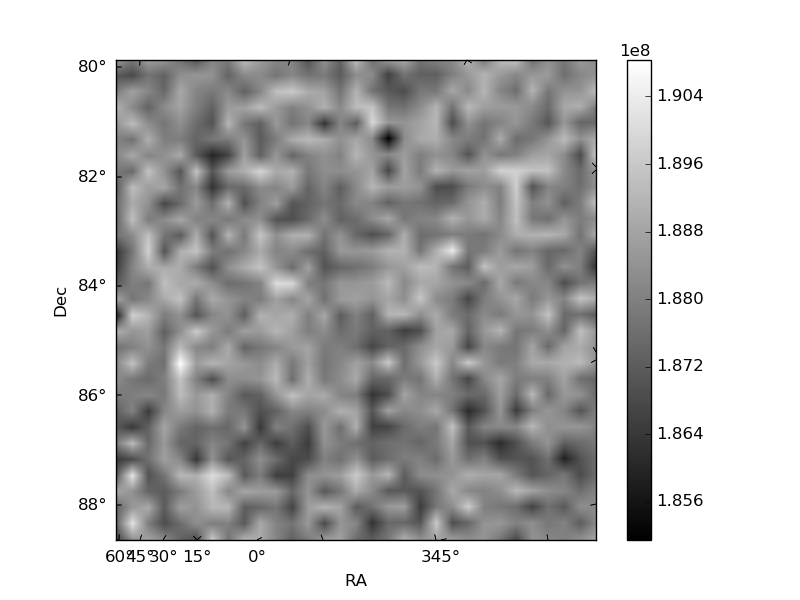
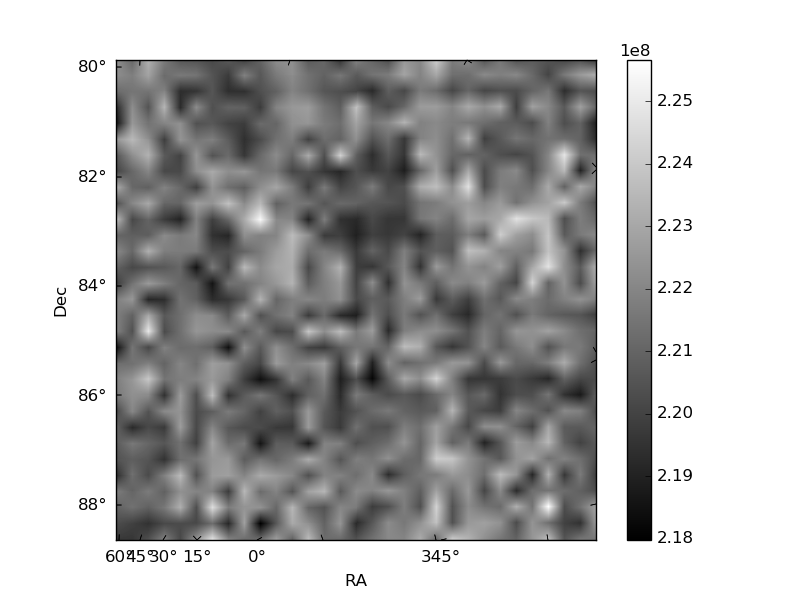
Histogram calculated using DETX and DETY for each event in the final _common_clean file
| Quadrant A | 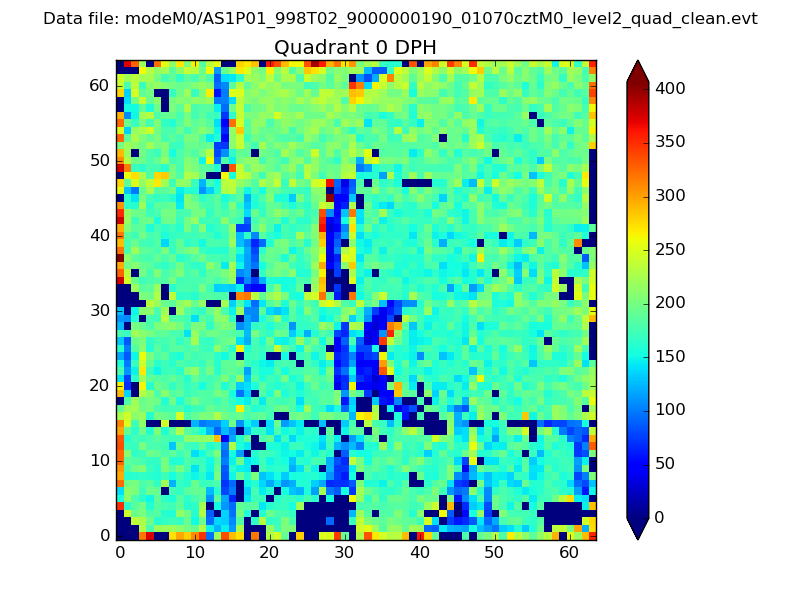 |
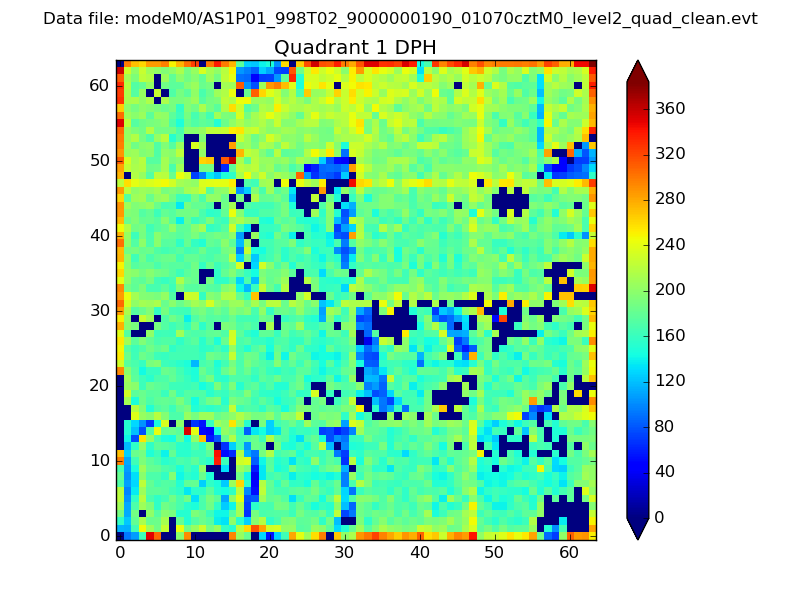 |
Quadrant B |
|---|---|---|---|
| Quadrant D | 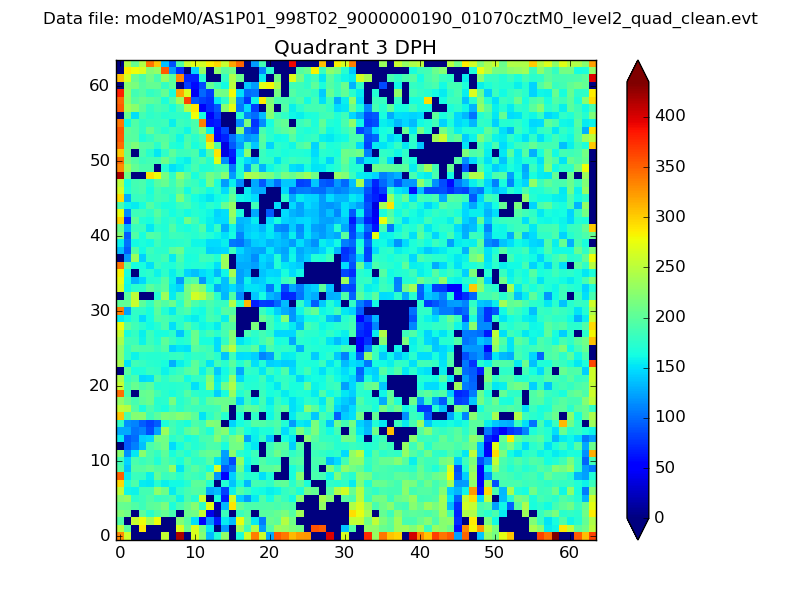 |
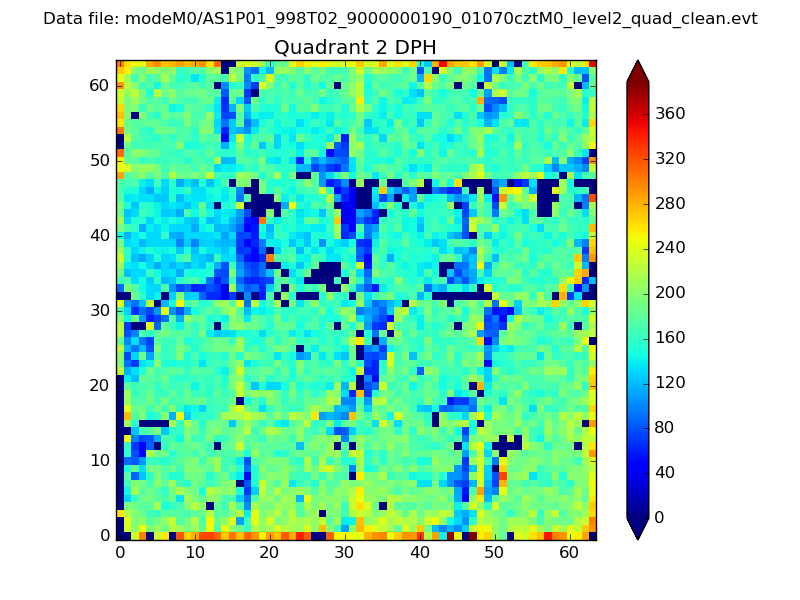 |
Quadrant C |
| Plot type | Count rate plots | Images |
|---|---|---|
| Comparison with Poisson distribution Blue bars denote a histogram of data divided into 1 sec bins. Red curve is a Poisson curve with rate = median count rate of data. |
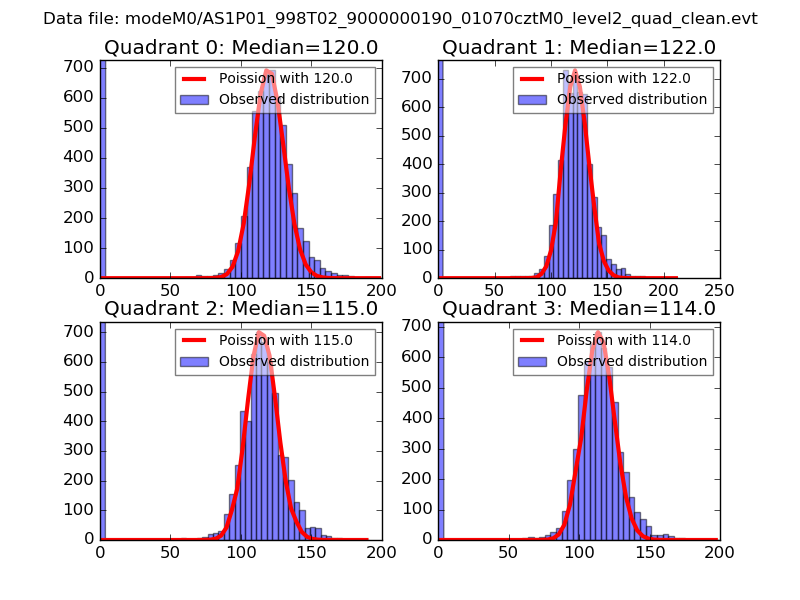 |
 |
| Quadrant-wise count rates Data is divided into 100 sec bins |
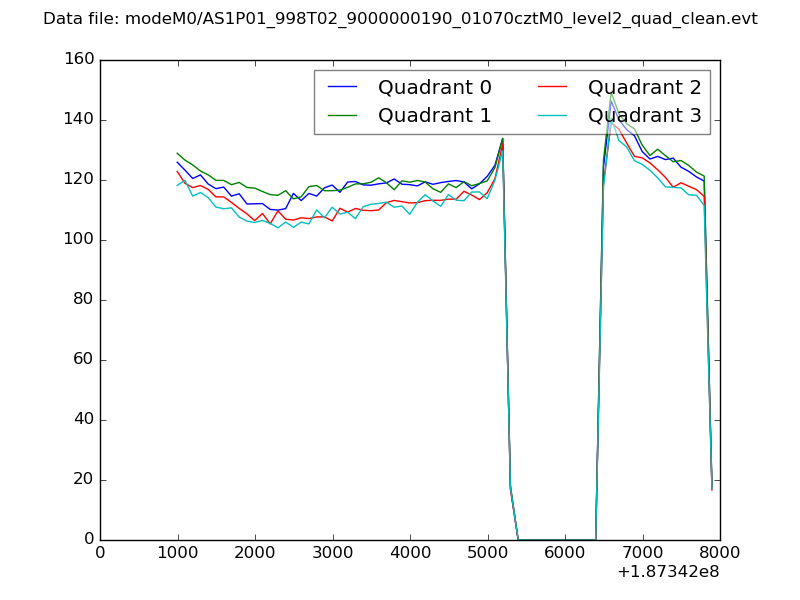 |
|
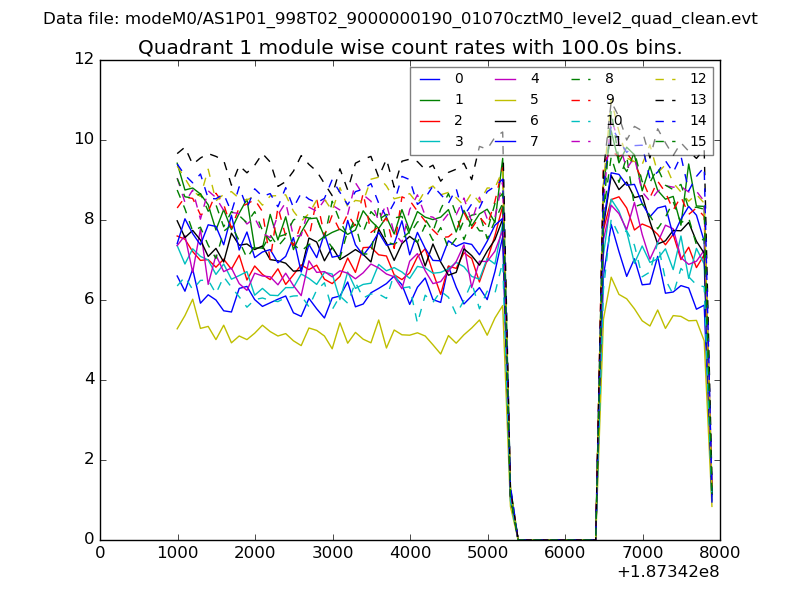
| Module-wise count rates for Quadrant A Data is divided into 100 sec bins |
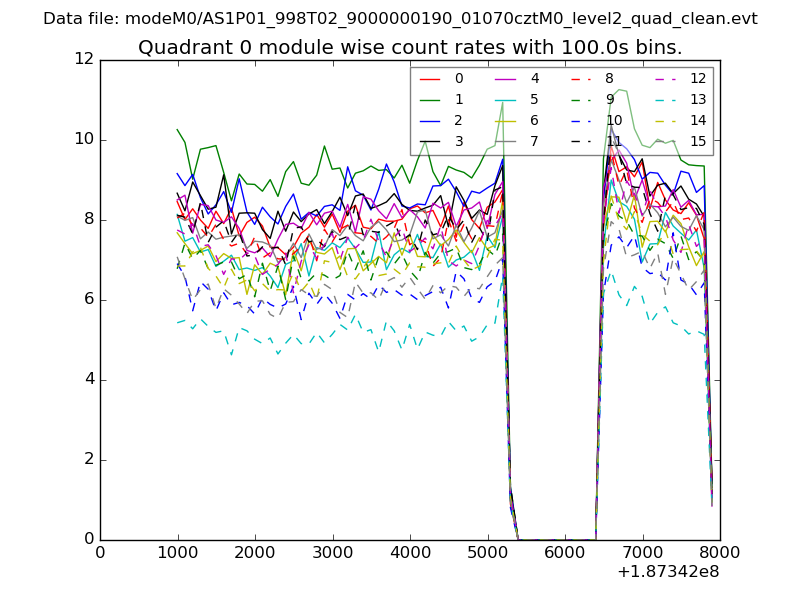 |
 |
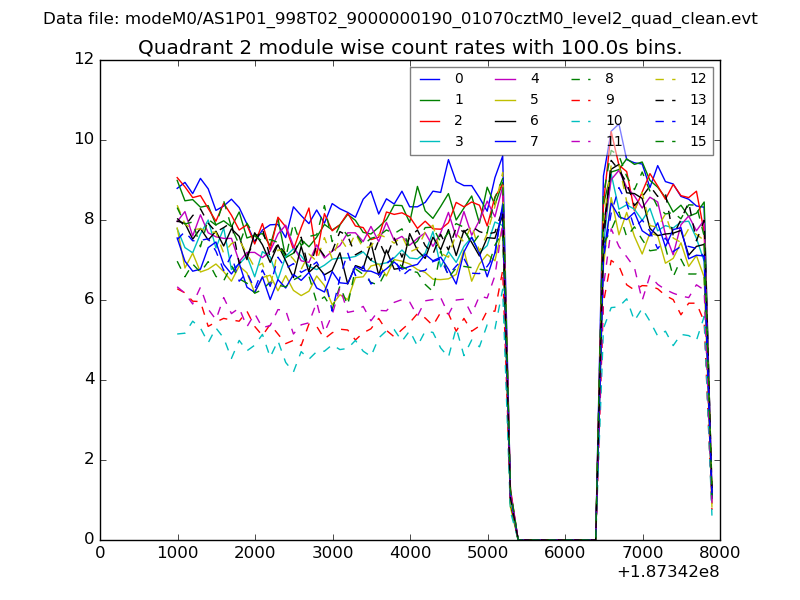
| Module-wise count rates for Quadrant B Data is divided into 100 sec bins |
 |
 |
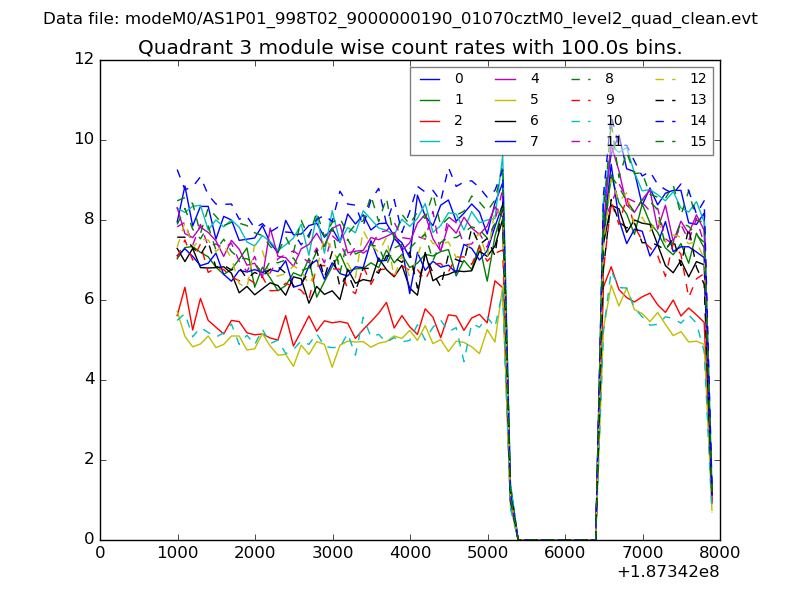
| Module-wise count rates for Quadrant C Data is divided into 100 sec bins |
 |
 |
| Module-wise count rates for Quadrant D Data is divided into 100 sec bins |
 |
 |
| Parameter | Plot |
|---|---|
| CZT HV Monitor | 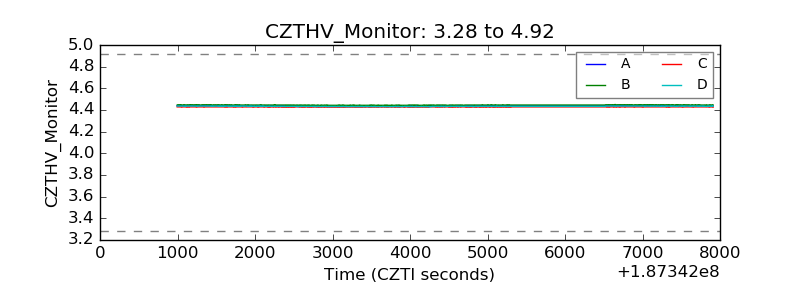 |
| D_VDD | 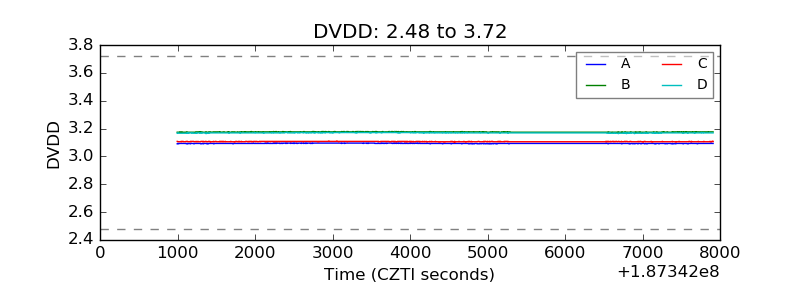 |
| Temperature 1 | 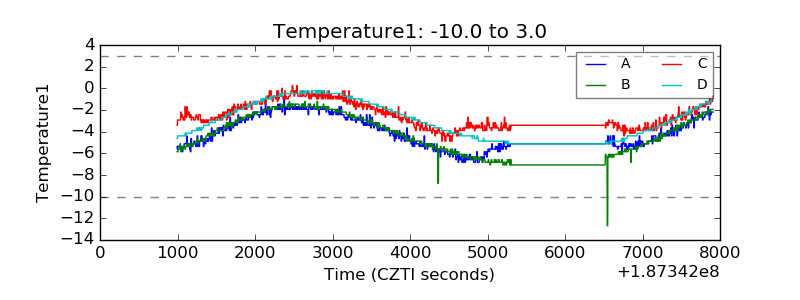 |
| Veto HV Monitor | 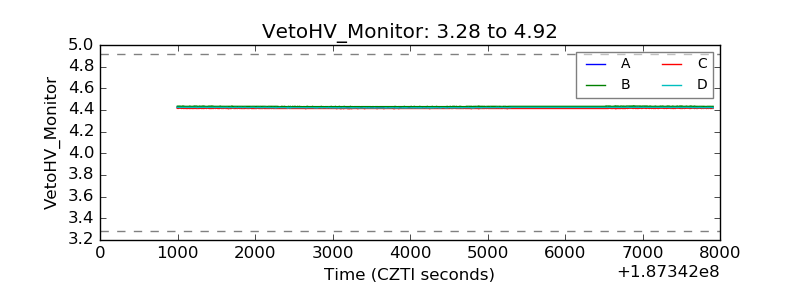 |
| Veto LLD | 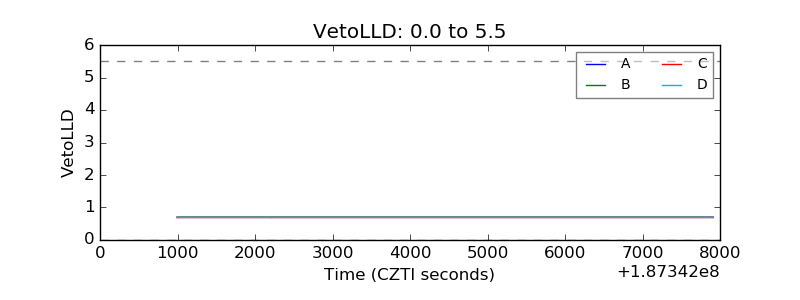 |
| Alpha Counter | 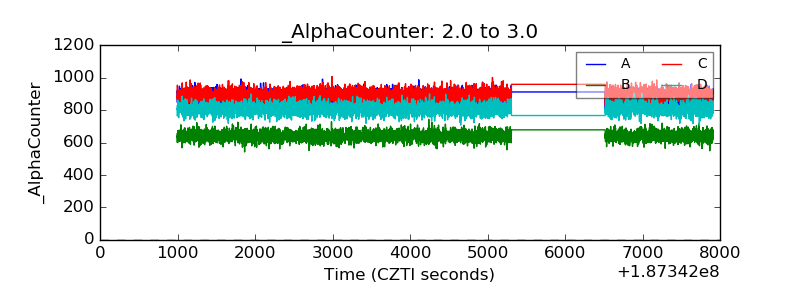 |
| _CPM_Rate | 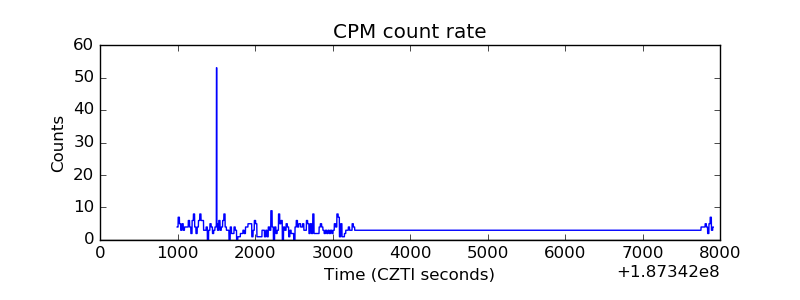 |
| CZT Counter | 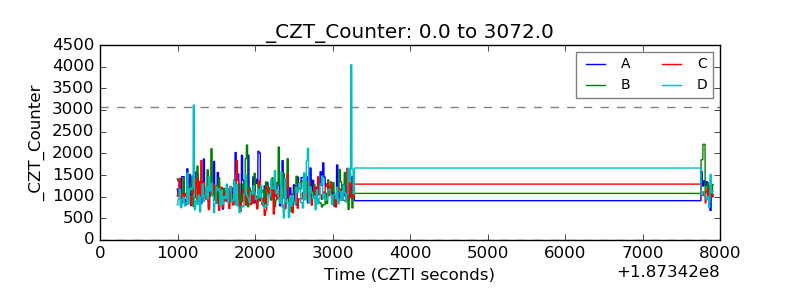 |
| +2.5 Volts monitor |  |
| +5 Volts monitor |  |
| _ROLL_ROT | 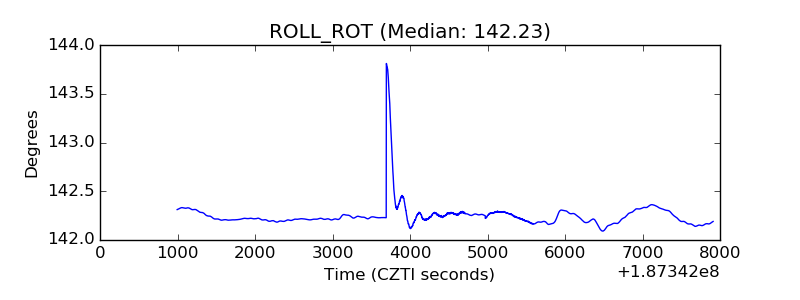 |
| _Roll_DEC | 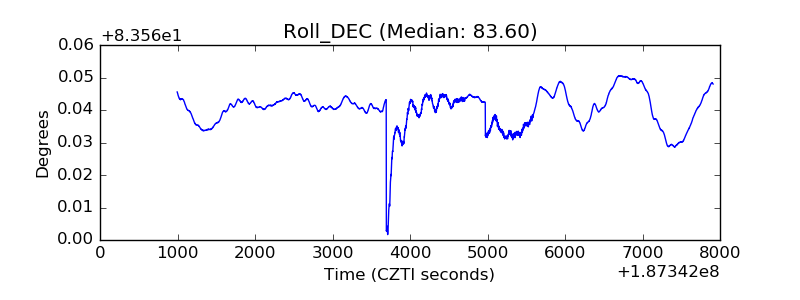 |
| _Roll_RA | 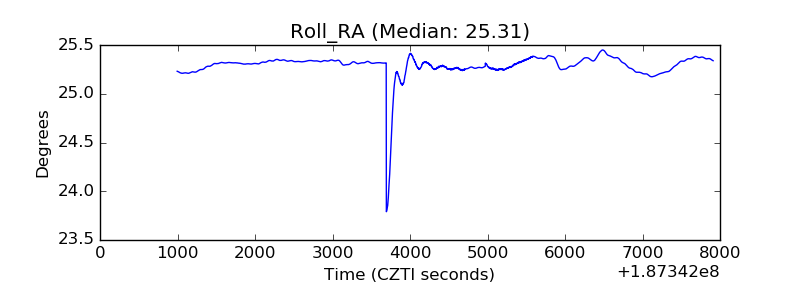 |
| Veto Counter | 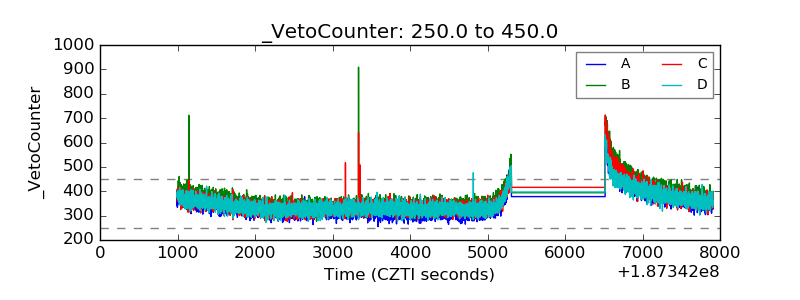 |