| Param | Original file | Final file |
|---|---|---|
| Filename | modeM0/AS1P01_998T02_9000000190_01071cztM0_level2.evt | modeM0/AS1P01_998T02_9000000190_01071cztM0_level2_quad_clean.evt |
| Size (bytes) | 57,188,160 | 7,099,200 |
| Size | 54.5 MB | 6.8 MB |
| Events in quadrant A | 460,065 | 46,030 |
| Events in quadrant B | 454,426 | 46,397 |
| Events in quadrant C | 410,783 | 44,100 |
| Events in quadrant D | 378,132 | 43,502 |
| Mode M0 | |||
|---|---|---|---|
| Quadrant | BADHDUFLAG | Total packets | Discarded packets |
| A | 0 | 1633 | 0 |
| B | 0 | 1616 | 0 |
| C | 0 | 1487 | 0 |
| D | 0 | 1388 | 0 |
| Mode SS | |||
|---|---|---|---|
| Quadrant | BADHDUFLAG | Total packets | Discarded packets |
| A | 0 | 8 | 0 |
| B | 0 | 8 | 0 |
| C | 0 | 8 | 0 |
| D | 0 | 8 | 0 |
| Quadrant | Total seconds | Saturated seconds | Saturation percentage |
|---|---|---|---|
| A | 373 | 0 | 0.000000% |
| B | 373 | 0 | 0.000000% |
| C | 373 | 0 | 0.000000% |
| D | 373 | 0 | 0.000000% |
Noise dominated data is calculated using 1-second bins in cleaned event files. If a bin has >2000 counts, and if more than 50% of those come from <1% of pixels, then it is considered to be noise-dominated and hence unusable.
| Quadrant | # 1 sec bins | Bins with >0 counts | Bins with >2000 counts | High rate bins dominated by noise | Noise dominated (total time) | Noise dominated (detector-on time) | Marked lightcurve |
|---|---|---|---|---|---|---|---|
| A | 373 | 373 | 6 | 6 | 1.61% | 1.61% | 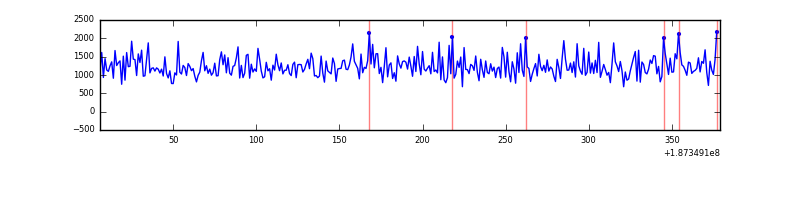 |
| B | 373 | 373 | 4 | 4 | 1.07% | 1.07% | 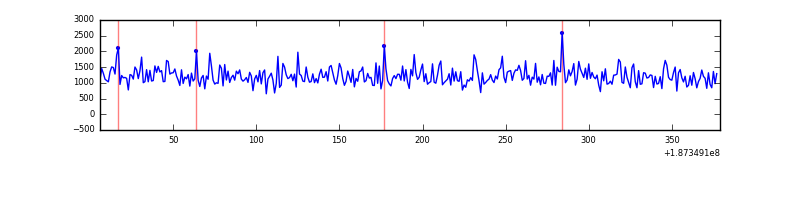 |
| C | 373 | 373 | 0 | 0 | 0.00% | 0.00% | 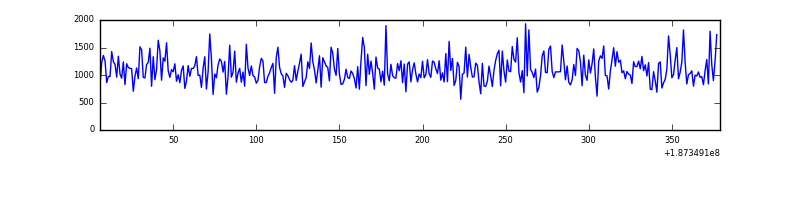 |
| D | 373 | 373 | 0 | 0 | 0.00% | 0.00% | 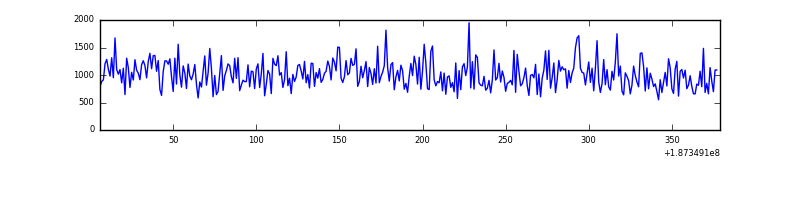 |
Top three noisy pixels from each quadrant. If the there are fewer than three noisy pixels in the level2.evt file, extra rows are filled as -1
| Pixel properties | Quadrant properties | ||||||
|---|---|---|---|---|---|---|---|
| Quadrant | DetID | PixID | Counts | Sigma | Mean | Median | Sigma |
| A | 0 | 253 | 436 | 10.31 | 119 | 120 | 30.7 |
| A | 3 | 111 | 407 | 9.36 | 119 | 120 | 30.7 |
| A | 14 | 203 | 311 | 6.23 | 119 | 120 | 30.7 |
| B | 12 | 52 | 1339 | 40.5 | 118 | 119 | 30.1 |
| B | 8 | 219 | 1174 | 35.02 | 118 | 119 | 30.1 |
| B | 8 | 234 | 782 | 22.01 | 118 | 119 | 30.1 |
| C | 15 | 241 | 18276 | 623.96 | 99 | 103 | 29.1 |
| C | 3 | 111 | 943 | 28.84 | 99 | 103 | 29.1 |
| C | 3 | 79 | 344 | 8.27 | 99 | 103 | 29.1 |
| D | 2 | 216 | 1448 | 40.4 | 100 | 100 | 33.4 |
| D | 13 | 138 | 429 | 9.86 | 100 | 100 | 33.4 |
| D | -1 | -1 | -1 | -1.0 | 100 | 100 | 33.4 |
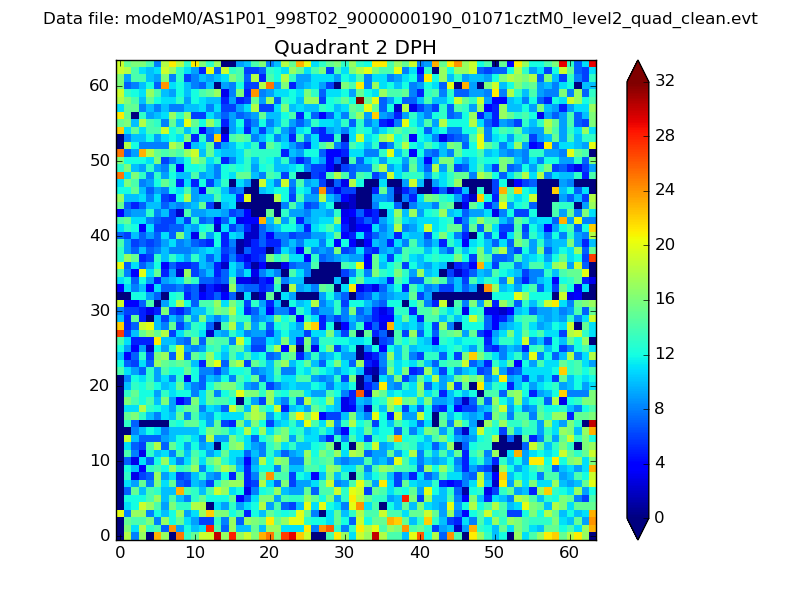
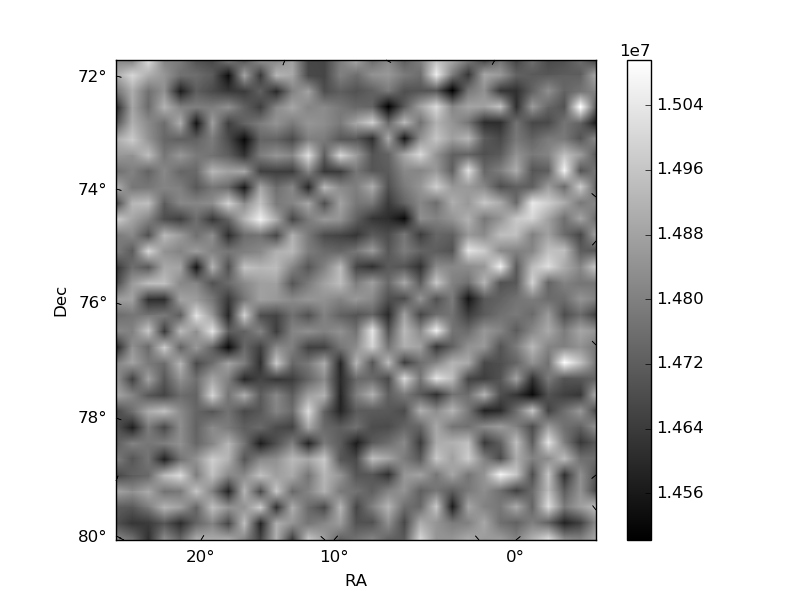
Histogram calculated using DETX and DETY for each event in the final _common_clean file
| Quadrant A | 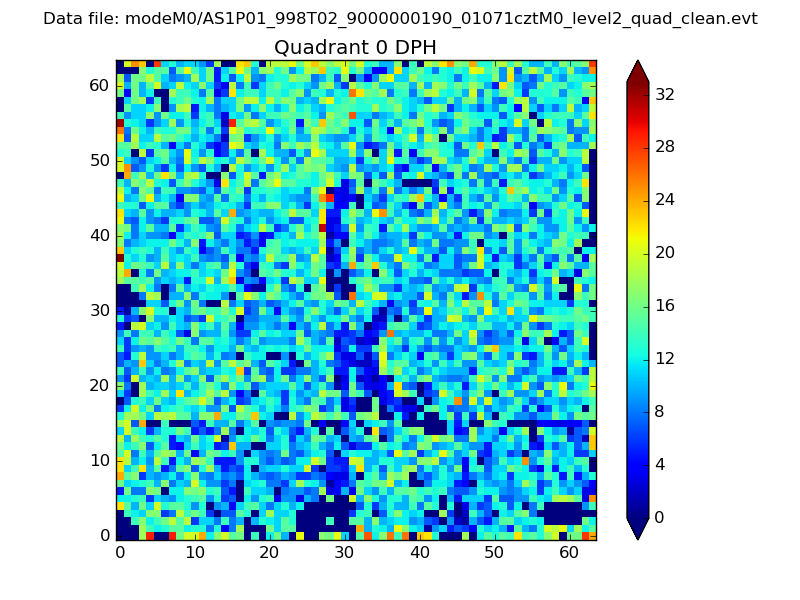 |
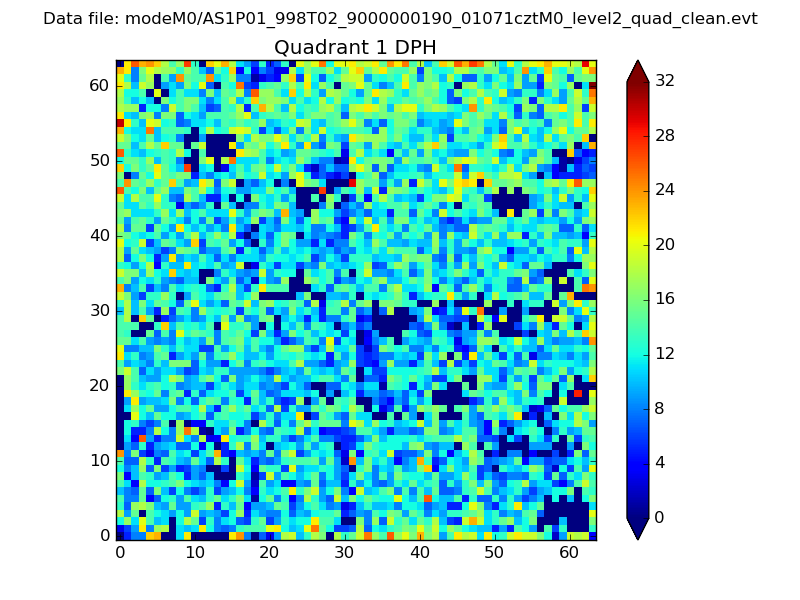 |
Quadrant B |
|---|---|---|---|
| Quadrant D | 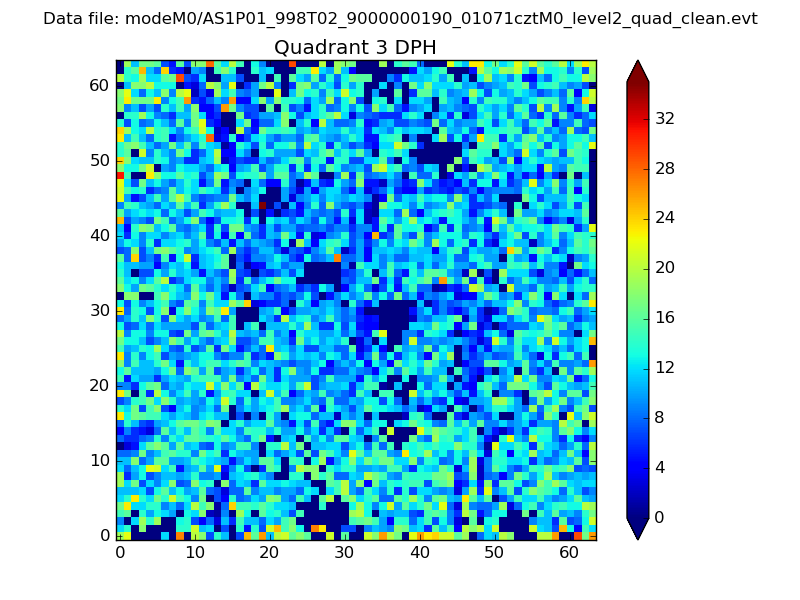 |
 |
Quadrant C |
| Plot type | Count rate plots | Images |
|---|---|---|
| Comparison with Poisson distribution Blue bars denote a histogram of data divided into 1 sec bins. Red curve is a Poisson curve with rate = median count rate of data. |
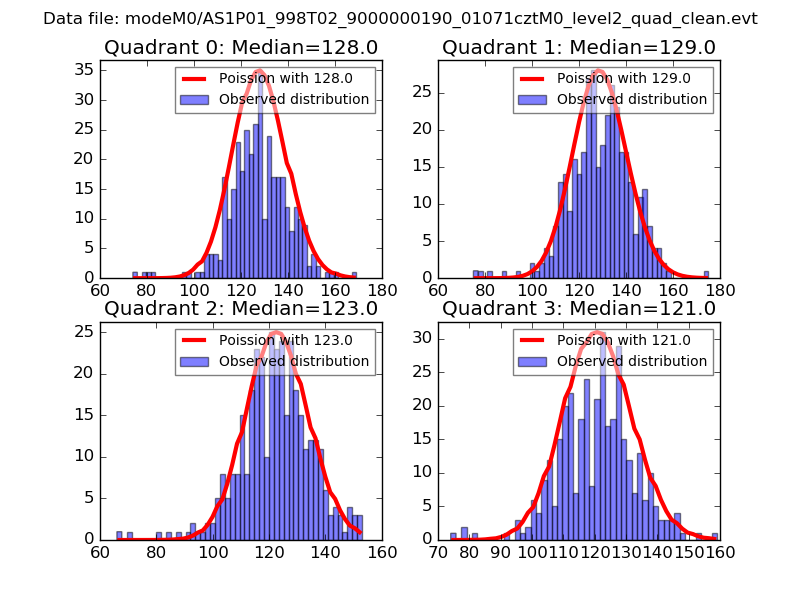 |
 |
| Quadrant-wise count rates Data is divided into 100 sec bins |
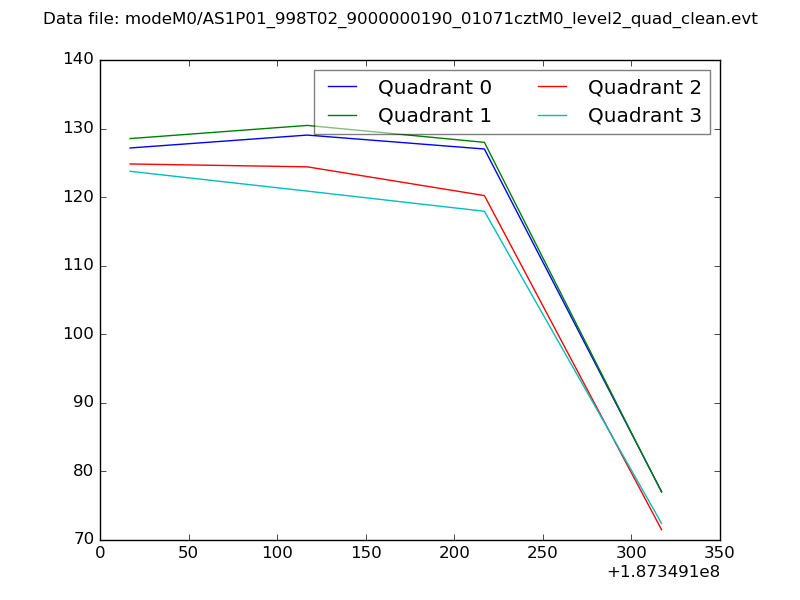 |
|
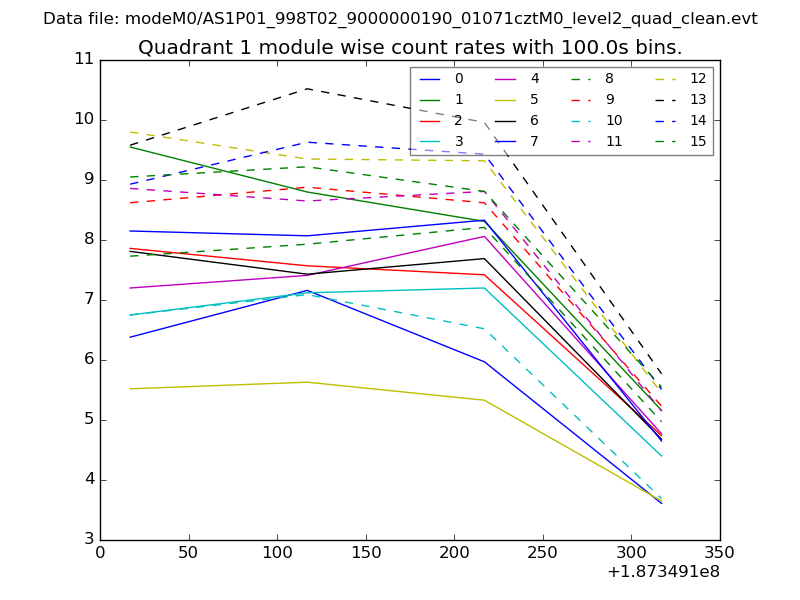
| Module-wise count rates for Quadrant A Data is divided into 100 sec bins |
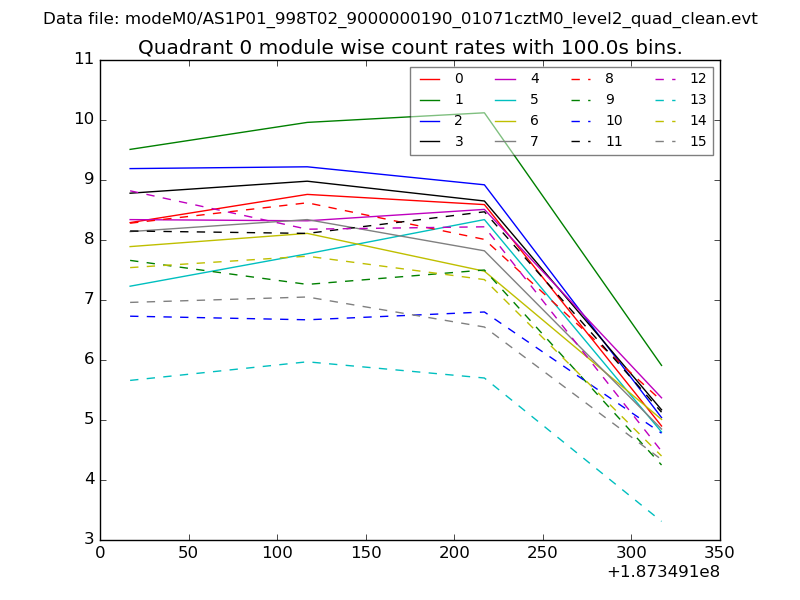 |
 |
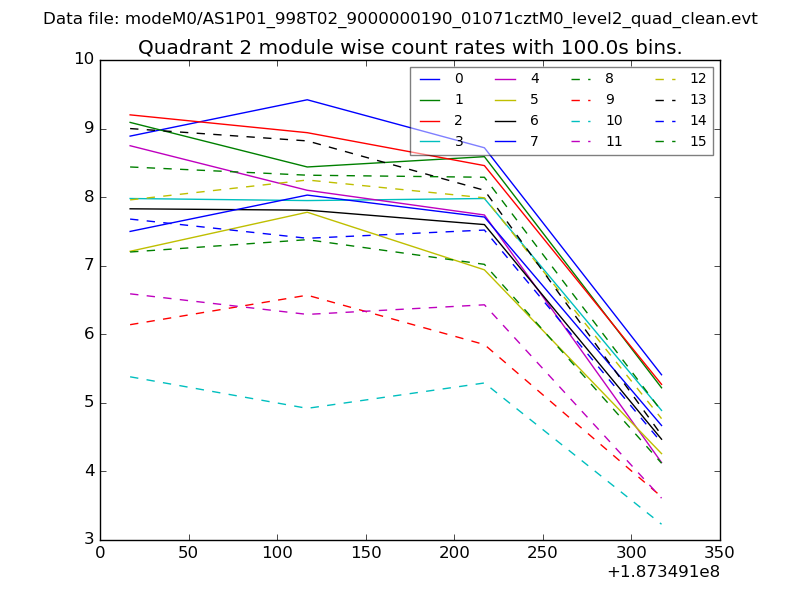
| Module-wise count rates for Quadrant B Data is divided into 100 sec bins |
 |
 |
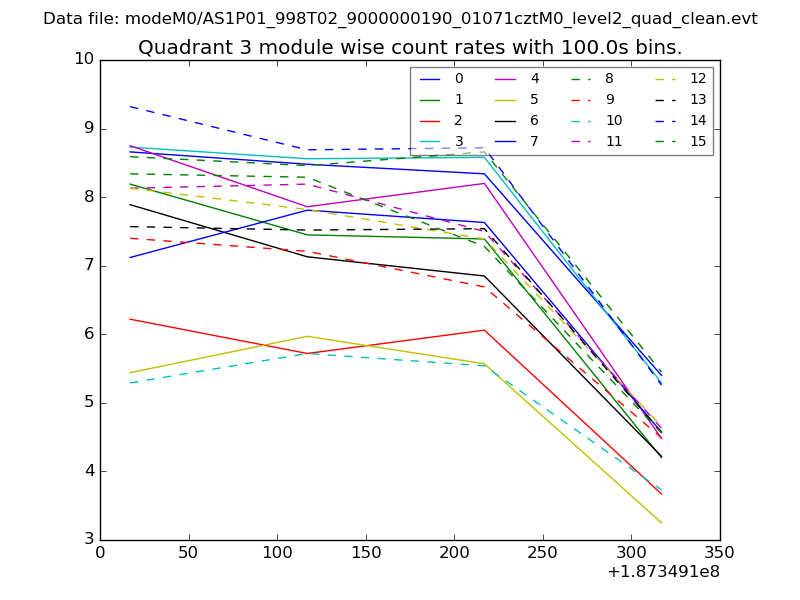
| Module-wise count rates for Quadrant C Data is divided into 100 sec bins |
 |
 |
| Module-wise count rates for Quadrant D Data is divided into 100 sec bins |
 |
 |
| Parameter | Plot |
|---|---|
| CZT HV Monitor | 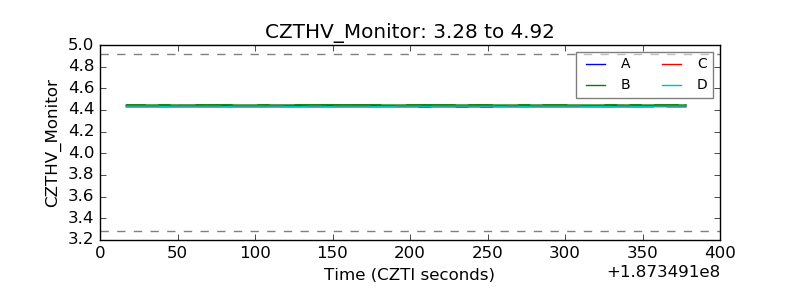 |
| D_VDD |  |
| Temperature 1 | 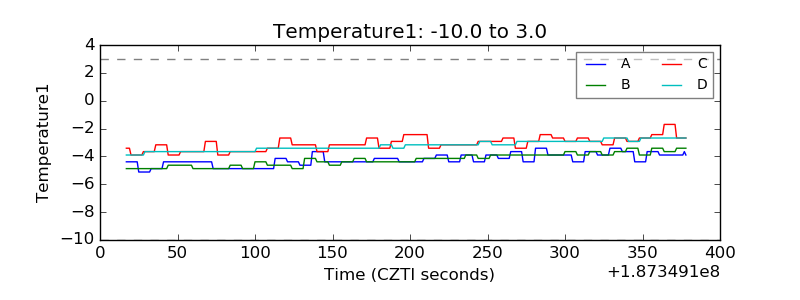 |
| Veto HV Monitor | 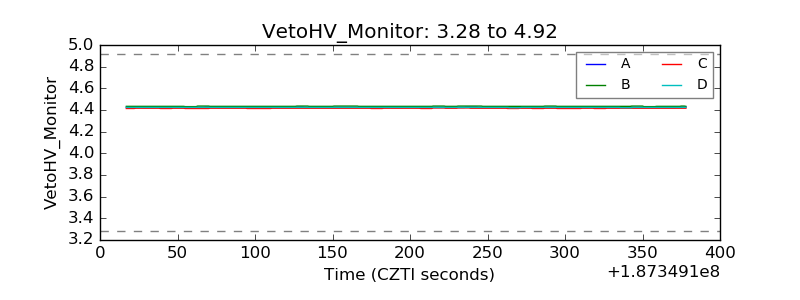 |
| Veto LLD | 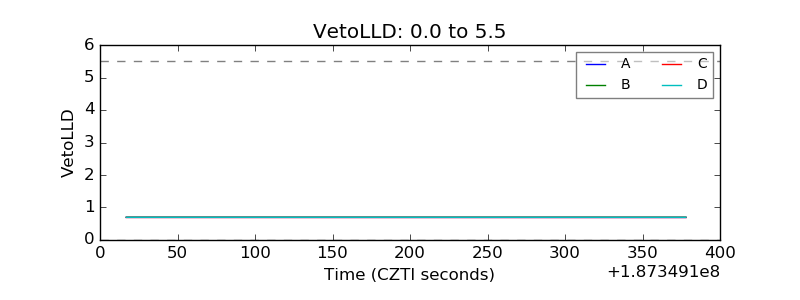 |
| Alpha Counter | 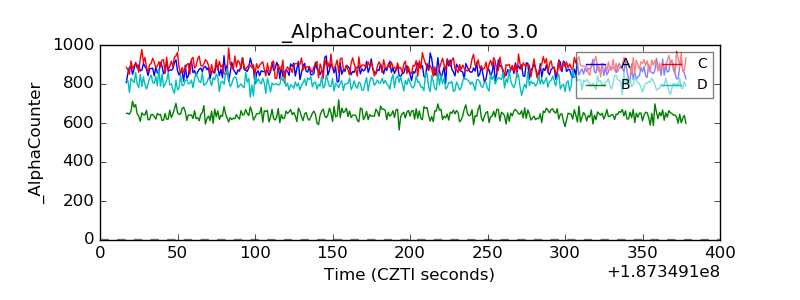 |
| _CPM_Rate | 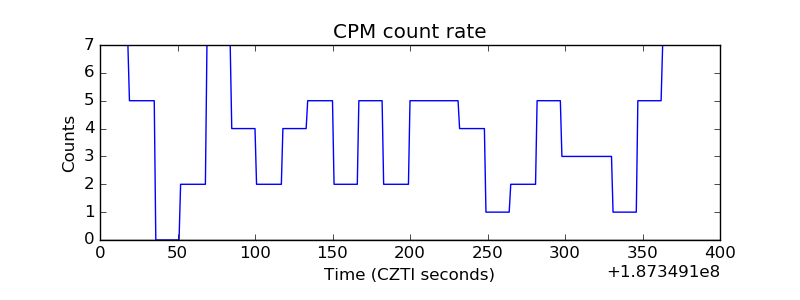 |
| CZT Counter | 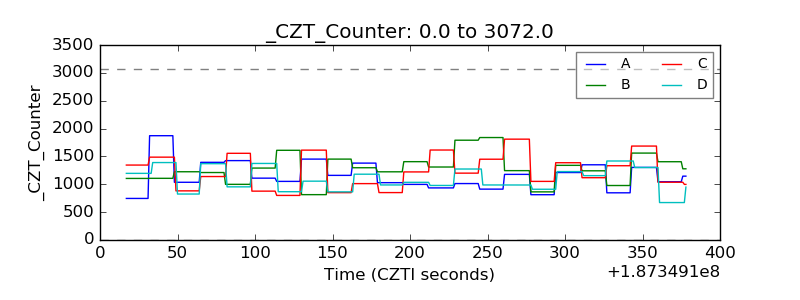 |
| +2.5 Volts monitor |  |
| +5 Volts monitor |  |
| _ROLL_ROT | 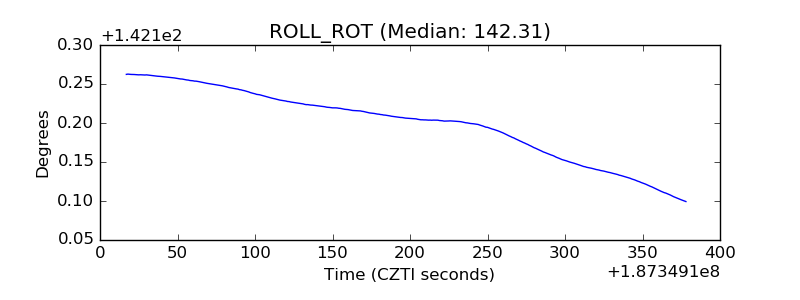 |
| _Roll_DEC | 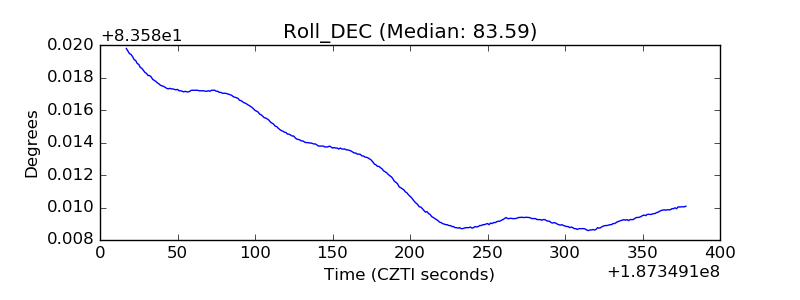 |
| _Roll_RA |  |
| Veto Counter | 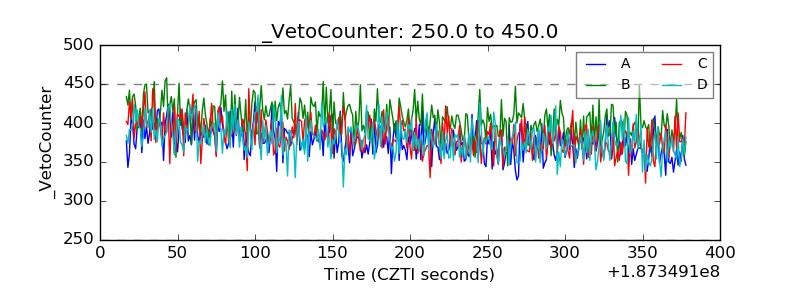 |