| Param | Original file | Final file |
|---|---|---|
| Filename | modeM0/AS1P01_998T02_9000000190_01072cztM0_level2.evt | modeM0/AS1P01_998T02_9000000190_01072cztM0_level2_quad_clean.evt |
| Size (bytes) | 1,845,276,480 | 197,354,880 |
| Size | 1.7 GB | 188.2 MB |
| Events in quadrant A | 13,433,703 | 1,337,708 |
| Events in quadrant B | 14,299,864 | 1,339,347 |
| Events in quadrant C | 13,806,310 | 1,278,929 |
| Events in quadrant D | 13,601,706 | 1,243,472 |
| Mode M0 | |||
|---|---|---|---|
| Quadrant | BADHDUFLAG | Total packets | Discarded packets |
| A | 0 | 47902 | 2 |
| B | 0 | 50480 | 2 |
| C | 0 | 49014 | 2 |
| D | 0 | 48491 | 4 |
| Mode SS | |||
|---|---|---|---|
| Quadrant | BADHDUFLAG | Total packets | Discarded packets |
| A | 0 | 228 | 0 |
| B | 0 | 228 | 0 |
| C | 0 | 228 | 0 |
| D | 0 | 228 | 0 |
| Mode M9 | |||
|---|---|---|---|
| Quadrant | BADHDUFLAG | Total packets | Discarded packets |
| A | 0 | 23 | 0 |
| B | 0 | 23 | 0 |
| C | 0 | 23 | 0 |
| D | 0 | 23 | 0 |
| Quadrant | Total seconds | Saturated seconds | Saturation percentage |
|---|---|---|---|
| A | 11248 | 139 | 1.235775% |
| B | 11248 | 170 | 1.511380% |
| C | 11248 | 147 | 1.306899% |
| D | 11247 | 521 | 4.632346% |
Noise dominated data is calculated using 1-second bins in cleaned event files. If a bin has >2000 counts, and if more than 50% of those come from <1% of pixels, then it is considered to be noise-dominated and hence unusable.
| Quadrant | # 1 sec bins | Bins with >0 counts | Bins with >2000 counts | High rate bins dominated by noise | Noise dominated (total time) | Noise dominated (detector-on time) | Marked lightcurve |
|---|---|---|---|---|---|---|---|
| A | 13533 | 11250 | 463 | 463 | 3.42% | 4.12% | 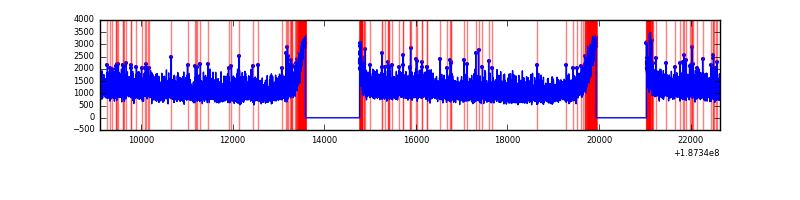 |
| B | 13533 | 11250 | 668 | 668 | 4.94% | 5.94% | 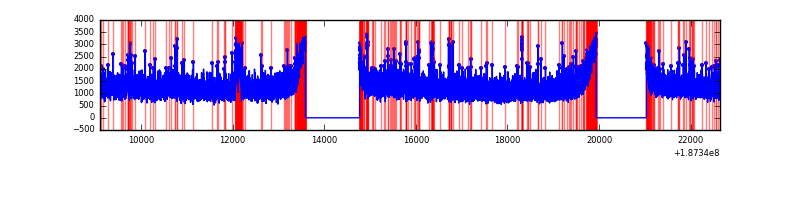 |
| C | 13533 | 11250 | 461 | 461 | 3.41% | 4.10% | 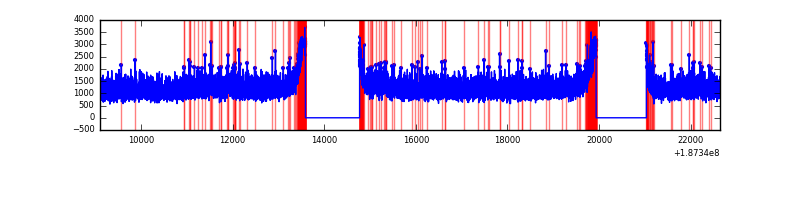 |
| D | 13532 | 11249 | 844 | 844 | 6.24% | 7.50% | 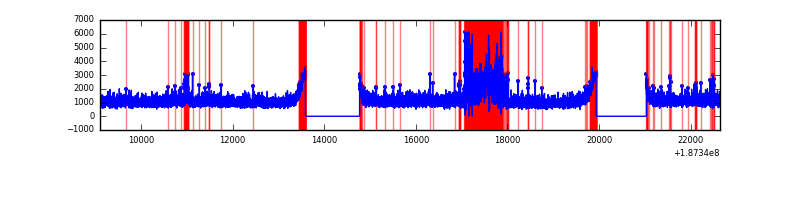 |
Top three noisy pixels from each quadrant. If the there are fewer than three noisy pixels in the level2.evt file, extra rows are filled as -1
| Pixel properties | Quadrant properties | ||||||
|---|---|---|---|---|---|---|---|
| Quadrant | DetID | PixID | Counts | Sigma | Mean | Median | Sigma |
| A | 15 | 233 | 76763 | 88.19 | 3479 | 3491 | 830.9 |
| A | 0 | 253 | 13929 | 12.56 | 3479 | 3491 | 830.9 |
| A | 11 | 79 | 13548 | 12.1 | 3479 | 3491 | 830.9 |
| B | 5 | 191 | 341963 | 398.22 | 3593 | 3603 | 849.7 |
| B | 15 | 22 | 176060 | 202.96 | 3593 | 3603 | 849.7 |
| B | 5 | 249 | 54550 | 59.96 | 3593 | 3603 | 849.7 |
| C | 15 | 241 | 579068 | 635.85 | 3261 | 3367 | 905.4 |
| C | 9 | 52 | 364577 | 398.95 | 3261 | 3367 | 905.4 |
| C | 3 | 79 | 69616 | 73.17 | 3261 | 3367 | 905.4 |
| D | 13 | 73 | 66811 | 60.42 | 3341 | 3346 | 1050.4 |
| D | 10 | 102 | 65033 | 58.73 | 3341 | 3346 | 1050.4 |
| D | 2 | 216 | 63318 | 57.09 | 3341 | 3346 | 1050.4 |
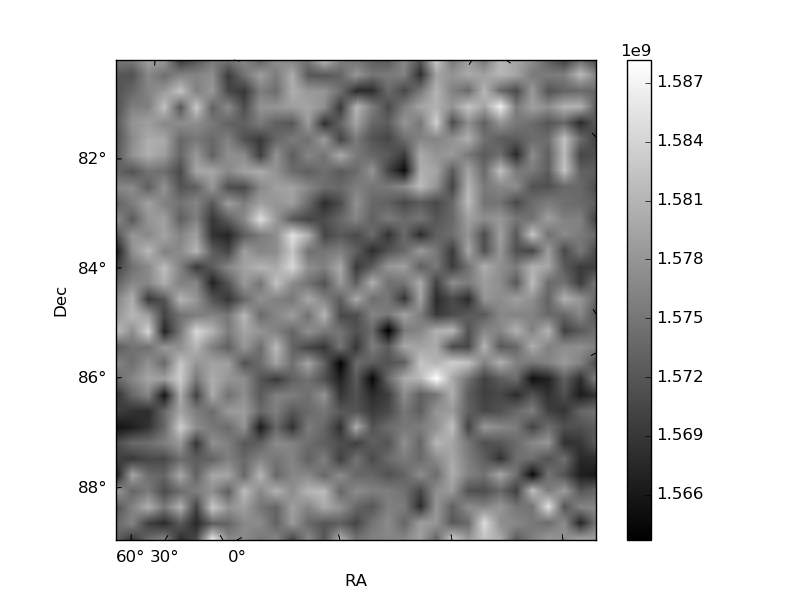
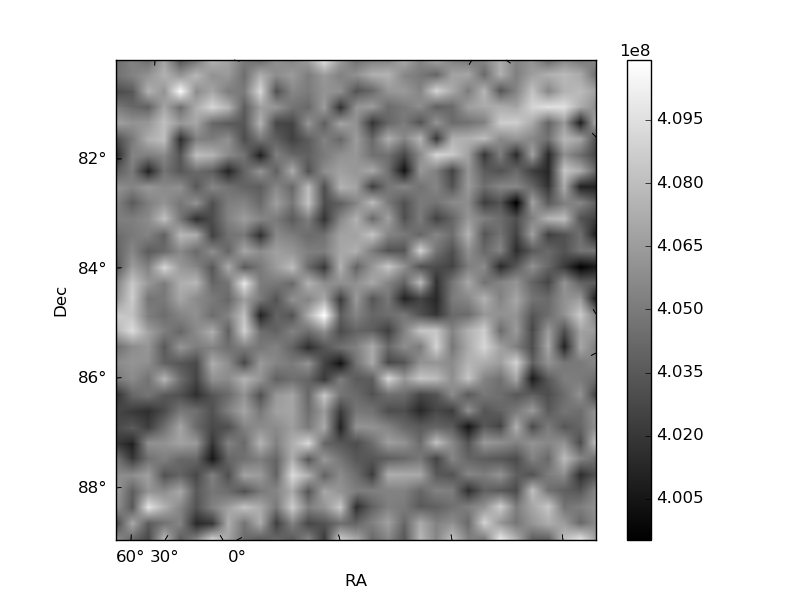
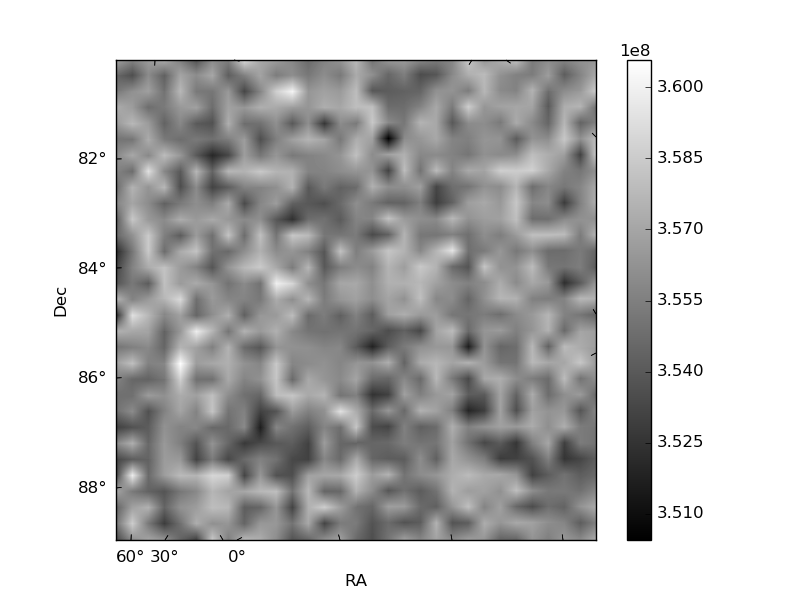
Histogram calculated using DETX and DETY for each event in the final _common_clean file
| Quadrant A | 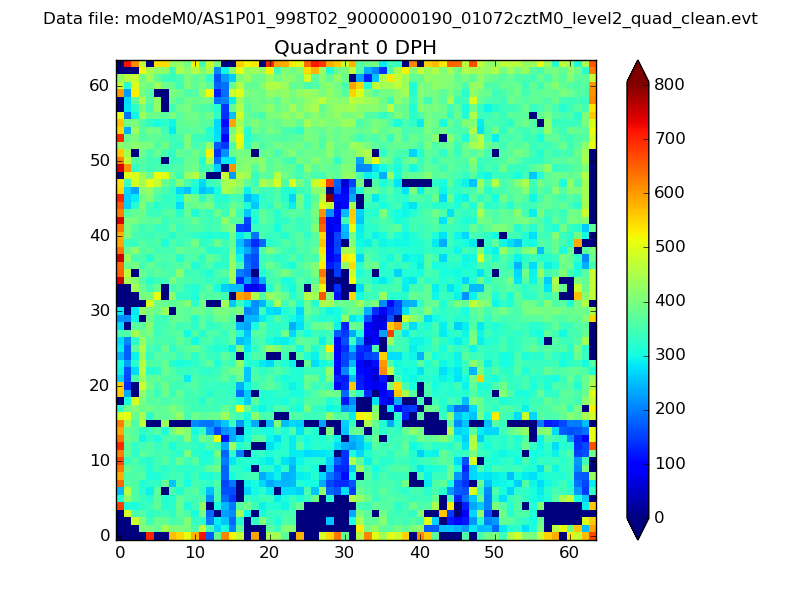 |
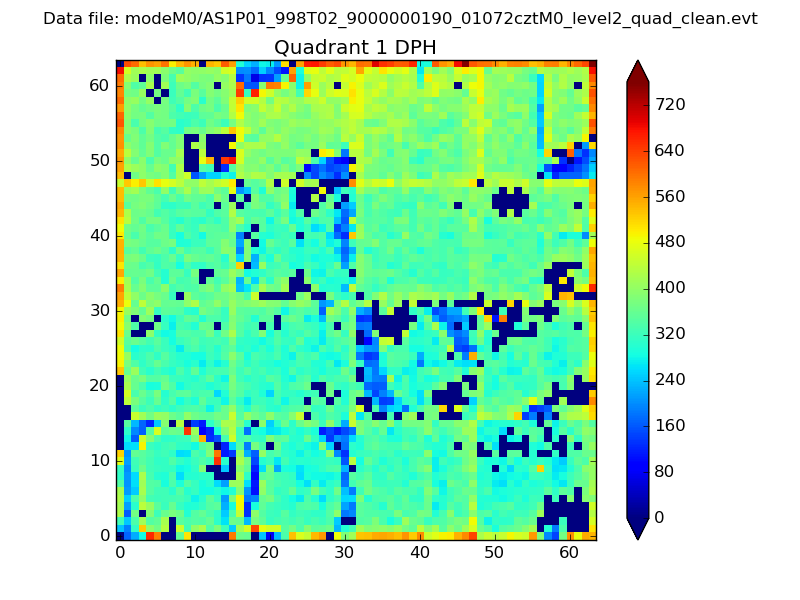 |
Quadrant B |
|---|---|---|---|
| Quadrant D | 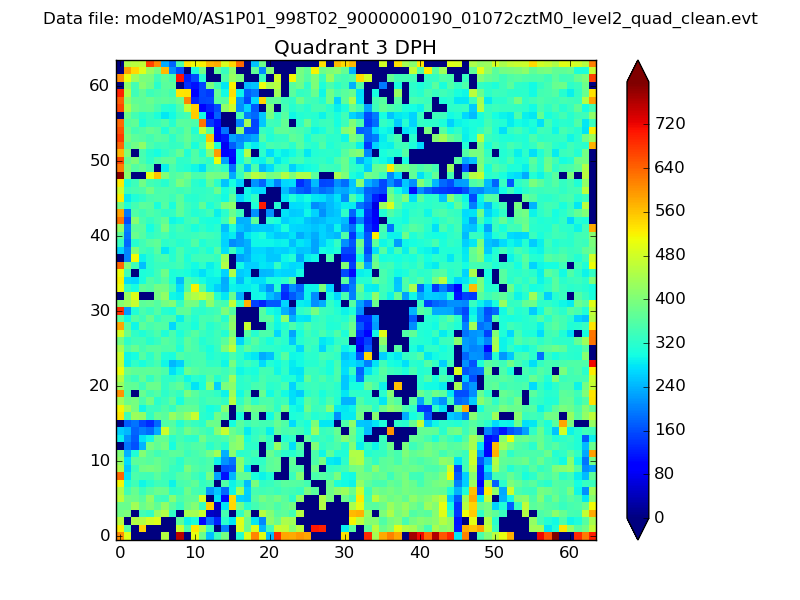 |
 |
Quadrant C |
| Plot type | Count rate plots | Images |
|---|---|---|
| Comparison with Poisson distribution Blue bars denote a histogram of data divided into 1 sec bins. Red curve is a Poisson curve with rate = median count rate of data. |
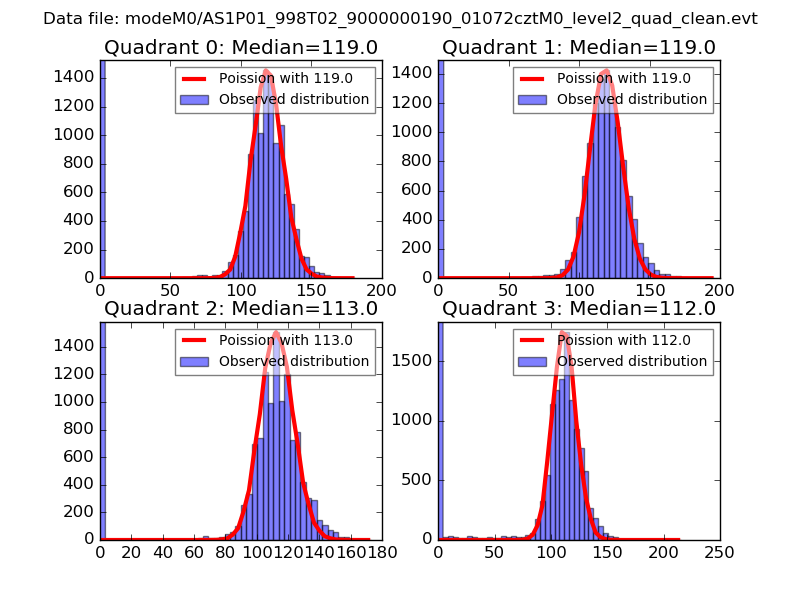 |
 |
| Quadrant-wise count rates Data is divided into 100 sec bins |
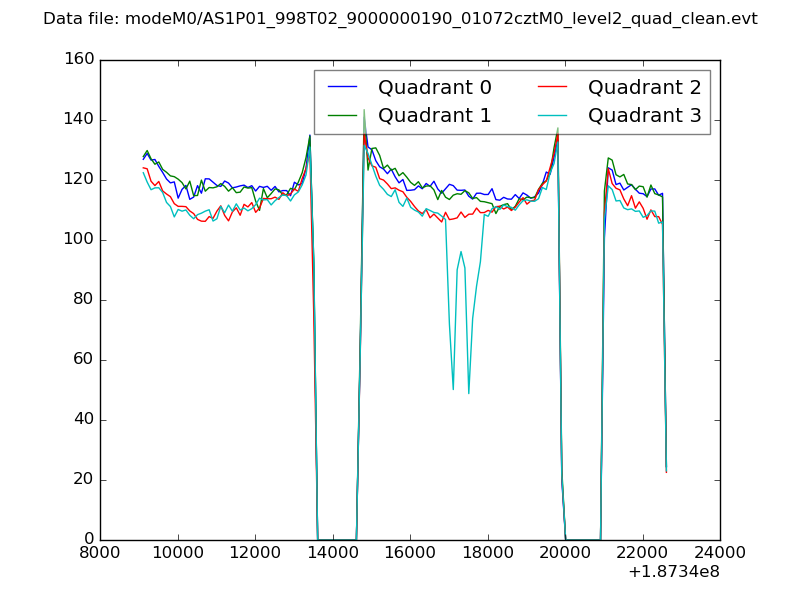 |
|
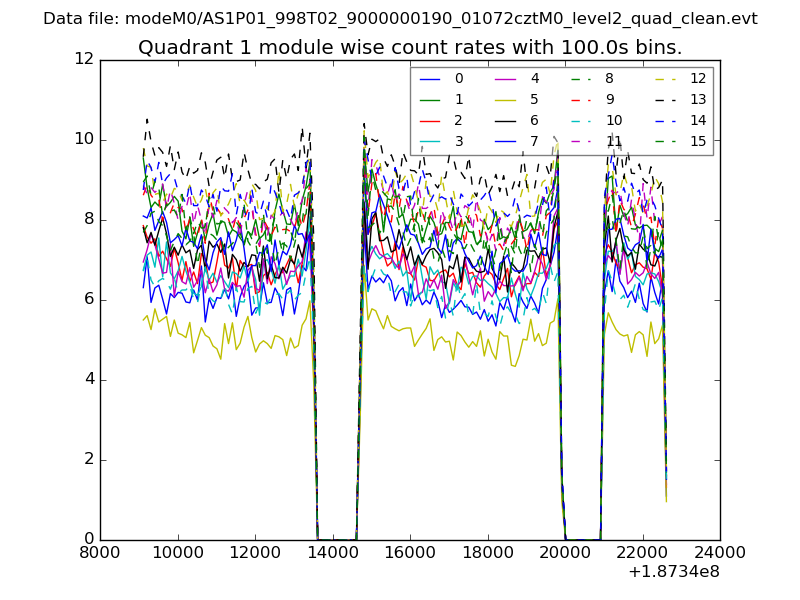
| Module-wise count rates for Quadrant A Data is divided into 100 sec bins |
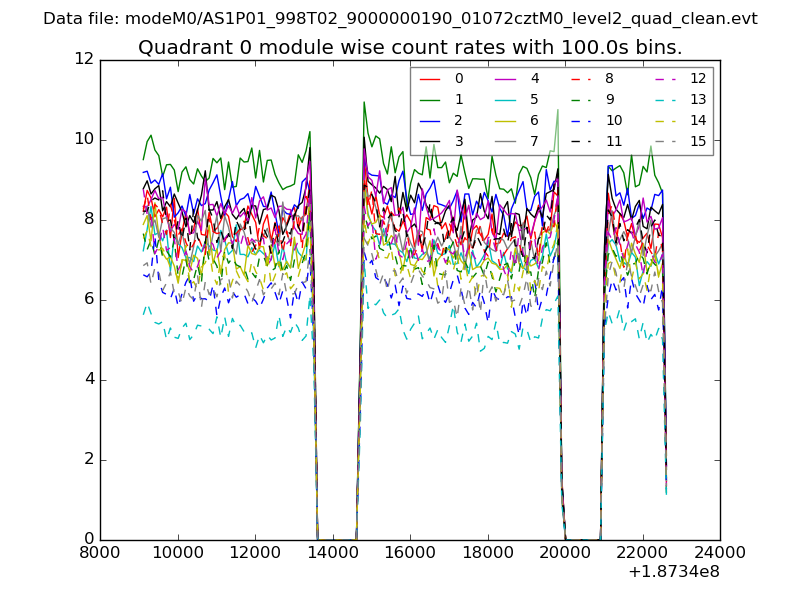 |
 |
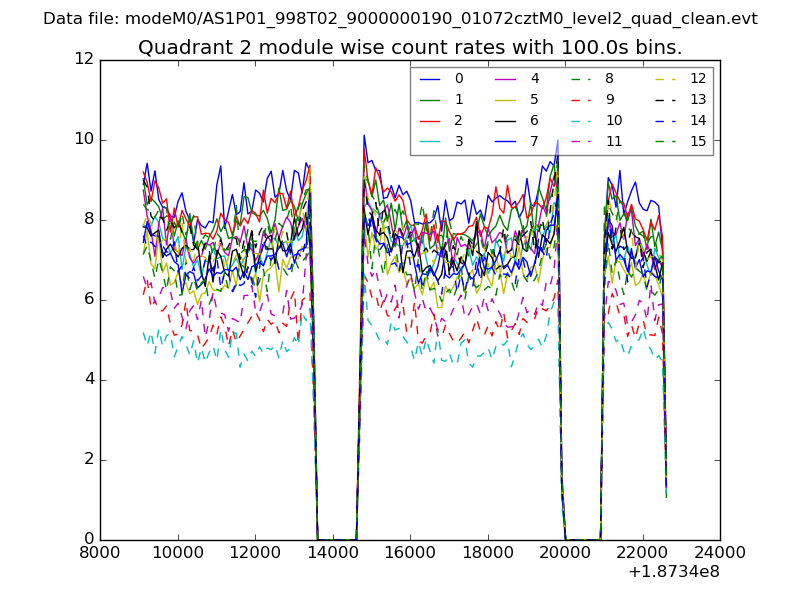
| Module-wise count rates for Quadrant B Data is divided into 100 sec bins |
 |
 |
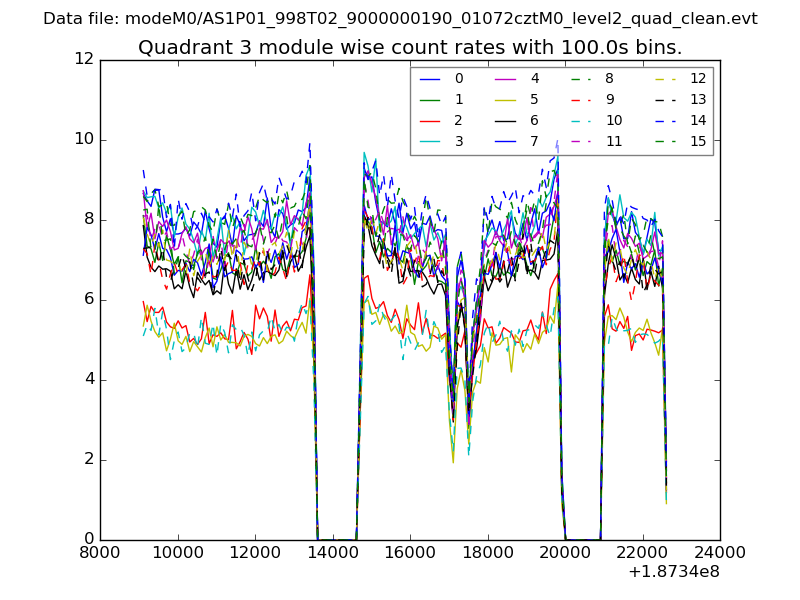
| Module-wise count rates for Quadrant C Data is divided into 100 sec bins |
 |
 |
| Module-wise count rates for Quadrant D Data is divided into 100 sec bins |
 |
 |
| Parameter | Plot |
|---|---|
| CZT HV Monitor | 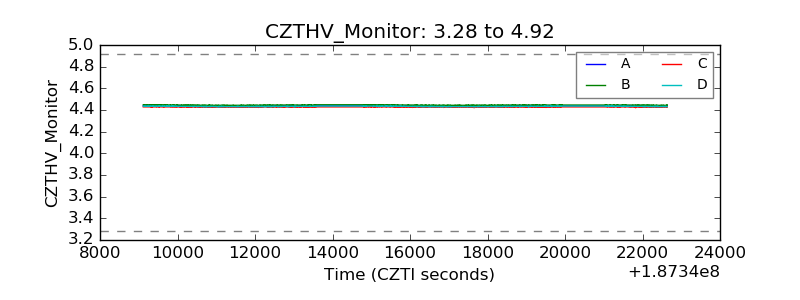 |
| D_VDD | 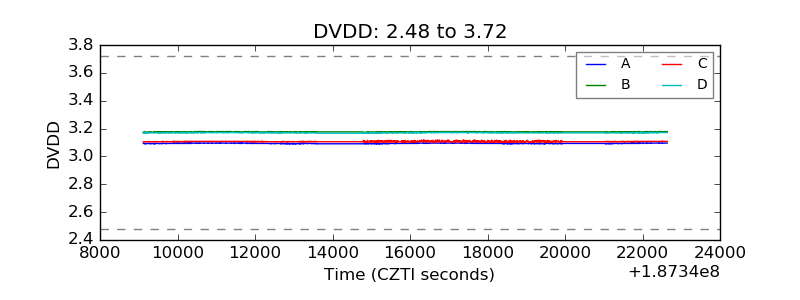 |
| Temperature 1 | 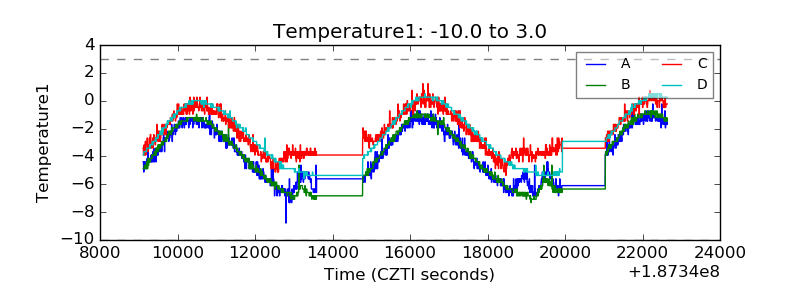 |
| Veto HV Monitor | 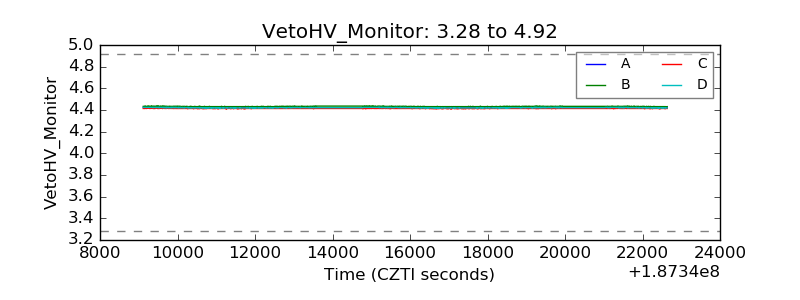 |
| Veto LLD | 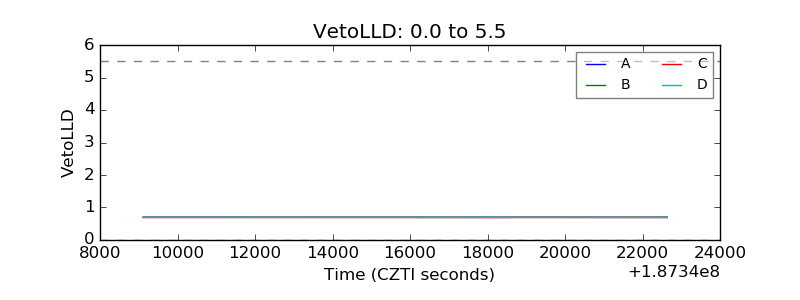 |
| Alpha Counter | 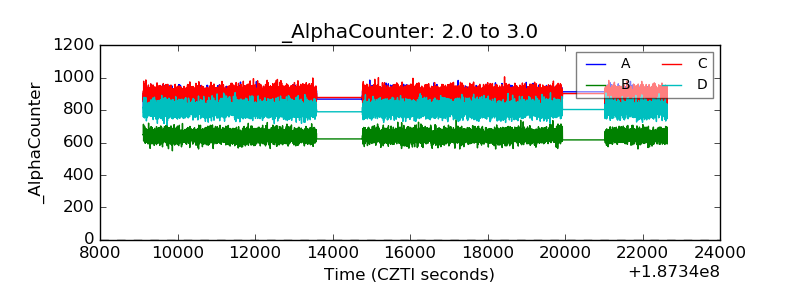 |
| _CPM_Rate | 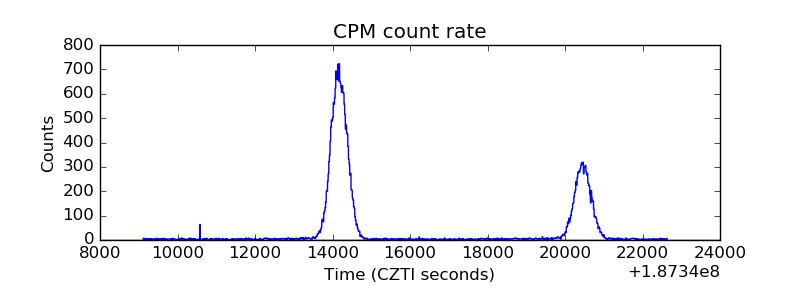 |
| CZT Counter | 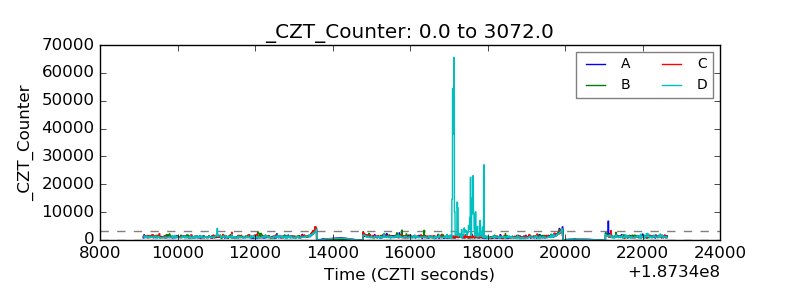 |
| +2.5 Volts monitor |  |
| +5 Volts monitor |  |
| _ROLL_ROT | 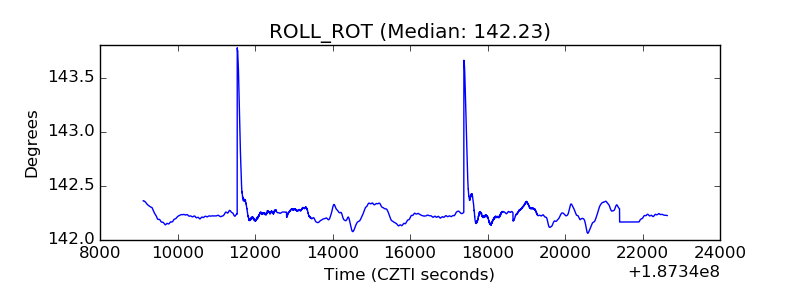 |
| _Roll_DEC | 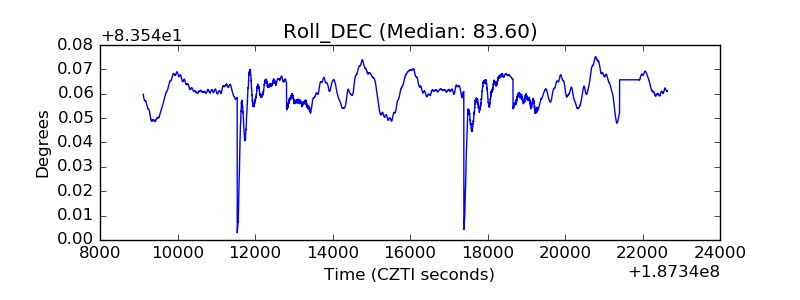 |
| _Roll_RA | 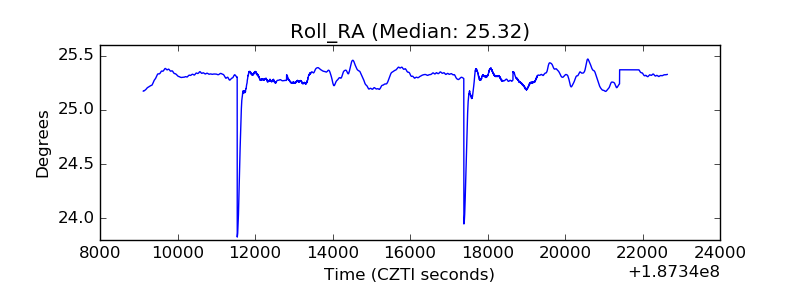 |
| Veto Counter | 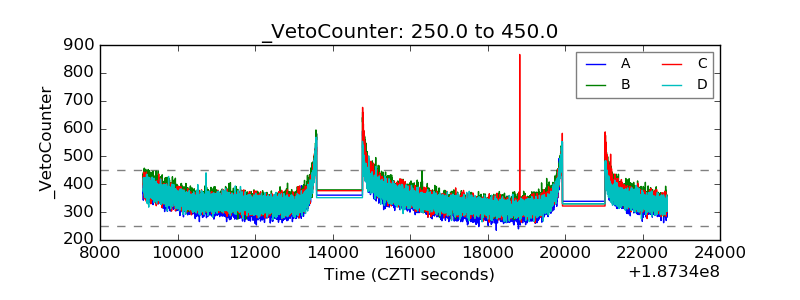 |