| Param | Original file | Final file |
|---|---|---|
| Filename | modeM0/AS1P01_998T02_9000000190_01073cztM0_level2.evt | modeM0/AS1P01_998T02_9000000190_01073cztM0_level2_quad_clean.evt |
| Size (bytes) | 646,470,720 | 66,144,960 |
| Size | 616.5 MB | 63.1 MB |
| Events in quadrant A | 4,310,607 | 453,486 |
| Events in quadrant B | 4,705,010 | 449,405 |
| Events in quadrant C | 4,543,938 | 438,976 |
| Events in quadrant D | 5,747,741 | 374,721 |
| Mode M0 | |||
|---|---|---|---|
| Quadrant | BADHDUFLAG | Total packets | Discarded packets |
| A | 0 | 15702 | 7 |
| B | 0 | 16872 | 20 |
| C | 0 | 16383 | 12 |
| D | 0 | 20135 | 30 |
| Mode SS | |||
|---|---|---|---|
| Quadrant | BADHDUFLAG | Total packets | Discarded packets |
| A | 0 | 82 | 0 |
| B | 0 | 82 | 0 |
| C | 0 | 82 | 0 |
| D | 0 | 82 | 0 |
| Quadrant | Total seconds | Saturated seconds | Saturation percentage |
|---|---|---|---|
| A | 4054 | 1 | 0.024667% |
| B | 4051 | 26 | 0.641817% |
| C | 4053 | 0 | 0.000000% |
| D | 4053 | 727 | 17.937330% |
Noise dominated data is calculated using 1-second bins in cleaned event files. If a bin has >2000 counts, and if more than 50% of those come from <1% of pixels, then it is considered to be noise-dominated and hence unusable.
| Quadrant | # 1 sec bins | Bins with >0 counts | Bins with >2000 counts | High rate bins dominated by noise | Noise dominated (total time) | Noise dominated (detector-on time) | Marked lightcurve |
|---|---|---|---|---|---|---|---|
| A | 4056 | 4056 | 53 | 53 | 1.31% | 1.31% | 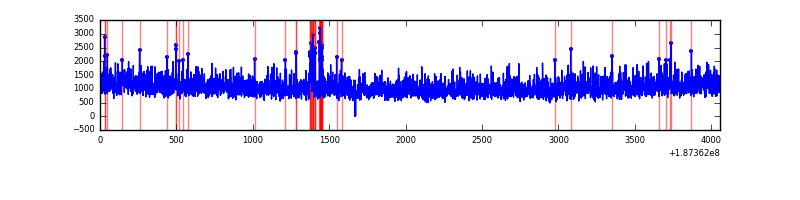 |
| B | 4056 | 4056 | 104 | 104 | 2.56% | 2.56% | 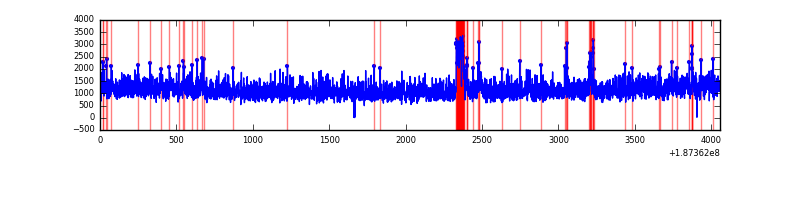 |
| C | 4056 | 4055 | 32 | 32 | 0.79% | 0.79% | 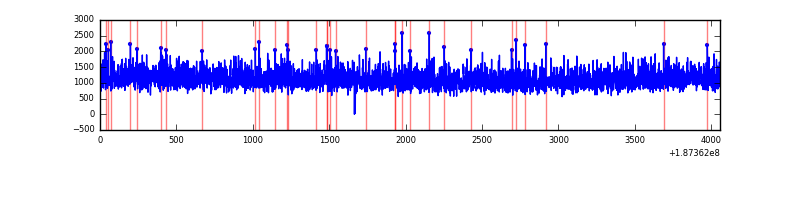 |
| D | 4056 | 4054 | 761 | 761 | 18.76% | 18.77% | 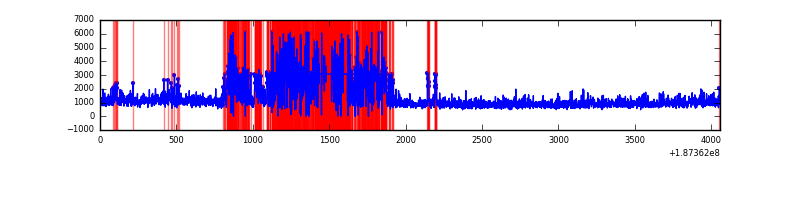 |
Top three noisy pixels from each quadrant. If the there are fewer than three noisy pixels in the level2.evt file, extra rows are filled as -1
| Pixel properties | Quadrant properties | ||||||
|---|---|---|---|---|---|---|---|
| Quadrant | DetID | PixID | Counts | Sigma | Mean | Median | Sigma |
| A | 0 | 253 | 52436 | 195.5 | 1107 | 1112 | 262.5 |
| A | 15 | 233 | 7357 | 23.79 | 1107 | 1112 | 262.5 |
| A | 11 | 79 | 4294 | 12.12 | 1107 | 1112 | 262.5 |
| B | 5 | 191 | 167953 | 612.95 | 1174 | 1178 | 272.1 |
| B | 5 | 249 | 21628 | 75.16 | 1174 | 1178 | 272.1 |
| B | 15 | 22 | 13523 | 45.37 | 1174 | 1178 | 272.1 |
| C | 15 | 241 | 209821 | 690.64 | 1092 | 1132 | 302.2 |
| C | 3 | 79 | 29760 | 94.74 | 1092 | 1132 | 302.2 |
| C | 3 | 111 | 19837 | 61.9 | 1092 | 1132 | 302.2 |
| D | 13 | 73 | 44772 | 169.86 | 916 | 949 | 258.0 |
| D | 2 | 152 | 36553 | 138.01 | 916 | 949 | 258.0 |
| D | 2 | 25 | 32785 | 123.4 | 916 | 949 | 258.0 |
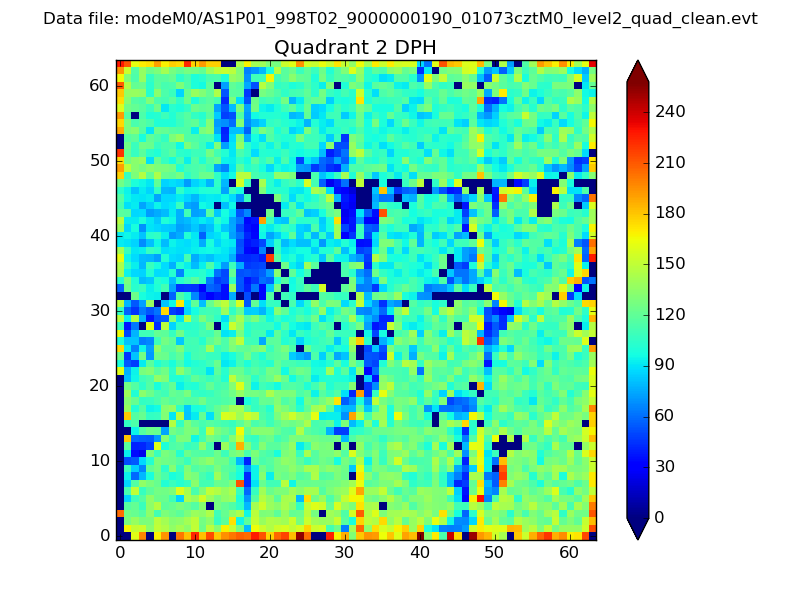
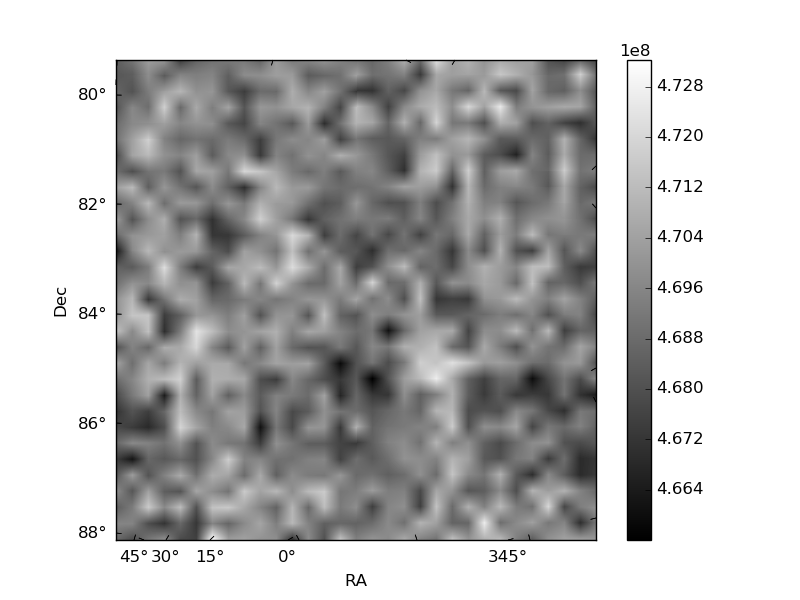
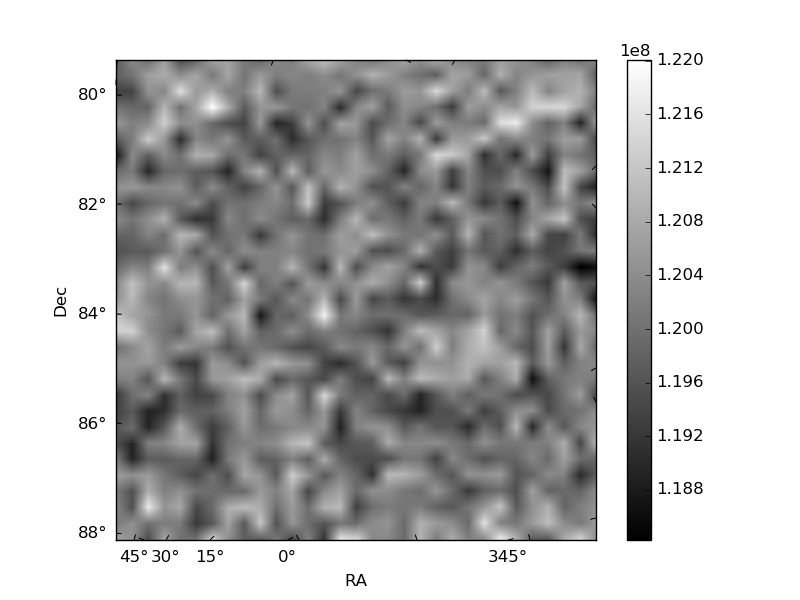
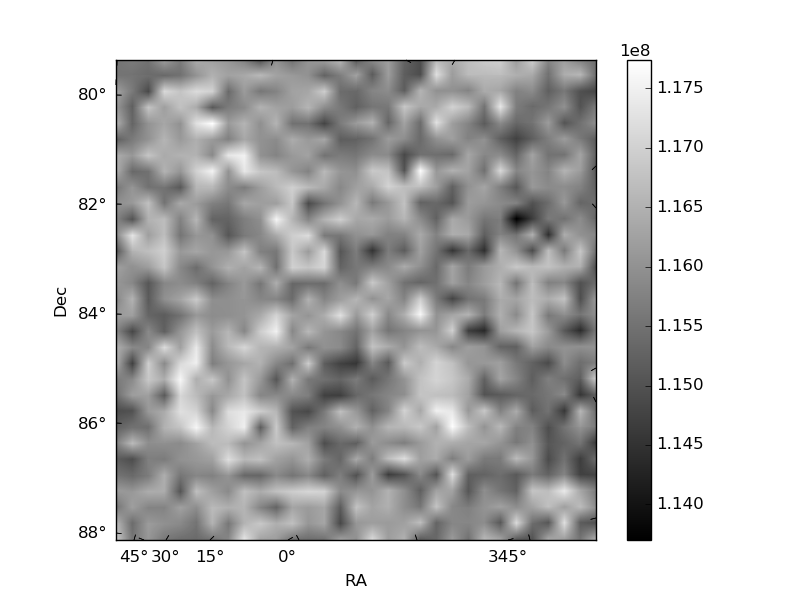
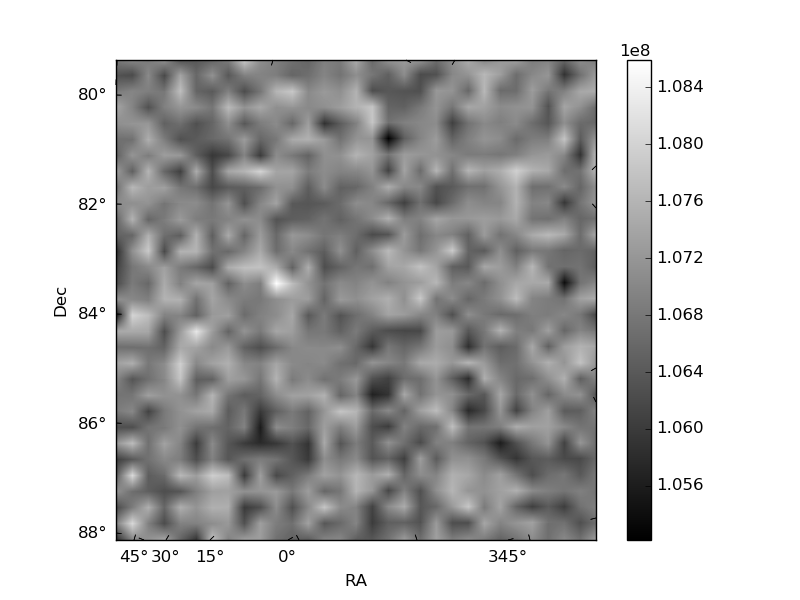
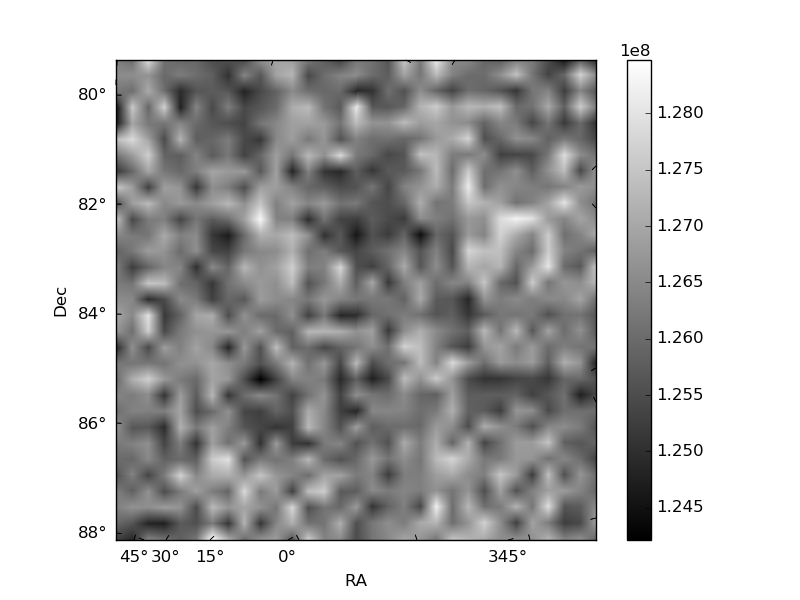
Histogram calculated using DETX and DETY for each event in the final _common_clean file
| Quadrant A | 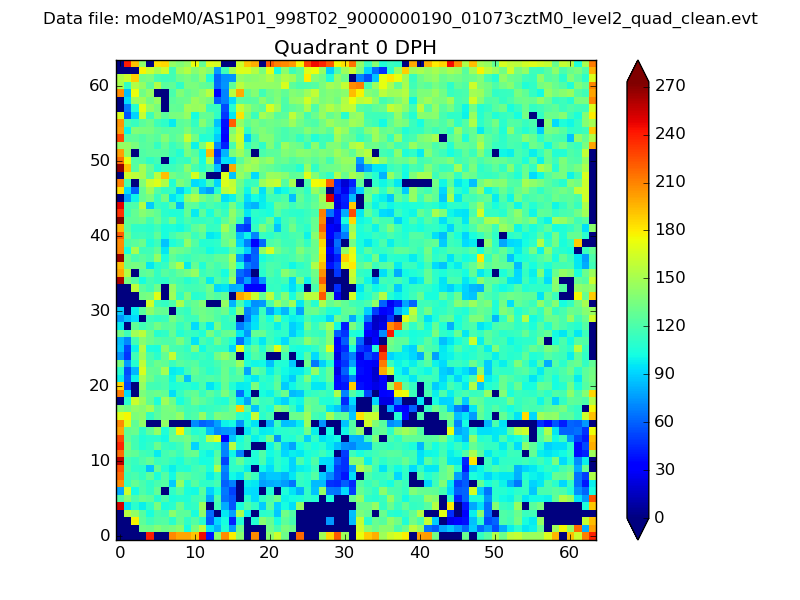 |
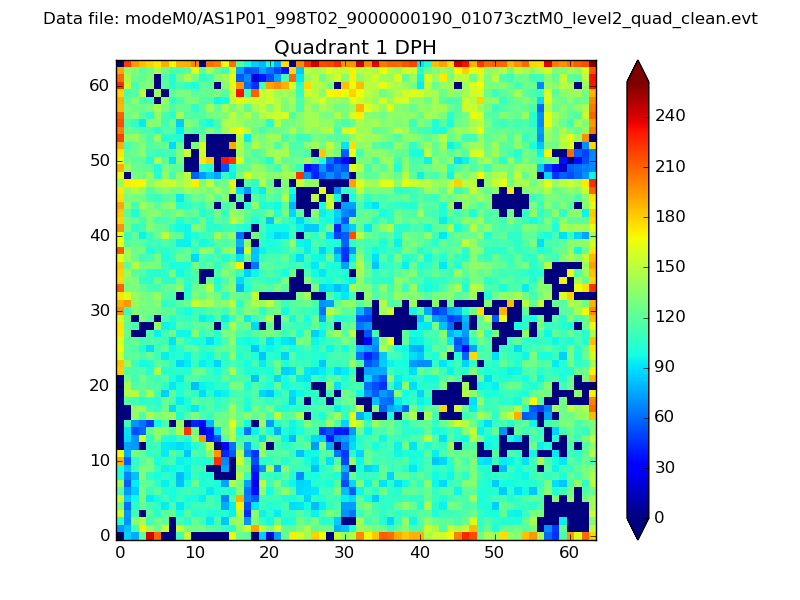 |
Quadrant B |
|---|---|---|---|
| Quadrant D | 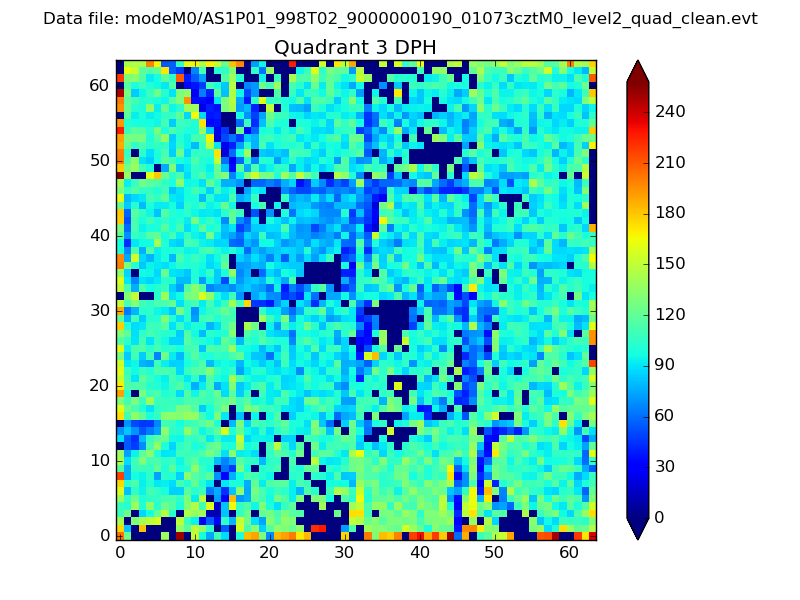 |
 |
Quadrant C |
| Plot type | Count rate plots | Images |
|---|---|---|
| Comparison with Poisson distribution Blue bars denote a histogram of data divided into 1 sec bins. Red curve is a Poisson curve with rate = median count rate of data. |
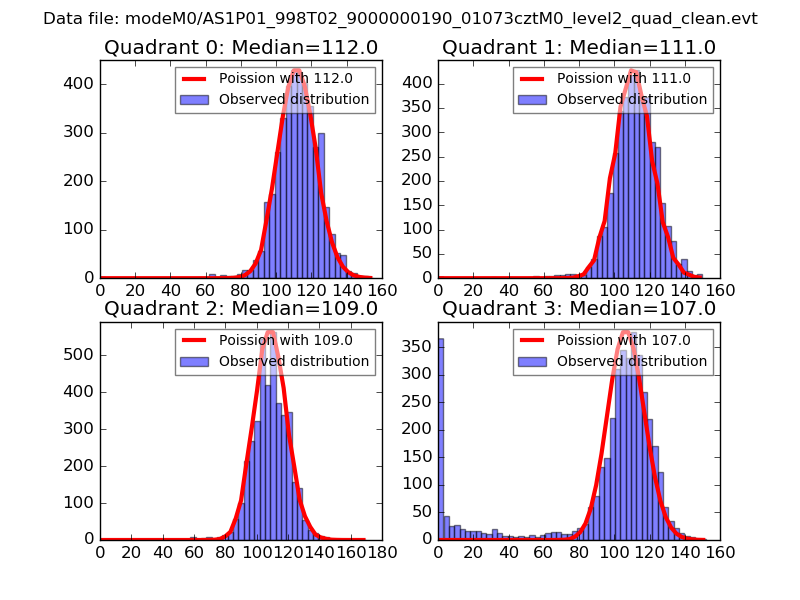 |
 |
| Quadrant-wise count rates Data is divided into 100 sec bins |
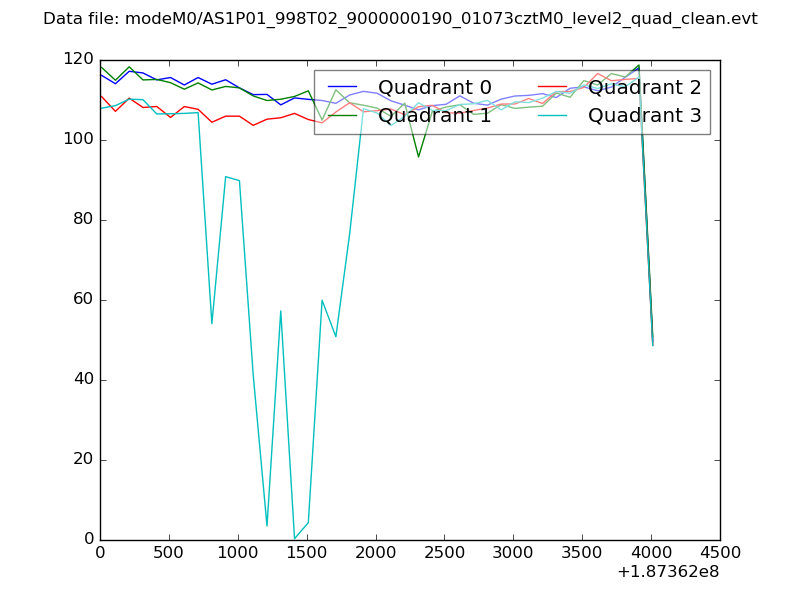 |
|
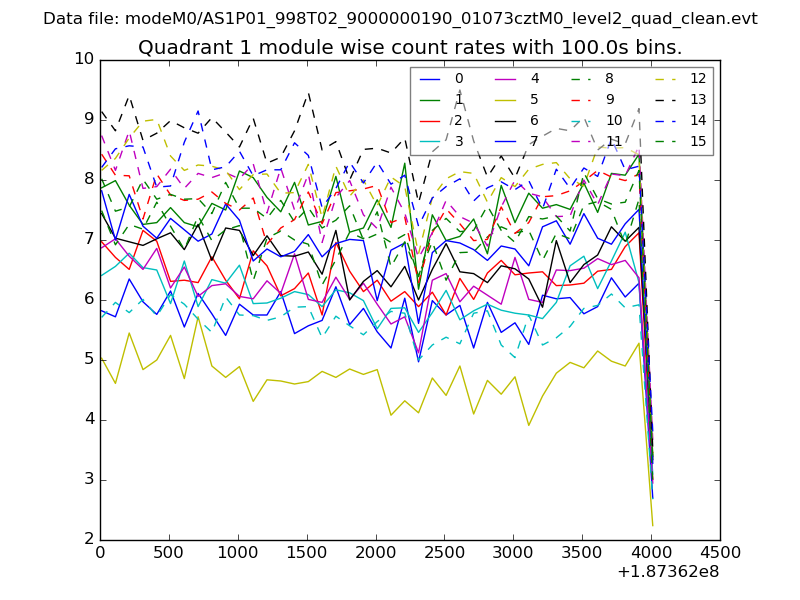
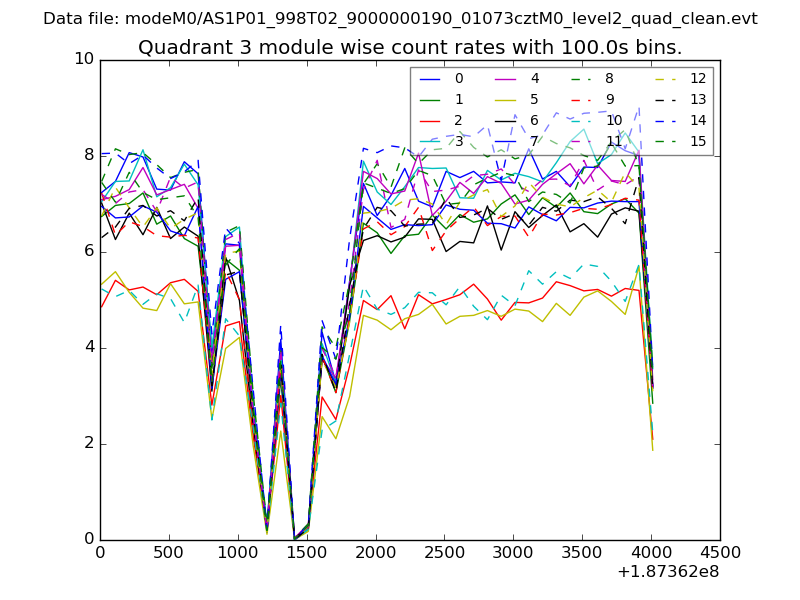
| Module-wise count rates for Quadrant A Data is divided into 100 sec bins |
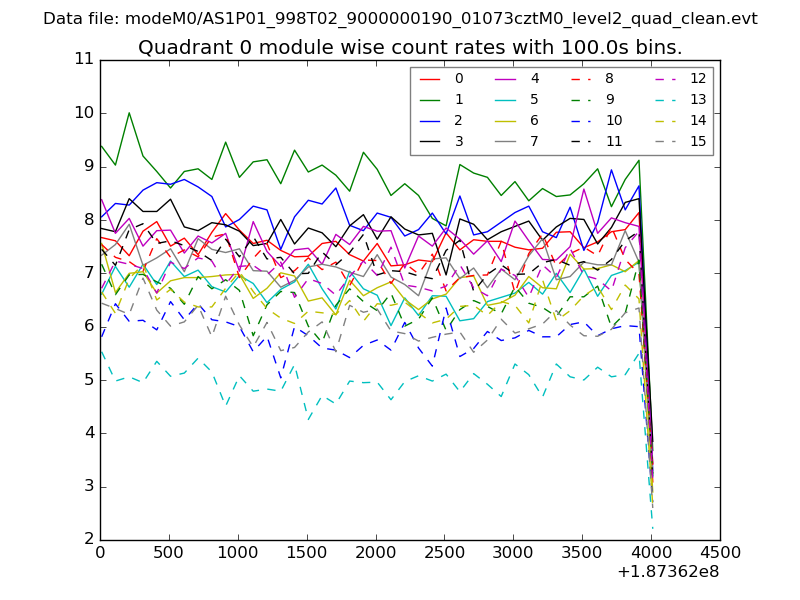 |
 |
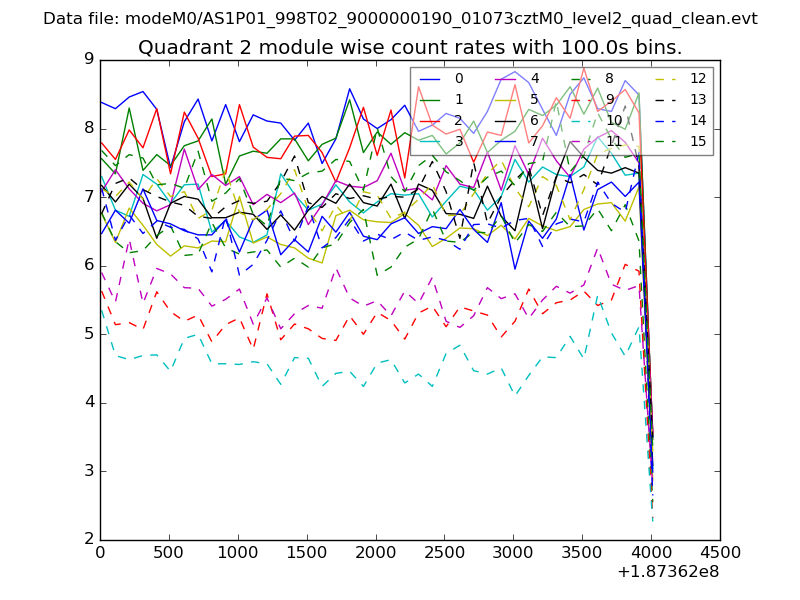
| Module-wise count rates for Quadrant B Data is divided into 100 sec bins |
 |
 |
| Module-wise count rates for Quadrant C Data is divided into 100 sec bins |
 |
 |
| Module-wise count rates for Quadrant D Data is divided into 100 sec bins |
 |
 |
| Parameter | Plot |
|---|---|
| CZT HV Monitor | 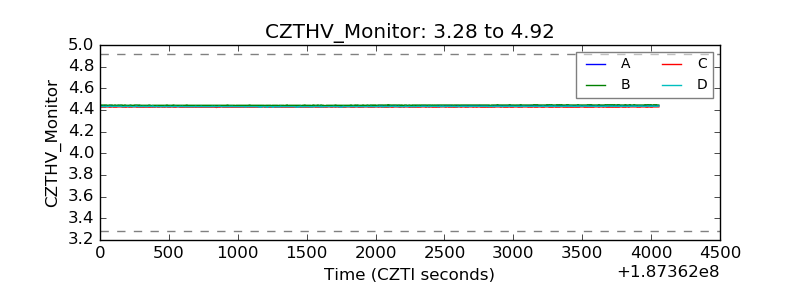 |
| D_VDD | 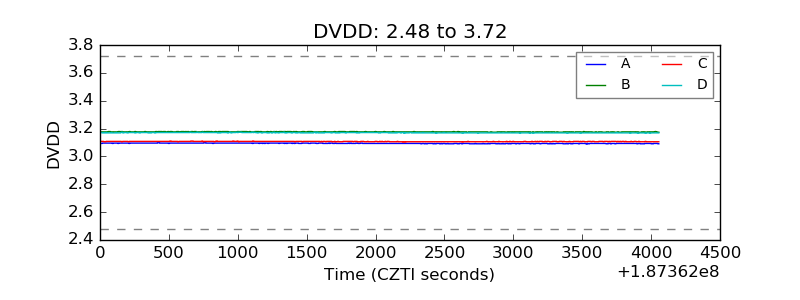 |
| Temperature 1 | 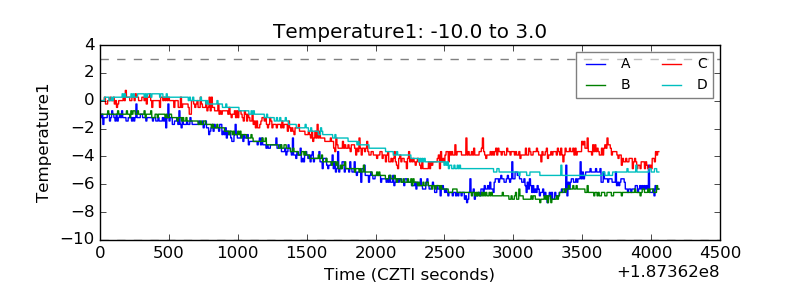 |
| Veto HV Monitor | 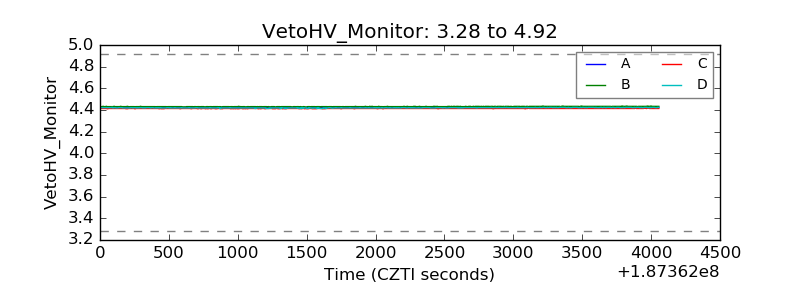 |
| Veto LLD | 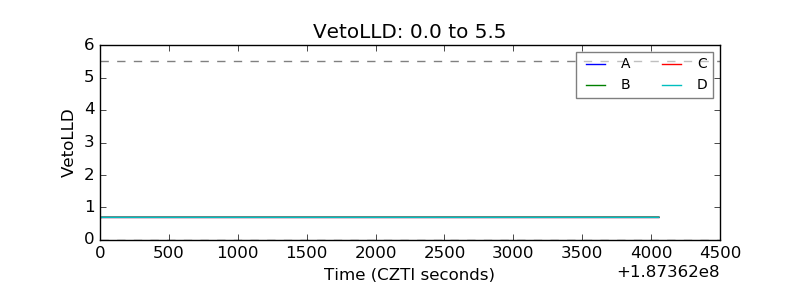 |
| Alpha Counter | 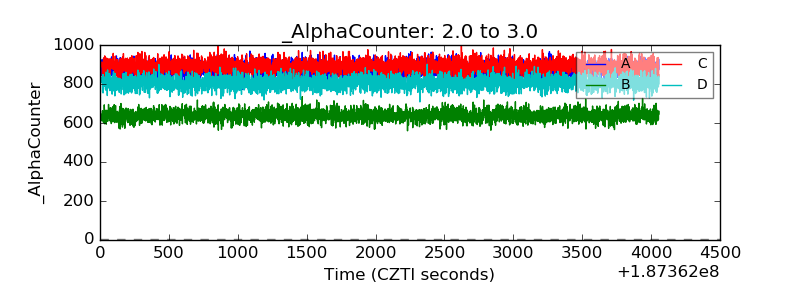 |
| _CPM_Rate | 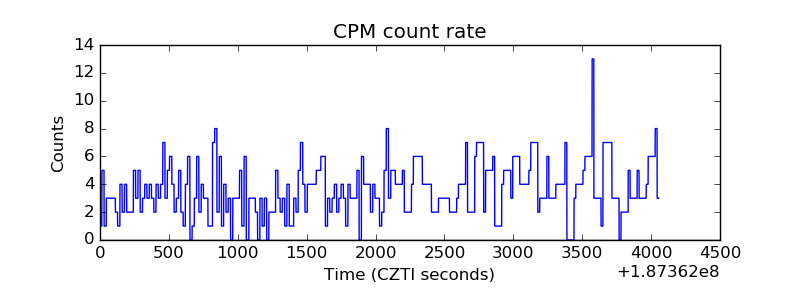 |
| CZT Counter | 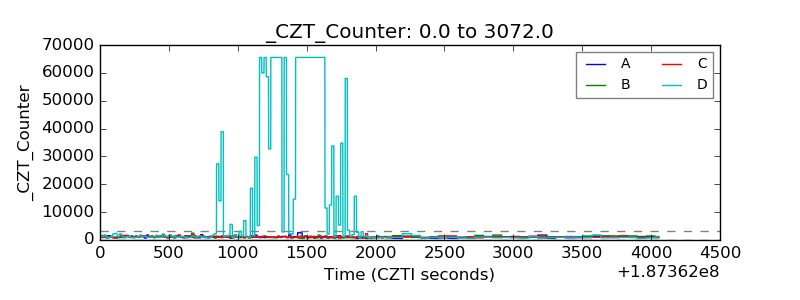 |
| +2.5 Volts monitor |  |
| +5 Volts monitor |  |
| _ROLL_ROT | 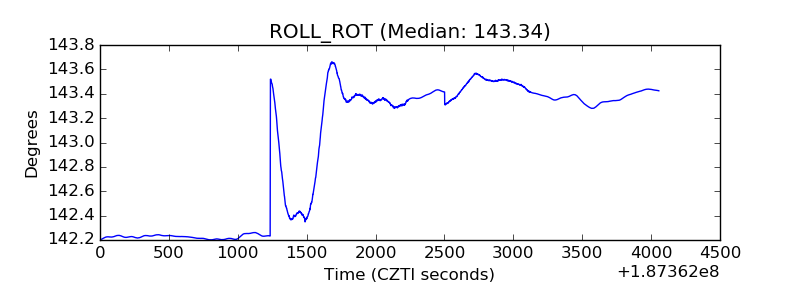 |
| _Roll_DEC | 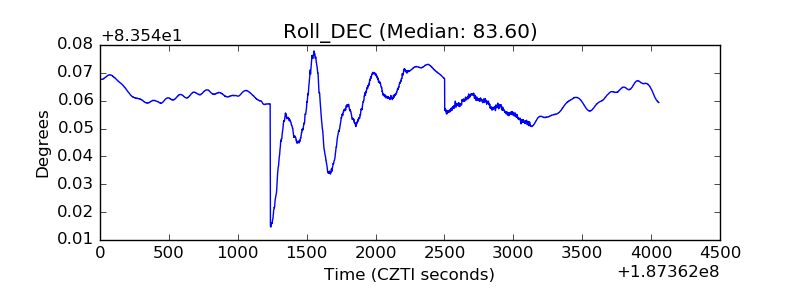 |
| _Roll_RA | 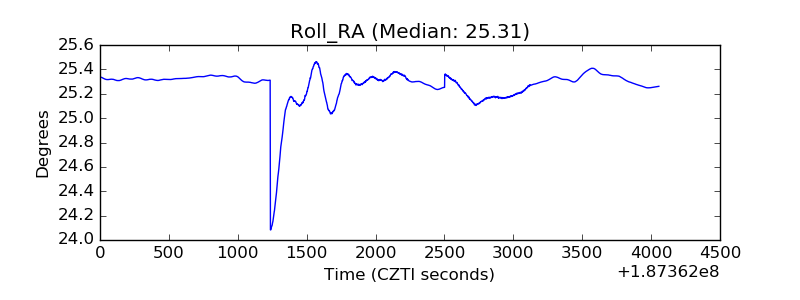 |
| Veto Counter | 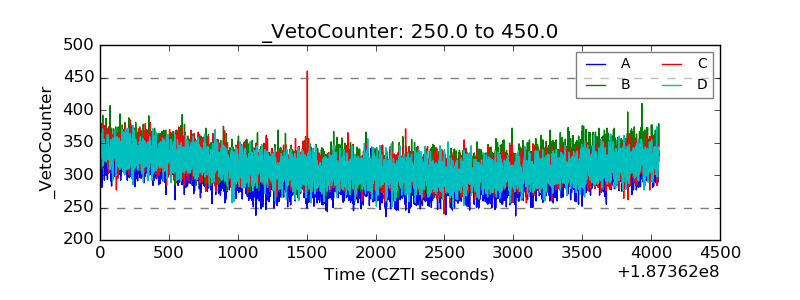 |