| Param | Original file | Final file |
|---|---|---|
| Filename | modeM0/AS1P01_998T02_9000000190_01074cztM0_level2.evt | modeM0/AS1P01_998T02_9000000190_01074cztM0_level2_quad_clean.evt |
| Size (bytes) | 1,049,172,480 | 111,738,240 |
| Size | 1000.6 MB | 106.6 MB |
| Events in quadrant A | 7,783,208 | 745,764 |
| Events in quadrant B | 8,118,913 | 743,833 |
| Events in quadrant C | 7,935,096 | 721,251 |
| Events in quadrant D | 7,497,274 | 711,035 |
| Mode M0 | |||
|---|---|---|---|
| Quadrant | BADHDUFLAG | Total packets | Discarded packets |
| A | 0 | 27896 | 5 |
| B | 0 | 28796 | 1 |
| C | 0 | 28287 | 1 |
| D | 0 | 27042 | 1 |
| Mode SS | |||
|---|---|---|---|
| Quadrant | BADHDUFLAG | Total packets | Discarded packets |
| A | 0 | 132 | 0 |
| B | 0 | 132 | 0 |
| C | 0 | 132 | 0 |
| D | 0 | 132 | 0 |
| Mode M9 | |||
|---|---|---|---|
| Quadrant | BADHDUFLAG | Total packets | Discarded packets |
| A | 0 | 6 | 0 |
| B | 0 | 6 | 0 |
| C | 0 | 6 | 0 |
| D | 0 | 6 | 0 |
| Quadrant | Total seconds | Saturated seconds | Saturation percentage |
|---|---|---|---|
| A | 6638 | 7 | 0.105453% |
| B | 6638 | 48 | 0.723109% |
| C | 6638 | 11 | 0.165713% |
| D | 6639 | 44 | 0.662750% |
Noise dominated data is calculated using 1-second bins in cleaned event files. If a bin has >2000 counts, and if more than 50% of those come from <1% of pixels, then it is considered to be noise-dominated and hence unusable.
| Quadrant | # 1 sec bins | Bins with >0 counts | Bins with >2000 counts | High rate bins dominated by noise | Noise dominated (total time) | Noise dominated (detector-on time) | Marked lightcurve |
|---|---|---|---|---|---|---|---|
| A | 7148 | 6639 | 256 | 256 | 3.58% | 3.86% | 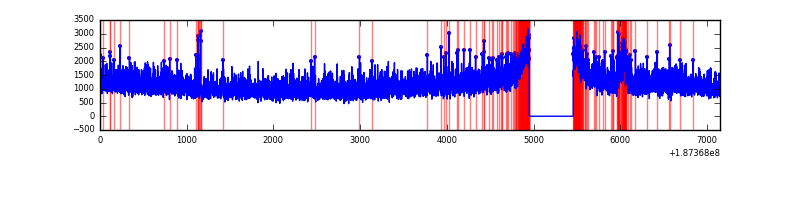 |
| B | 7148 | 6639 | 278 | 278 | 3.89% | 4.19% | 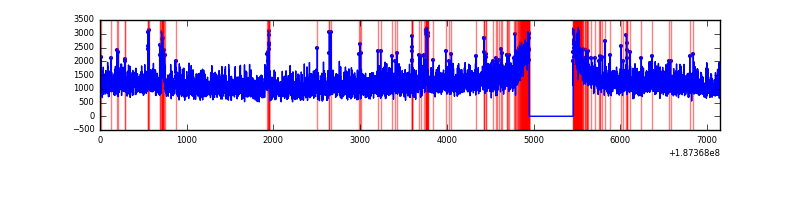 |
| C | 7148 | 6639 | 213 | 213 | 2.98% | 3.21% | 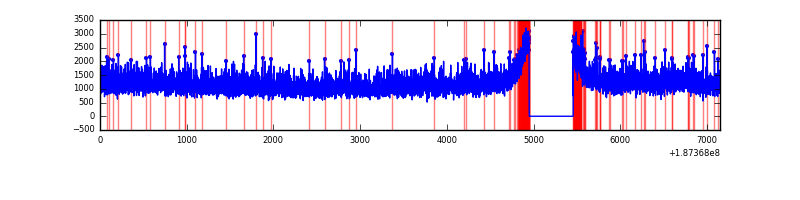 |
| D | 7149 | 6640 | 263 | 263 | 3.68% | 3.96% | 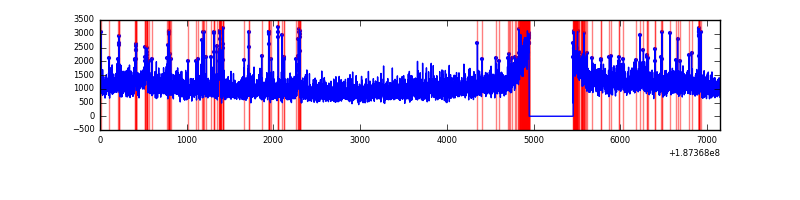 |
Top three noisy pixels from each quadrant. If the there are fewer than three noisy pixels in the level2.evt file, extra rows are filled as -1
| Pixel properties | Quadrant properties | ||||||
|---|---|---|---|---|---|---|---|
| Quadrant | DetID | PixID | Counts | Sigma | Mean | Median | Sigma |
| A | 0 | 253 | 81397 | 164.35 | 2002 | 2018 | 483.0 |
| A | 4 | 2 | 17967 | 33.02 | 2002 | 2018 | 483.0 |
| A | 11 | 79 | 8574 | 13.57 | 2002 | 2018 | 483.0 |
| B | 5 | 191 | 149452 | 303.99 | 2066 | 2072 | 484.8 |
| B | 4 | 172 | 32012 | 61.75 | 2066 | 2072 | 484.8 |
| B | 4 | 217 | 19343 | 35.62 | 2066 | 2072 | 484.8 |
| C | 15 | 241 | 338217 | 626.72 | 1920 | 1989 | 536.5 |
| C | 3 | 79 | 44906 | 80.0 | 1920 | 1989 | 536.5 |
| C | 3 | 111 | 34973 | 61.48 | 1920 | 1989 | 536.5 |
| D | 2 | 216 | 136850 | 236.14 | 1884 | 1948 | 571.3 |
| D | 10 | 102 | 80761 | 137.96 | 1884 | 1948 | 571.3 |
| D | 13 | 73 | 70481 | 119.96 | 1884 | 1948 | 571.3 |
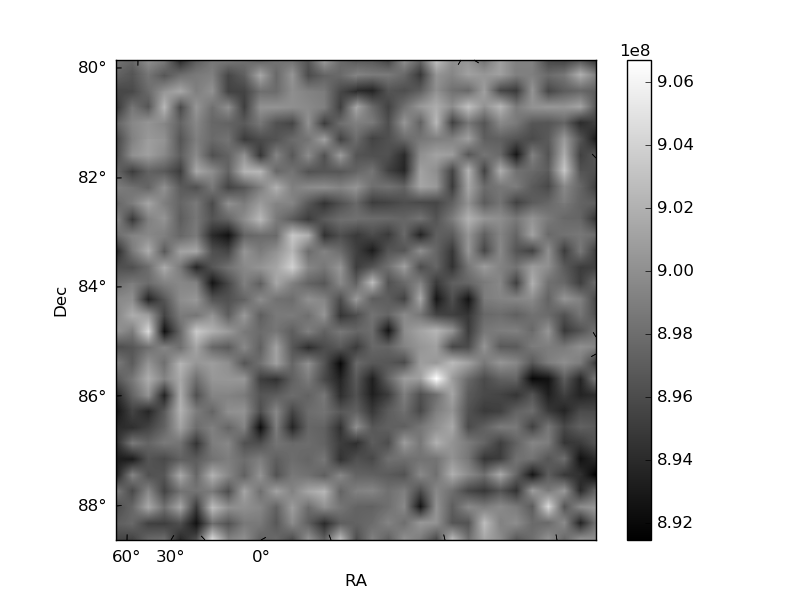
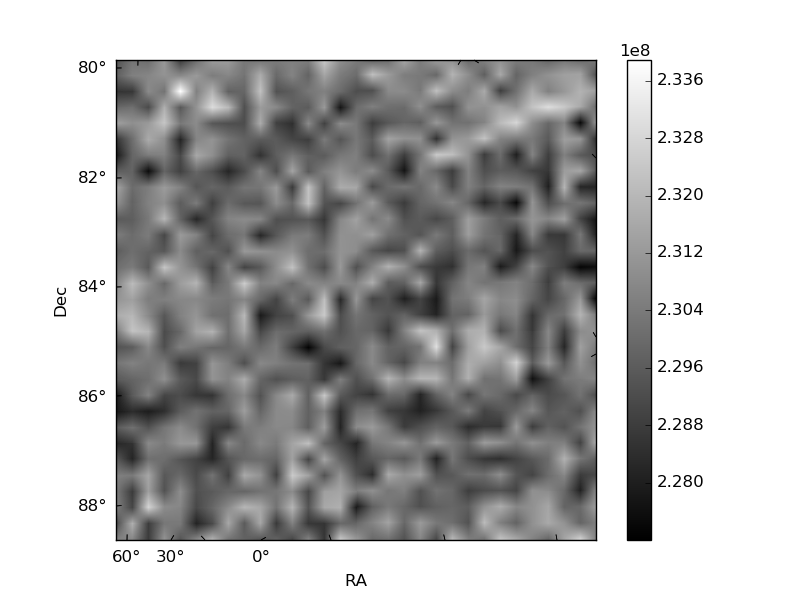
Histogram calculated using DETX and DETY for each event in the final _common_clean file
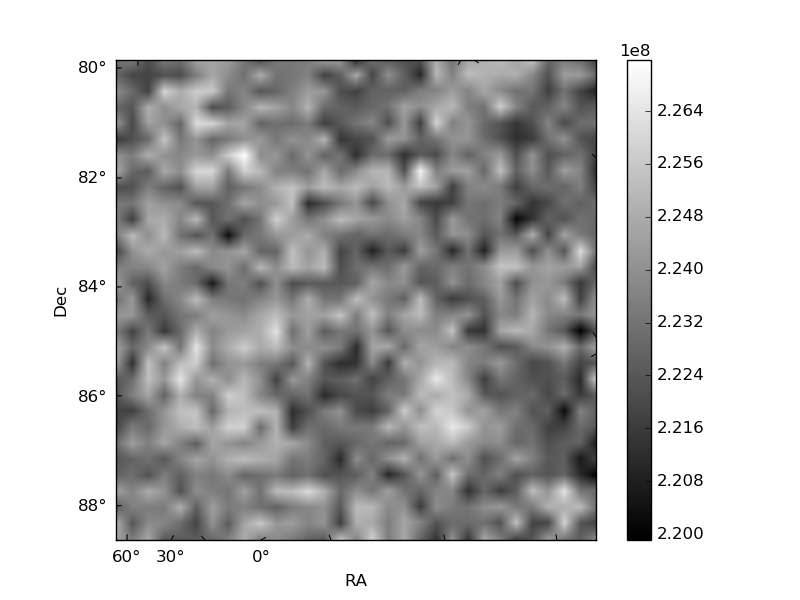
| Quadrant A | 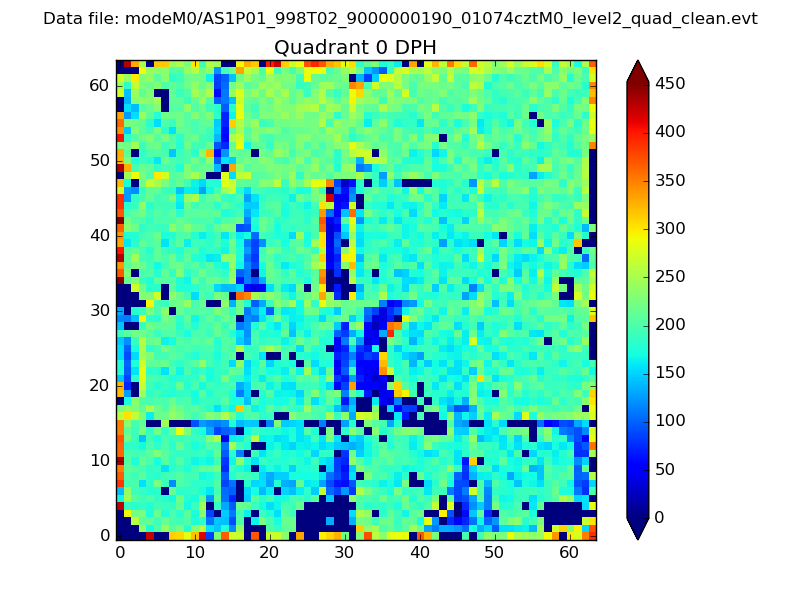 |
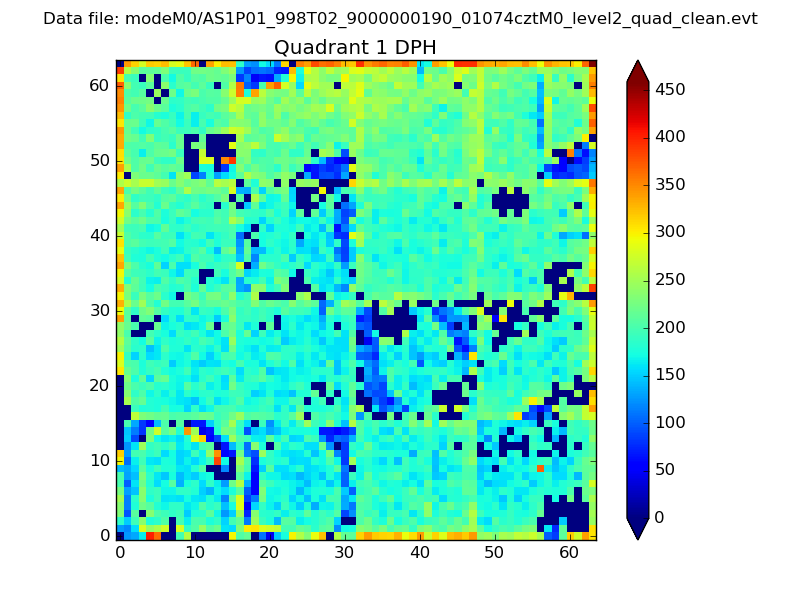 |
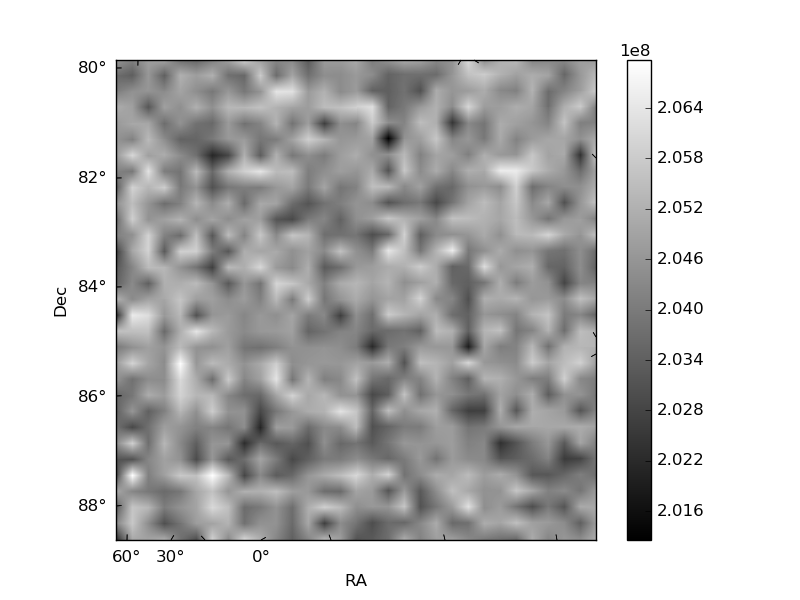
Quadrant B |
|---|---|---|---|
| Quadrant D | 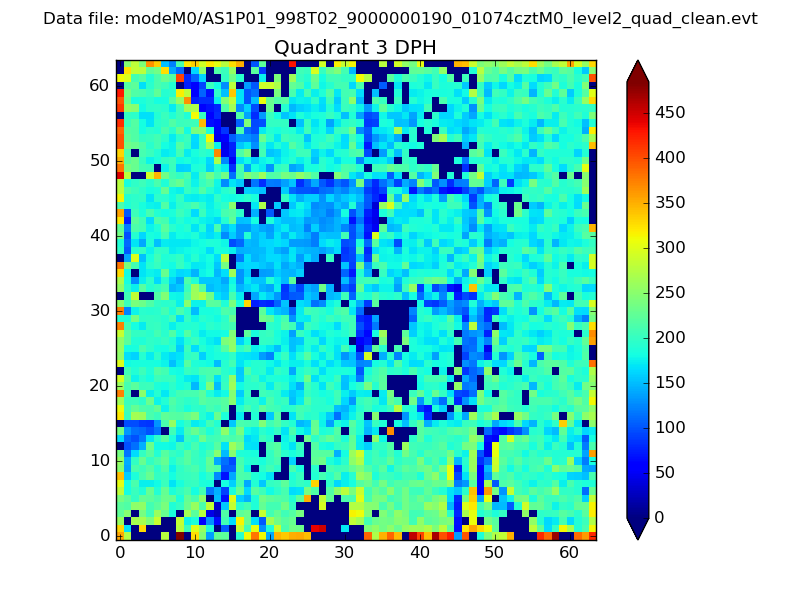 |
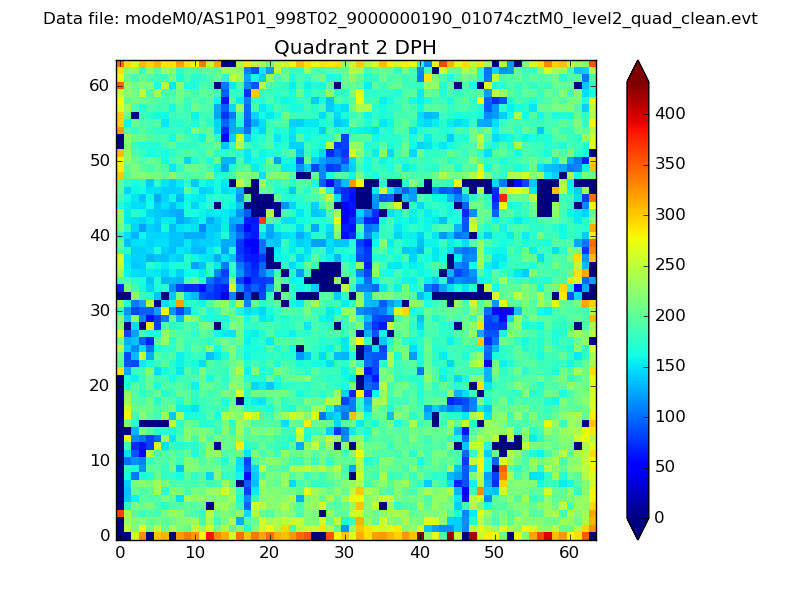 |
Quadrant C |
| Plot type | Count rate plots | Images |
|---|---|---|
| Comparison with Poisson distribution Blue bars denote a histogram of data divided into 1 sec bins. Red curve is a Poisson curve with rate = median count rate of data. |
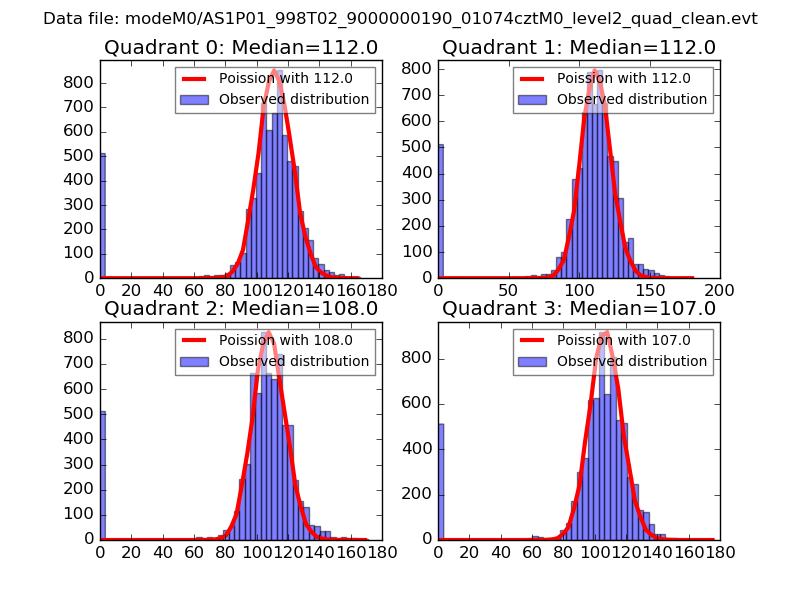 |
 |
| Quadrant-wise count rates Data is divided into 100 sec bins |
 |
|
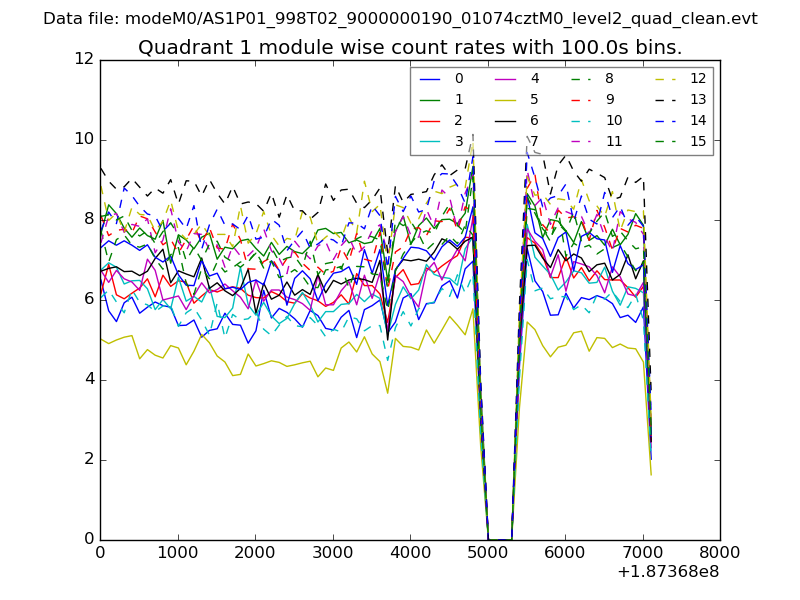
| Module-wise count rates for Quadrant A Data is divided into 100 sec bins |
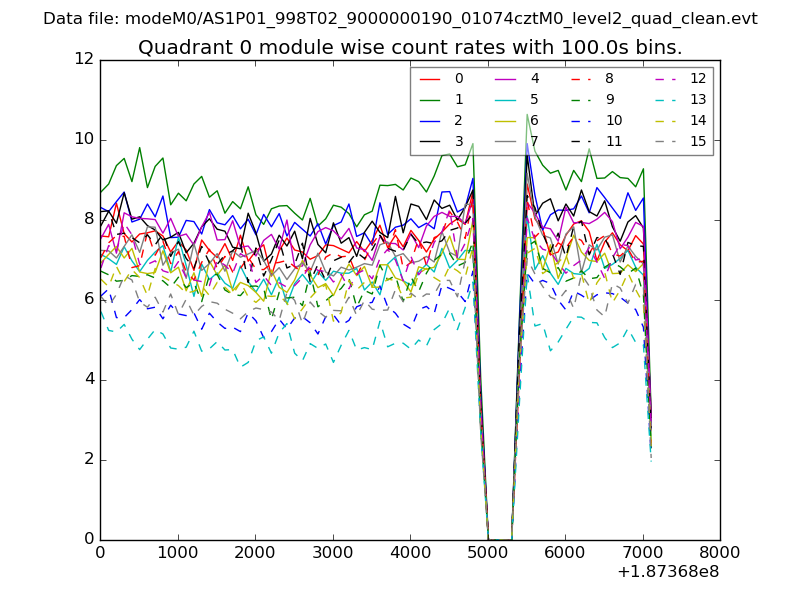 |
 |
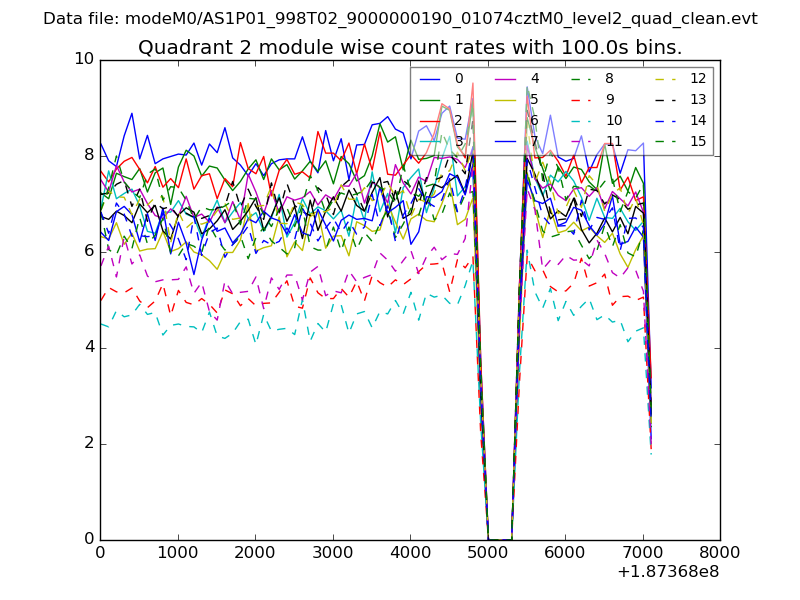
| Module-wise count rates for Quadrant B Data is divided into 100 sec bins |
 |
 |
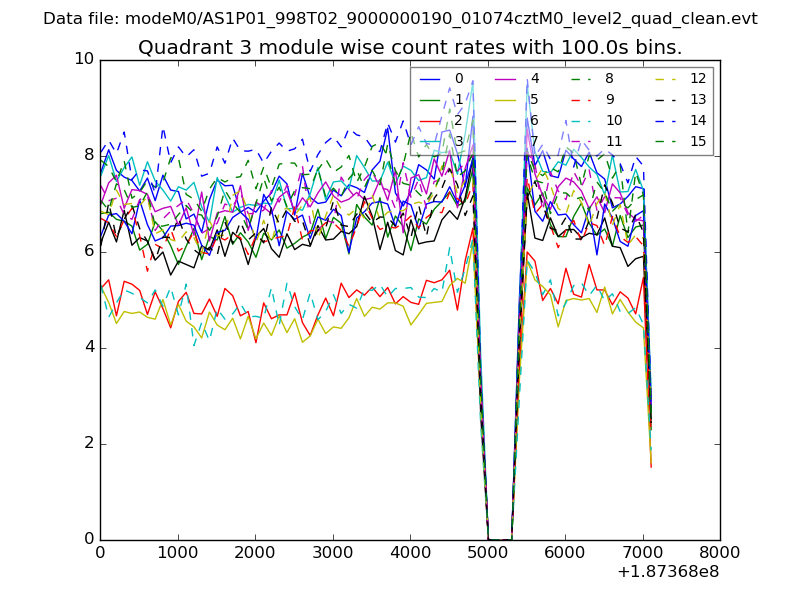
| Module-wise count rates for Quadrant C Data is divided into 100 sec bins |
 |
 |
| Module-wise count rates for Quadrant D Data is divided into 100 sec bins |
 |
 |
| Parameter | Plot |
|---|---|
| CZT HV Monitor | 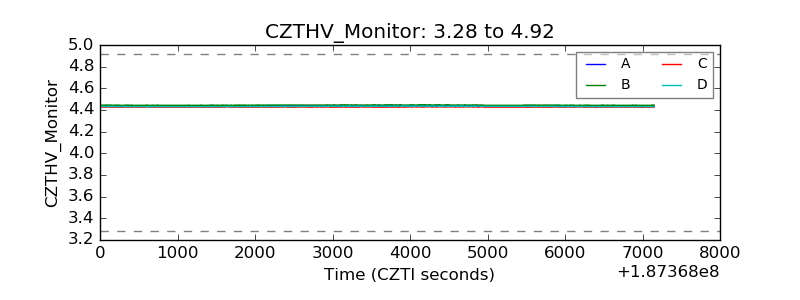 |
| D_VDD | 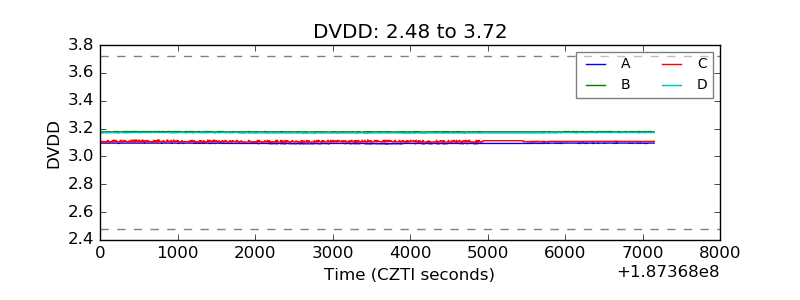 |
| Temperature 1 | 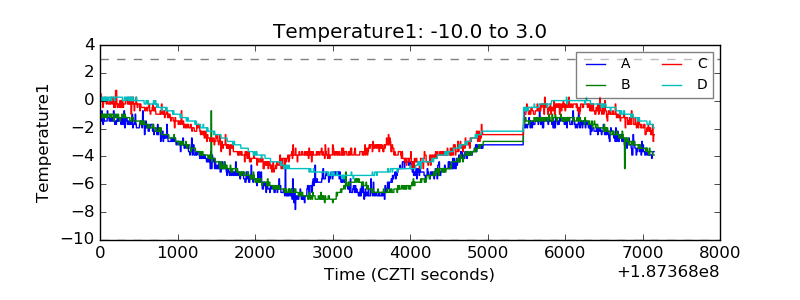 |
| Veto HV Monitor | 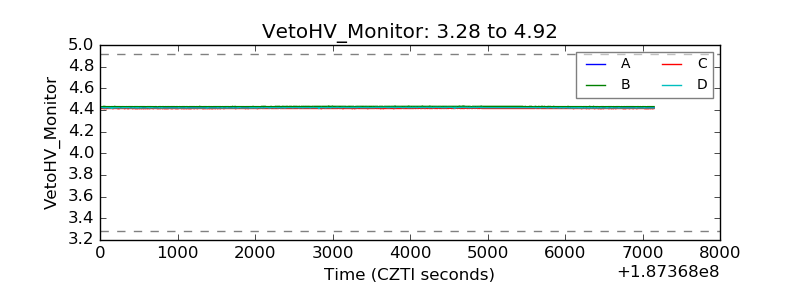 |
| Veto LLD | 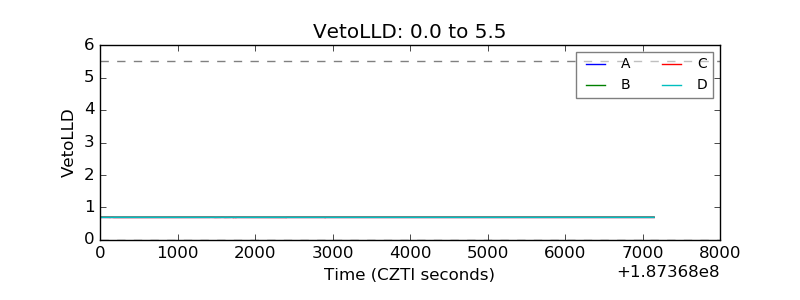 |
| Alpha Counter | 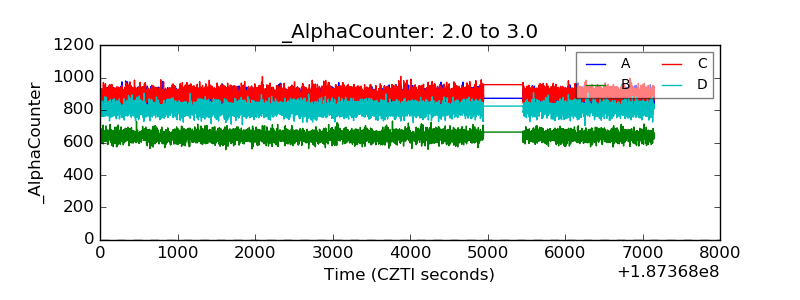 |
| _CPM_Rate | 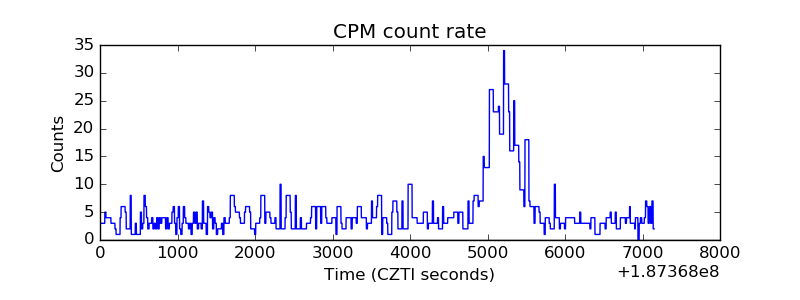 |
| CZT Counter | 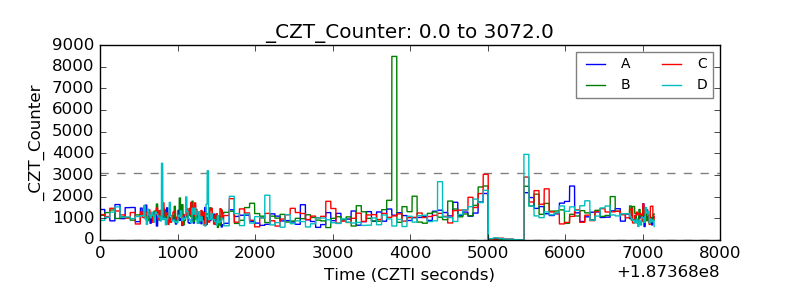 |
| +2.5 Volts monitor |  |
| +5 Volts monitor |  |
| _ROLL_ROT | 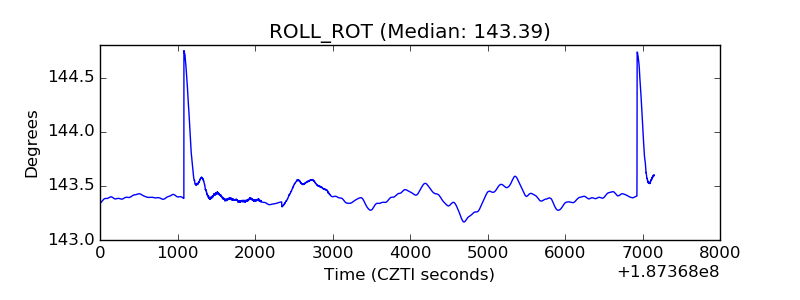 |
| _Roll_DEC | 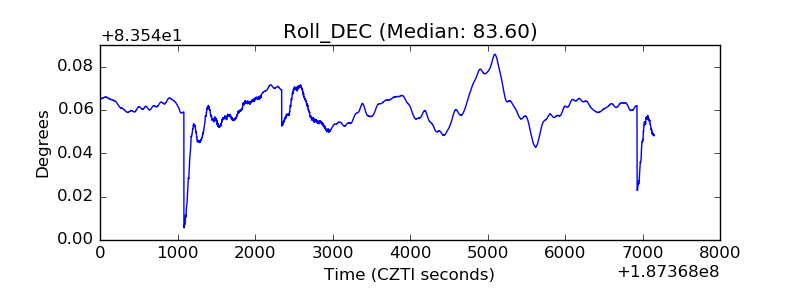 |
| _Roll_RA | 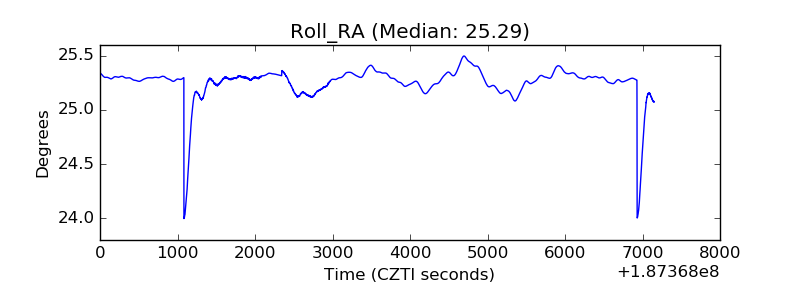 |
| Veto Counter | 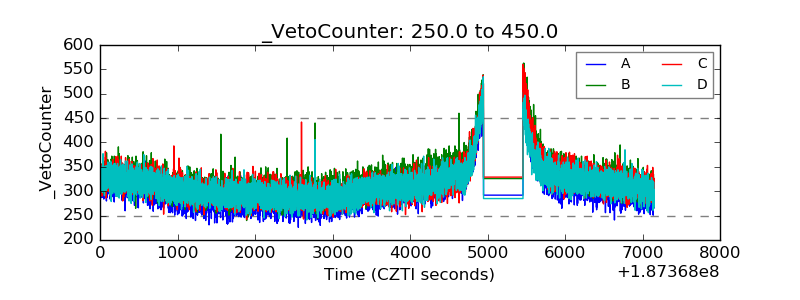 |