| Param | Original file | Final file |
|---|---|---|
| Filename | modeM0/AS1P01_998T02_9000000190_01075cztM0_level2.evt | modeM0/AS1P01_998T02_9000000190_01075cztM0_level2_quad_clean.evt |
| Size (bytes) | 1,202,489,280 | 120,188,160 |
| Size | 1.1 GB | 114.6 MB |
| Events in quadrant A | 8,546,254 | 810,118 |
| Events in quadrant B | 8,969,950 | 814,384 |
| Events in quadrant C | 8,742,935 | 782,436 |
| Events in quadrant D | 9,677,481 | 727,545 |
| Mode M0 | |||
|---|---|---|---|
| Quadrant | BADHDUFLAG | Total packets | Discarded packets |
| A | 0 | 30606 | 1 |
| B | 0 | 31757 | 4 |
| C | 0 | 31127 | 1 |
| D | 0 | 34043 | 1 |
| Mode SS | |||
|---|---|---|---|
| Quadrant | BADHDUFLAG | Total packets | Discarded packets |
| A | 0 | 148 | 0 |
| B | 0 | 148 | 0 |
| C | 0 | 148 | 0 |
| D | 0 | 148 | 0 |
| Mode M9 | |||
|---|---|---|---|
| Quadrant | BADHDUFLAG | Total packets | Discarded packets |
| A | 0 | 2 | 0 |
| B | 0 | 2 | 0 |
| C | 0 | 2 | 0 |
| D | 0 | 2 | 0 |
| Quadrant | Total seconds | Saturated seconds | Saturation percentage |
|---|---|---|---|
| A | 7259 | 8 | 0.110208% |
| B | 7258 | 23 | 0.316892% |
| C | 7258 | 2 | 0.027556% |
| D | 7258 | 646 | 8.900524% |
Noise dominated data is calculated using 1-second bins in cleaned event files. If a bin has >2000 counts, and if more than 50% of those come from <1% of pixels, then it is considered to be noise-dominated and hence unusable.
| Quadrant | # 1 sec bins | Bins with >0 counts | Bins with >2000 counts | High rate bins dominated by noise | Noise dominated (total time) | Noise dominated (detector-on time) | Marked lightcurve |
|---|---|---|---|---|---|---|---|
| A | 7489 | 7260 | 270 | 270 | 3.61% | 3.72% |  |
| B | 7488 | 7259 | 333 | 333 | 4.45% | 4.59% | 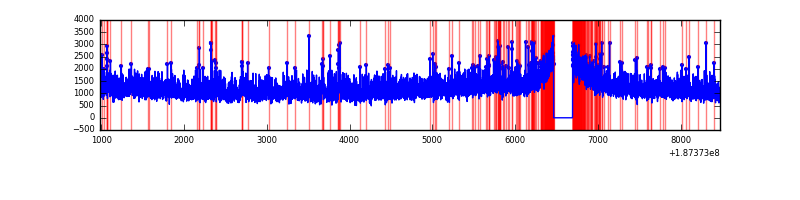 |
| C | 7488 | 7259 | 233 | 233 | 3.11% | 3.21% |  |
| D | 7488 | 7259 | 1014 | 1014 | 13.54% | 13.97% |  |
Top three noisy pixels from each quadrant. If the there are fewer than three noisy pixels in the level2.evt file, extra rows are filled as -1
| Pixel properties | Quadrant properties | ||||||
|---|---|---|---|---|---|---|---|
| Quadrant | DetID | PixID | Counts | Sigma | Mean | Median | Sigma |
| A | 0 | 253 | 77938 | 143.2 | 2202 | 2220 | 528.7 |
| A | 15 | 233 | 19689 | 33.04 | 2202 | 2220 | 528.7 |
| A | 11 | 79 | 8422 | 11.73 | 2202 | 2220 | 528.7 |
| B | 5 | 191 | 122097 | 220.14 | 2299 | 2307 | 544.1 |
| B | 5 | 249 | 39030 | 67.49 | 2299 | 2307 | 544.1 |
| B | 4 | 172 | 24265 | 40.35 | 2299 | 2307 | 544.1 |
| C | 15 | 241 | 370605 | 623.13 | 2115 | 2187 | 591.2 |
| C | 3 | 79 | 48607 | 78.51 | 2115 | 2187 | 591.2 |
| C | 3 | 111 | 36482 | 58.01 | 2115 | 2187 | 591.2 |
| D | 2 | 216 | 681054 | 1112.53 | 2016 | 2051 | 610.3 |
| D | 9 | 64 | 54891 | 86.58 | 2016 | 2051 | 610.3 |
| D | 10 | 125 | 47282 | 74.11 | 2016 | 2051 | 610.3 |
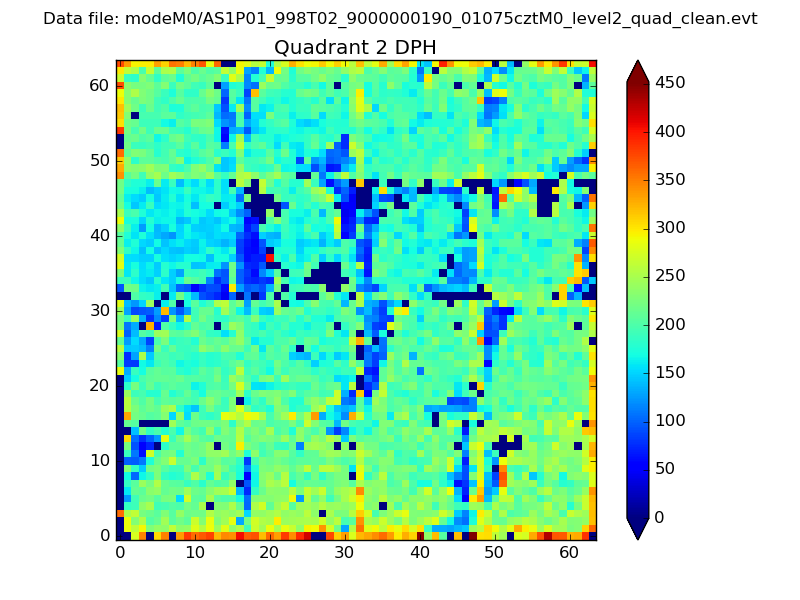
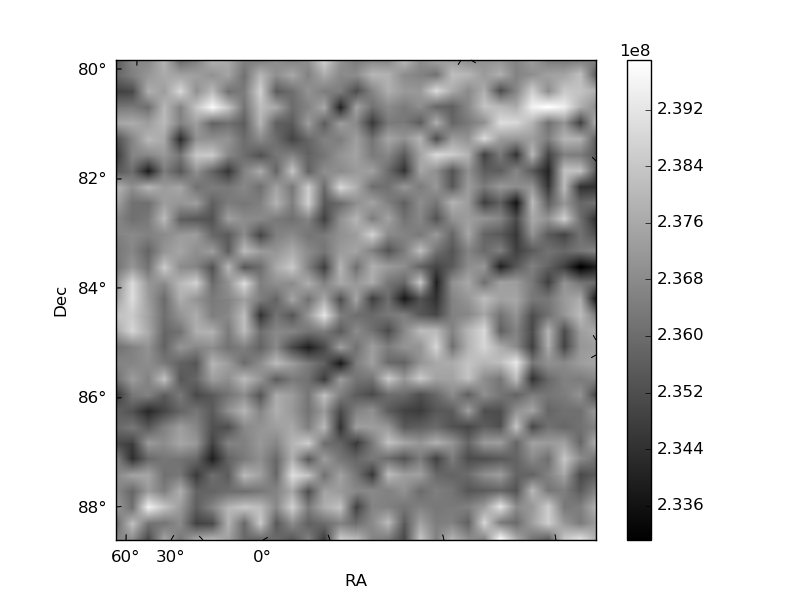
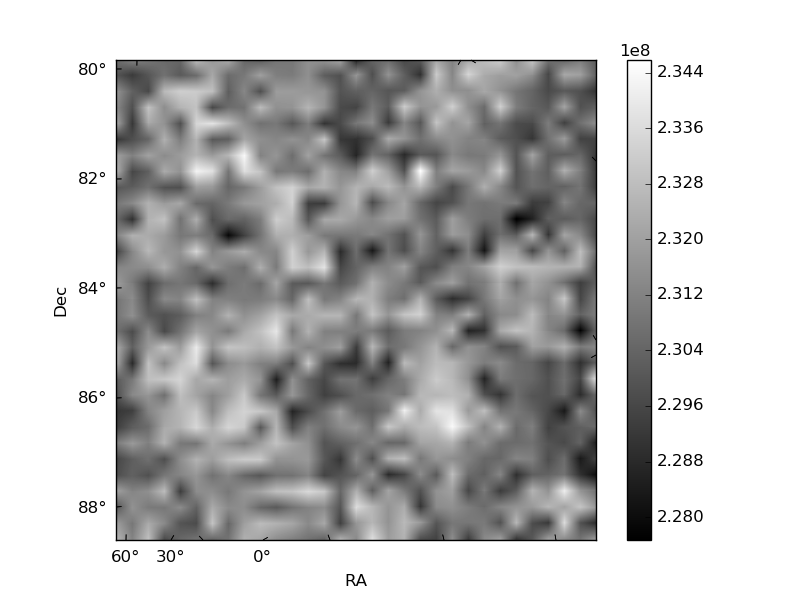
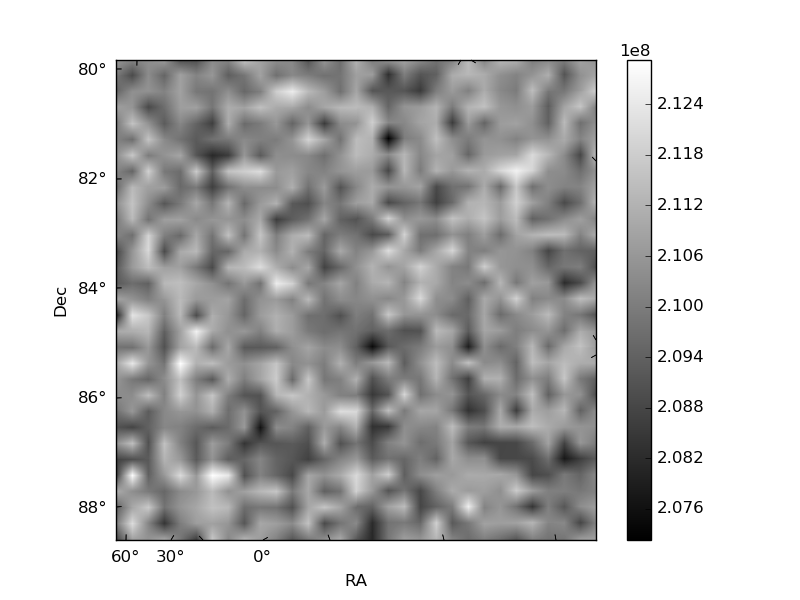
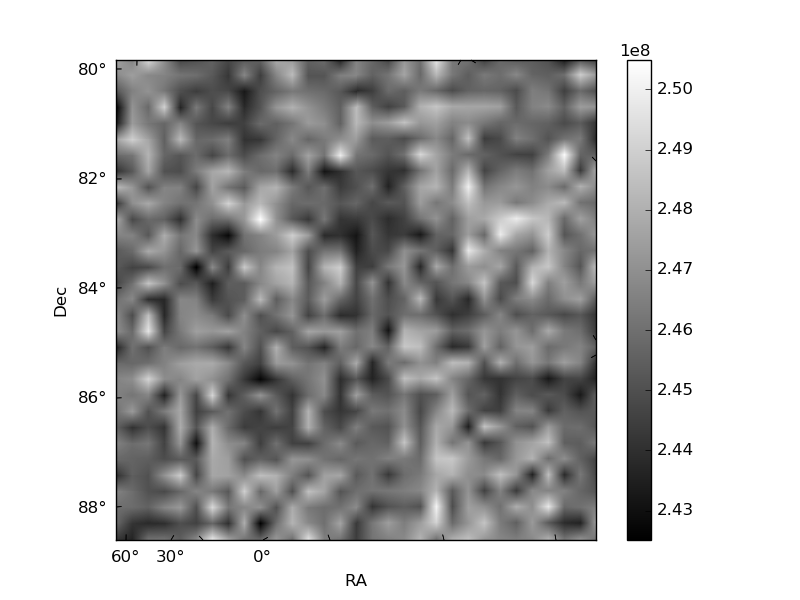
Histogram calculated using DETX and DETY for each event in the final _common_clean file
| Quadrant A | 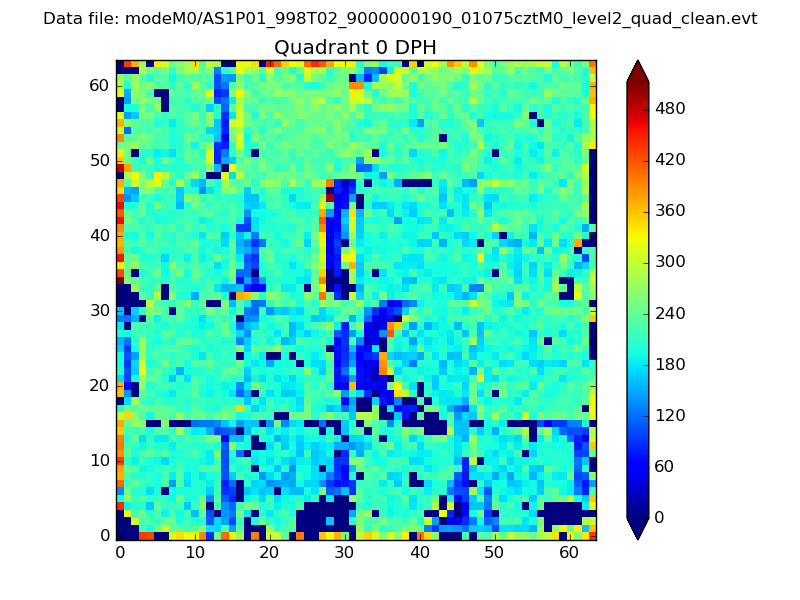 |
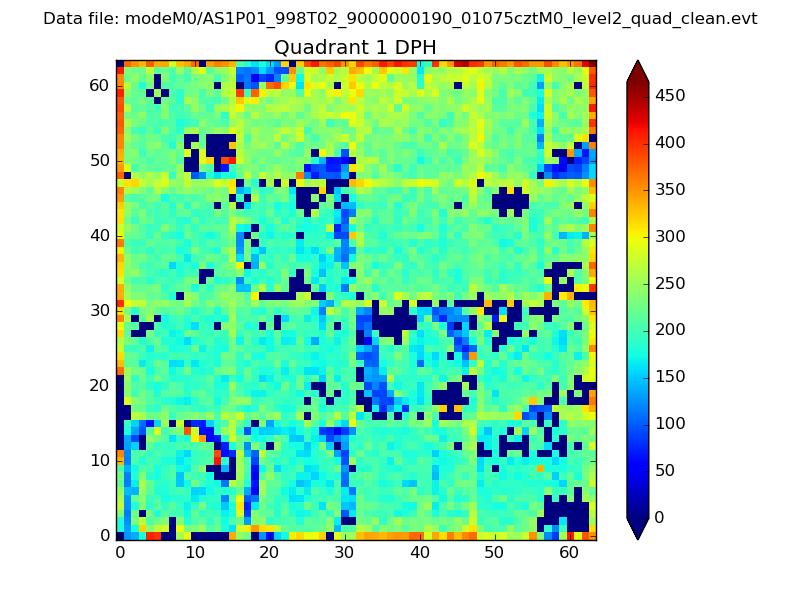 |
Quadrant B |
|---|---|---|---|
| Quadrant D | 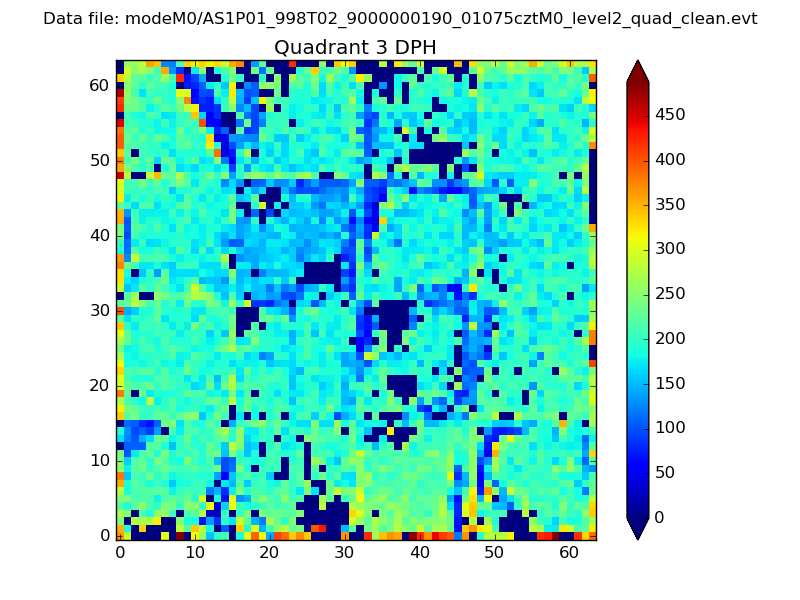 |
 |
Quadrant C |
| Plot type | Count rate plots | Images |
|---|---|---|
| Comparison with Poisson distribution Blue bars denote a histogram of data divided into 1 sec bins. Red curve is a Poisson curve with rate = median count rate of data. |
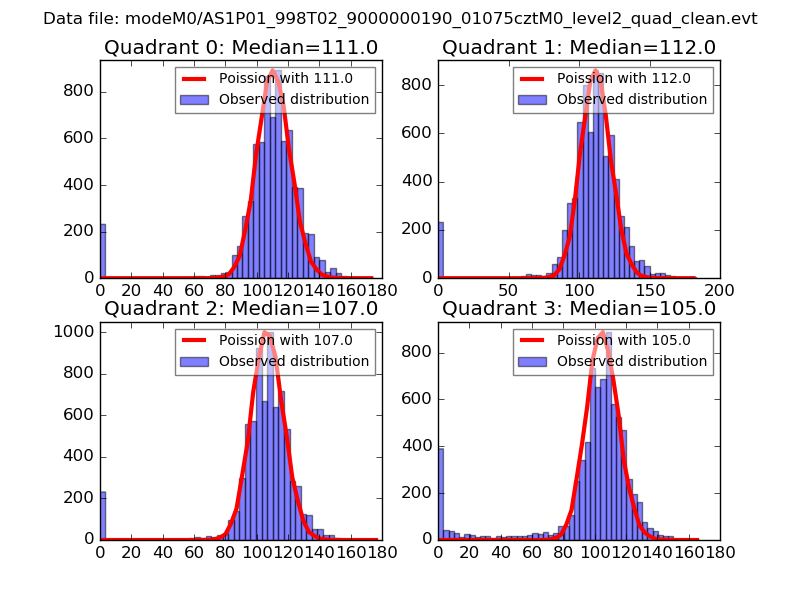 |
 |
| Quadrant-wise count rates Data is divided into 100 sec bins |
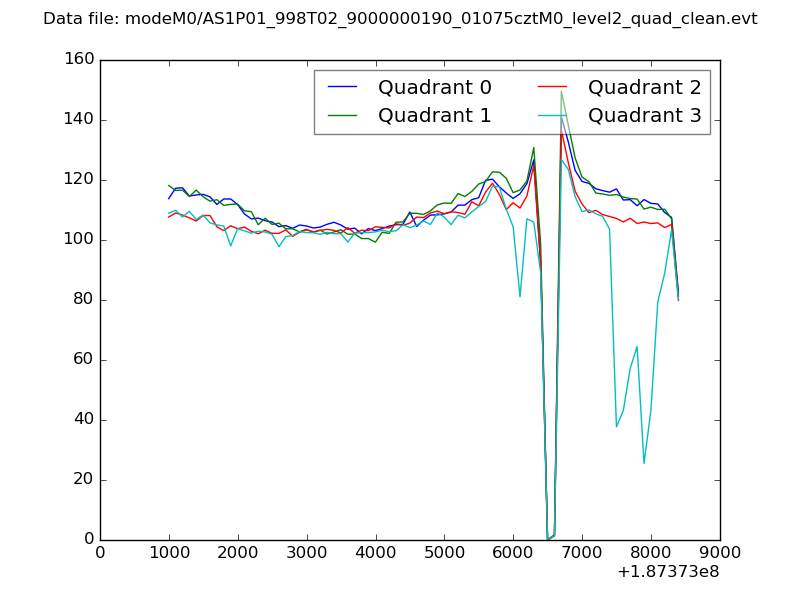 |
|
| Module-wise count rates for Quadrant A Data is divided into 100 sec bins |
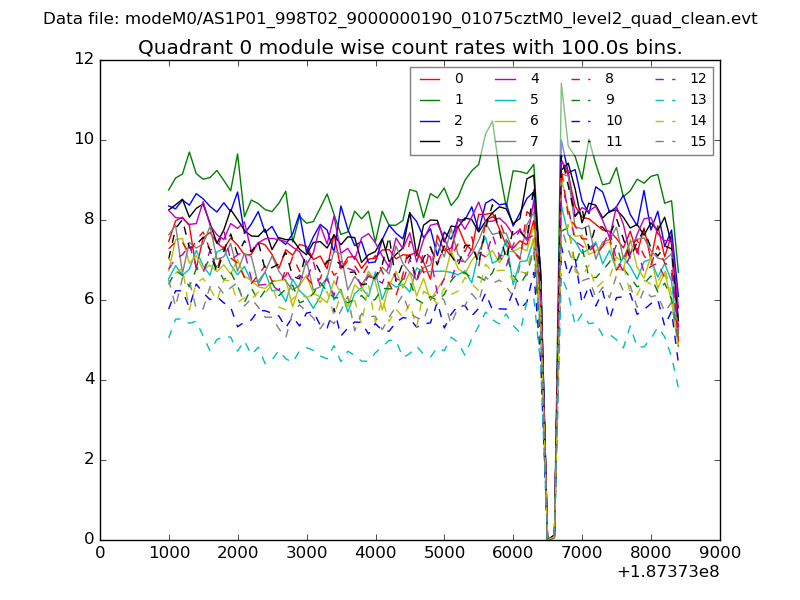 |
 |
| Module-wise count rates for Quadrant B Data is divided into 100 sec bins |
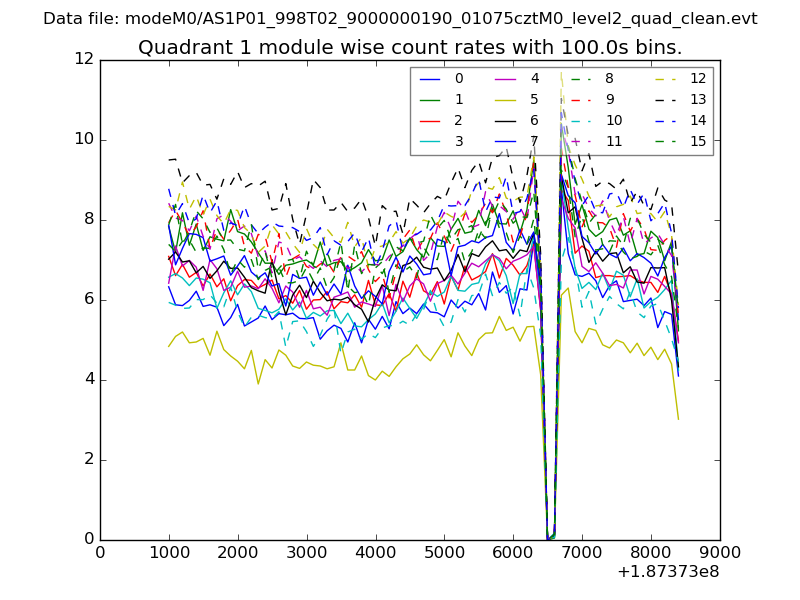 |
 |
| Module-wise count rates for Quadrant C Data is divided into 100 sec bins |
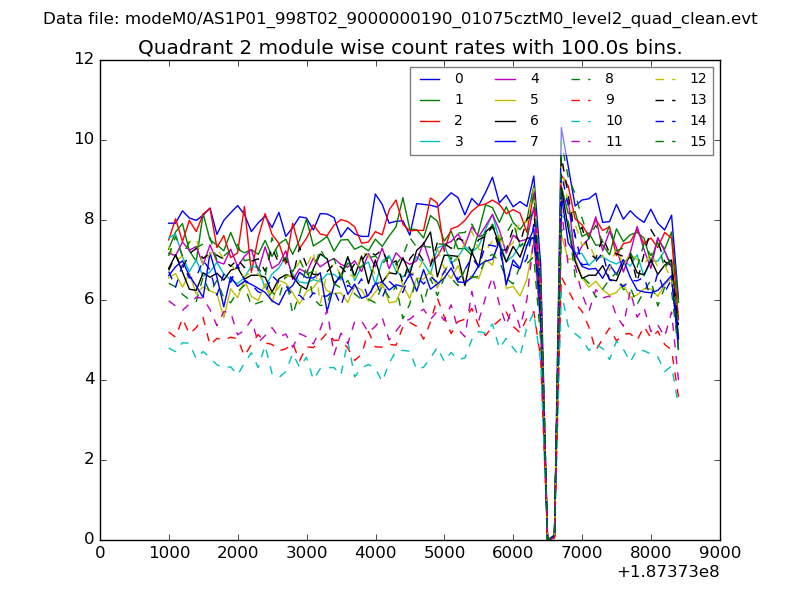 |
 |
| Module-wise count rates for Quadrant D Data is divided into 100 sec bins |
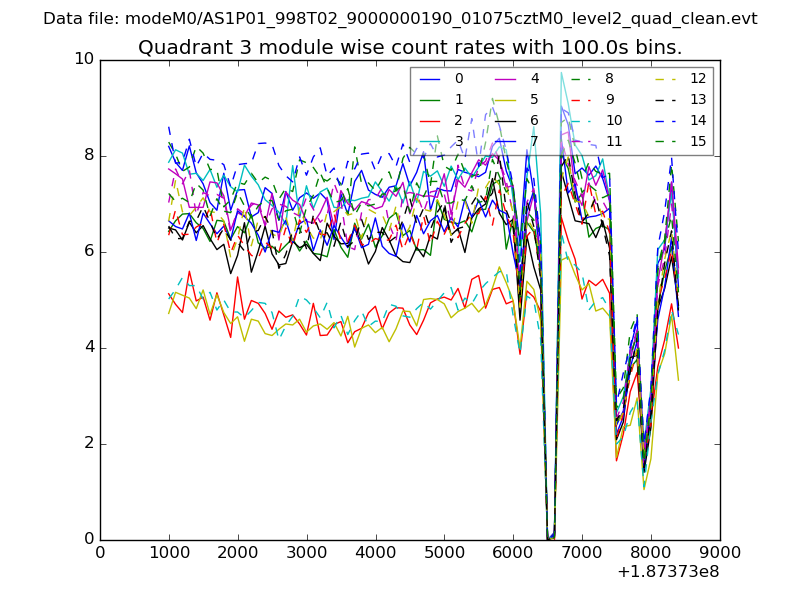 |
 |
| Parameter | Plot |
|---|---|
| CZT HV Monitor | 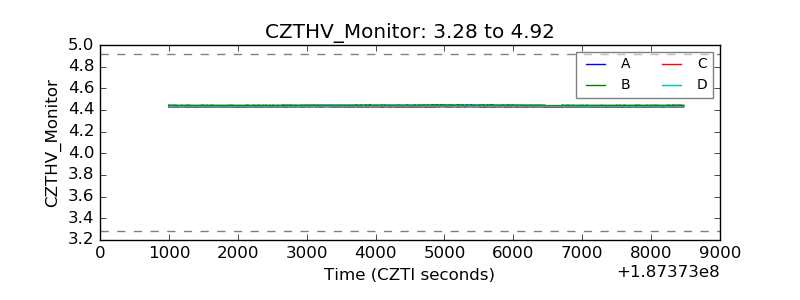 |
| D_VDD | 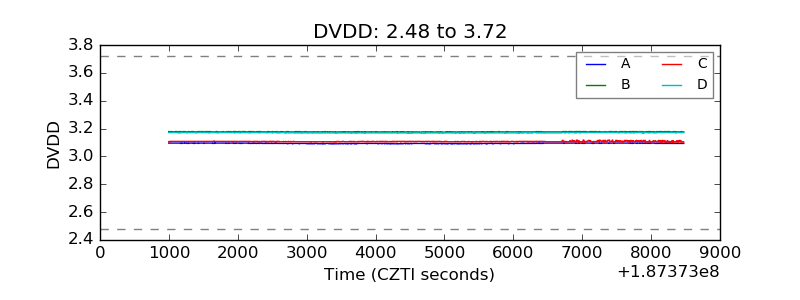 |
| Temperature 1 | 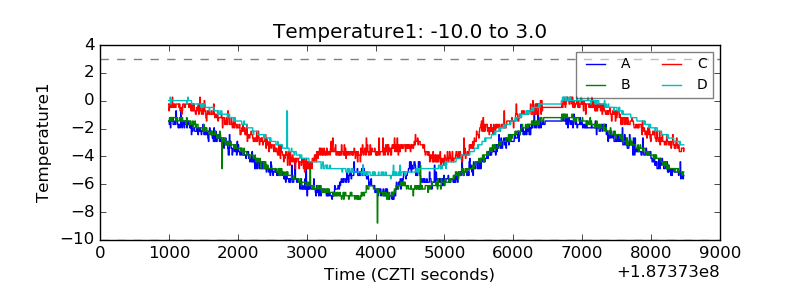 |
| Veto HV Monitor | 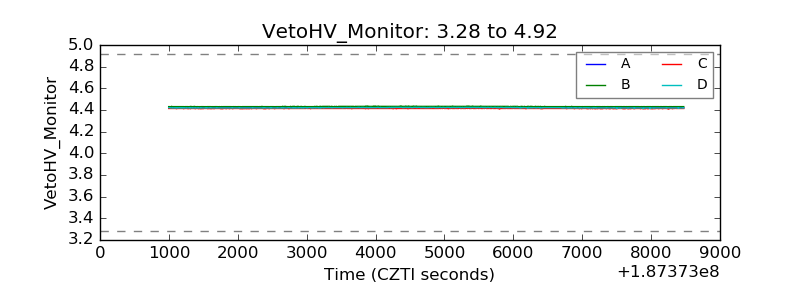 |
| Veto LLD | 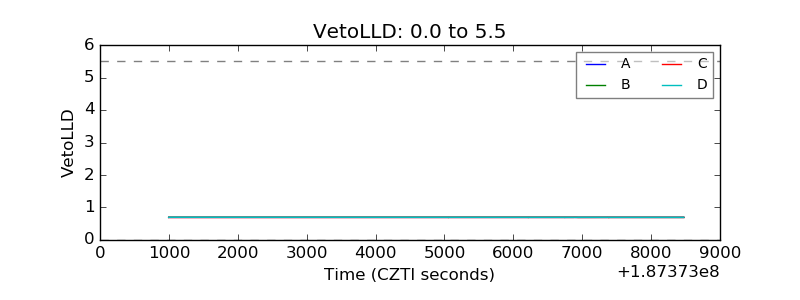 |
| Alpha Counter | 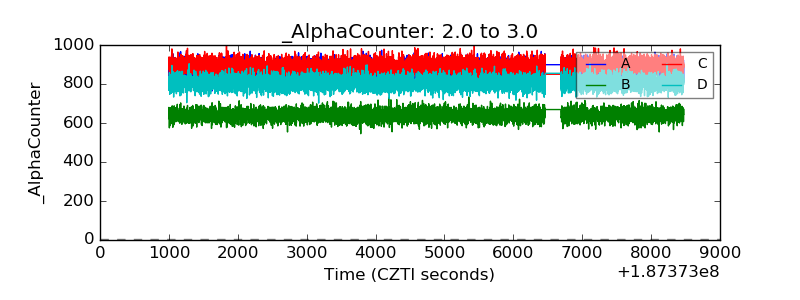 |
| _CPM_Rate | 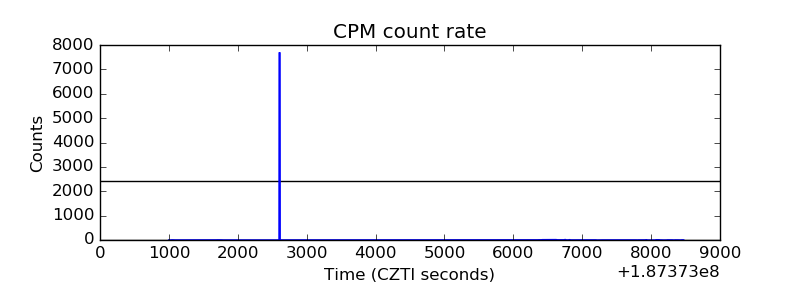 |
| CZT Counter | 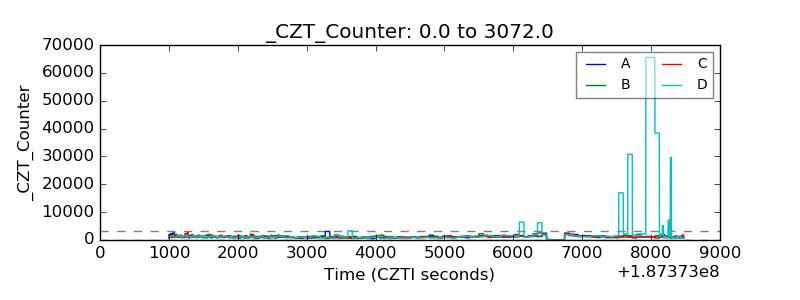 |
| +2.5 Volts monitor |  |
| +5 Volts monitor |  |
| _ROLL_ROT | 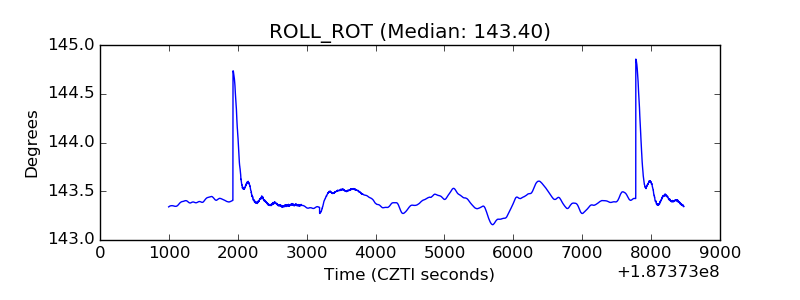 |
| _Roll_DEC | 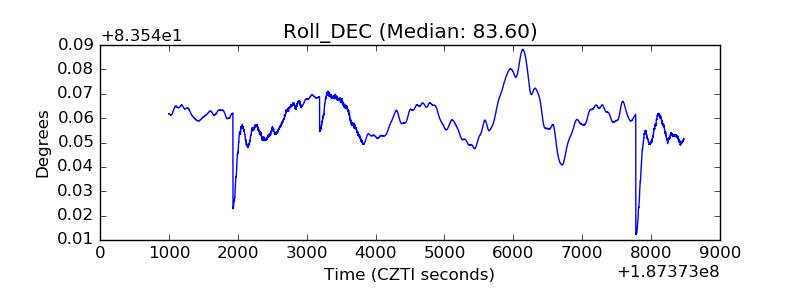 |
| _Roll_RA | 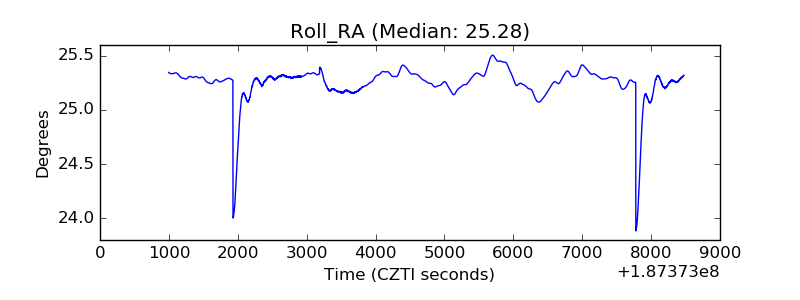 |
| Veto Counter | 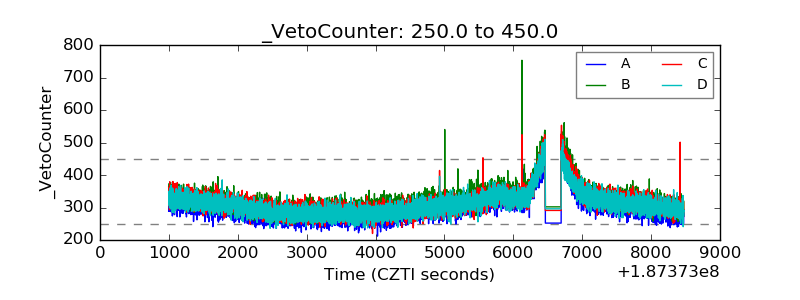 |