| Param | Original file | Final file |
|---|---|---|
| Filename | modeM0/AS1P01_998T02_9000000190_01076cztM0_level2.evt | modeM0/AS1P01_998T02_9000000190_01076cztM0_level2_quad_clean.evt |
| Size (bytes) | 1,231,966,080 | 123,079,680 |
| Size | 1.1 GB | 117.4 MB |
| Events in quadrant A | 8,773,635 | 827,975 |
| Events in quadrant B | 9,340,353 | 830,640 |
| Events in quadrant C | 9,036,028 | 803,586 |
| Events in quadrant D | 9,668,359 | 748,385 |
| Mode M0 | |||
|---|---|---|---|
| Quadrant | BADHDUFLAG | Total packets | Discarded packets |
| A | 0 | 31306 | 1 |
| B | 0 | 33036 | 1 |
| C | 0 | 32098 | 1 |
| D | 0 | 34109 | 1 |
| Mode SS | |||
|---|---|---|---|
| Quadrant | BADHDUFLAG | Total packets | Discarded packets |
| A | 0 | 152 | 0 |
| B | 0 | 152 | 0 |
| C | 0 | 152 | 0 |
| D | 0 | 152 | 0 |
| Mode M9 | |||
|---|---|---|---|
| Quadrant | BADHDUFLAG | Total packets | Discarded packets |
| A | 0 | 2 | 0 |
| B | 0 | 2 | 0 |
| C | 0 | 2 | 0 |
| D | 0 | 2 | 0 |
| Quadrant | Total seconds | Saturated seconds | Saturation percentage |
|---|---|---|---|
| A | 7424 | 2 | 0.026940% |
| B | 7424 | 46 | 0.619612% |
| C | 7424 | 5 | 0.067349% |
| D | 7424 | 586 | 7.893319% |
Noise dominated data is calculated using 1-second bins in cleaned event files. If a bin has >2000 counts, and if more than 50% of those come from <1% of pixels, then it is considered to be noise-dominated and hence unusable.
| Quadrant | # 1 sec bins | Bins with >0 counts | Bins with >2000 counts | High rate bins dominated by noise | Noise dominated (total time) | Noise dominated (detector-on time) | Marked lightcurve |
|---|---|---|---|---|---|---|---|
| A | 7669 | 7424 | 223 | 223 | 2.91% | 3.00% | 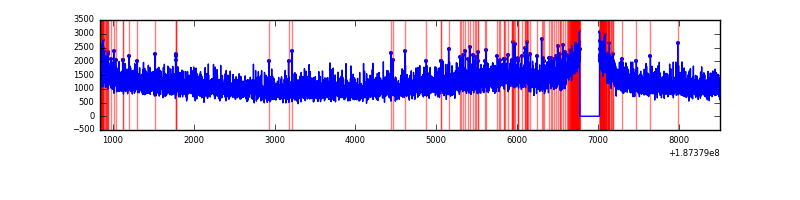 |
| B | 7669 | 7424 | 378 | 378 | 4.93% | 5.09% | 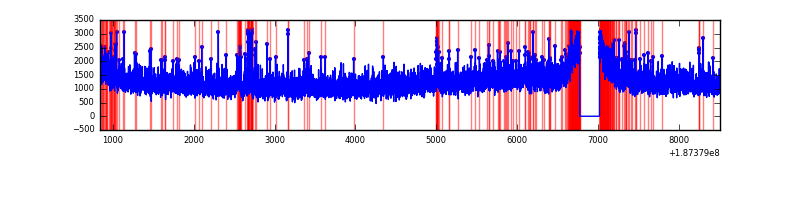 |
| C | 7669 | 7424 | 252 | 252 | 3.29% | 3.39% | 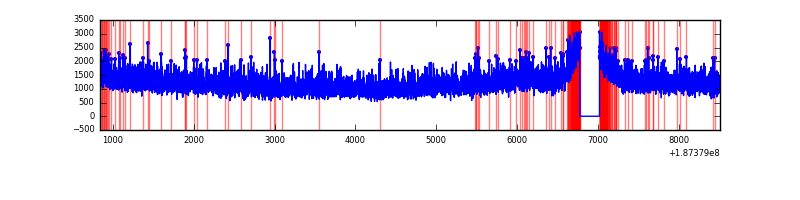 |
| D | 7668 | 7423 | 894 | 894 | 11.66% | 12.04% | 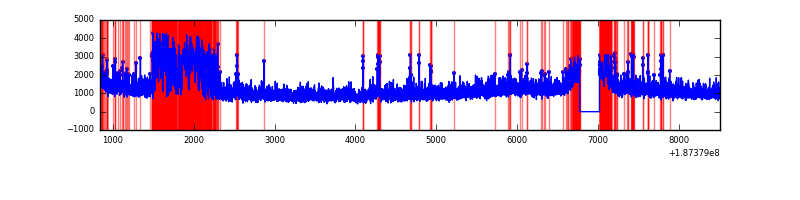 |
Top three noisy pixels from each quadrant. If the there are fewer than three noisy pixels in the level2.evt file, extra rows are filled as -1
| Pixel properties | Quadrant properties | ||||||
|---|---|---|---|---|---|---|---|
| Quadrant | DetID | PixID | Counts | Sigma | Mean | Median | Sigma |
| A | 13 | 34 | 53180 | 93.45 | 2269 | 2283 | 544.7 |
| A | 0 | 253 | 10022 | 14.21 | 2269 | 2283 | 544.7 |
| A | 11 | 79 | 9782 | 13.77 | 2269 | 2283 | 544.7 |
| B | 5 | 191 | 201729 | 355.66 | 2364 | 2371 | 560.5 |
| B | 15 | 22 | 68369 | 117.74 | 2364 | 2371 | 560.5 |
| B | 4 | 172 | 43313 | 73.04 | 2364 | 2371 | 560.5 |
| C | 15 | 241 | 384155 | 629.12 | 2176 | 2252 | 607.0 |
| C | 3 | 79 | 46541 | 72.96 | 2176 | 2252 | 607.0 |
| C | 3 | 111 | 39437 | 61.26 | 2176 | 2252 | 607.0 |
| D | 2 | 216 | 275224 | 432.43 | 2095 | 2136 | 631.5 |
| D | 10 | 125 | 119344 | 185.6 | 2095 | 2136 | 631.5 |
| D | 9 | 64 | 82017 | 126.49 | 2095 | 2136 | 631.5 |
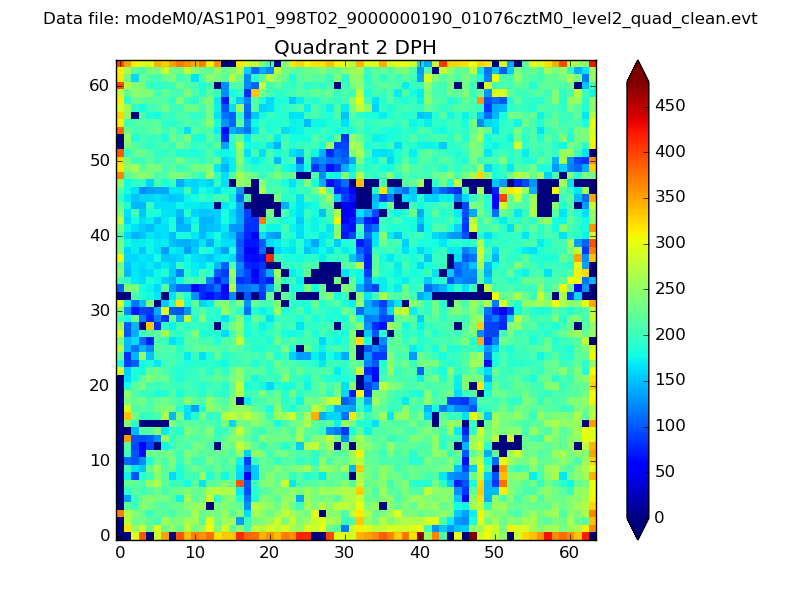
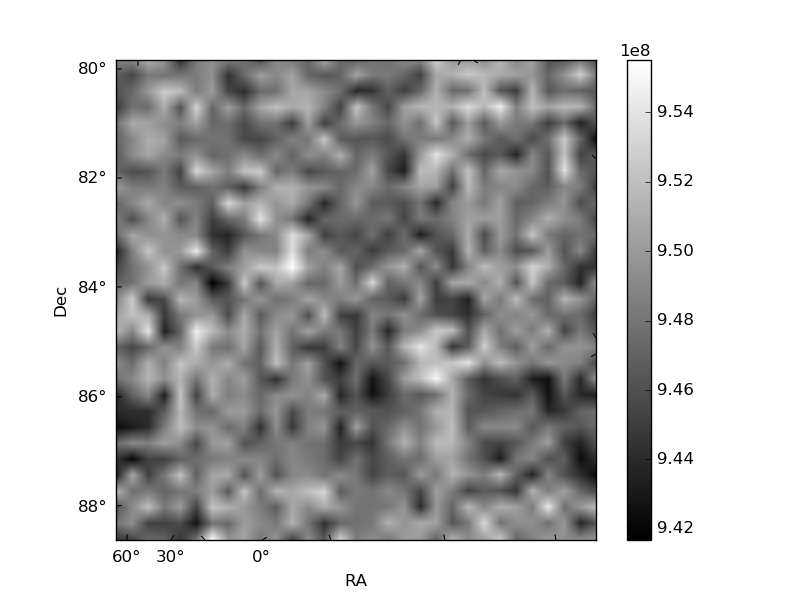
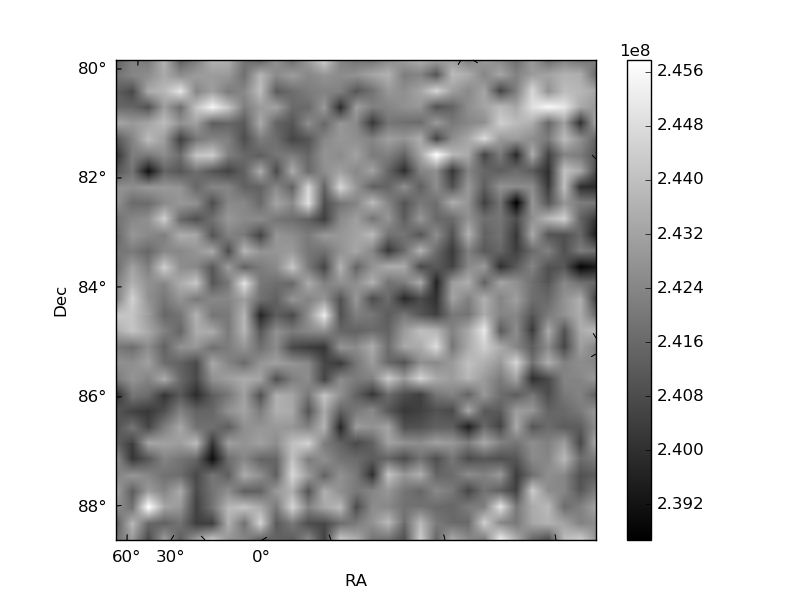
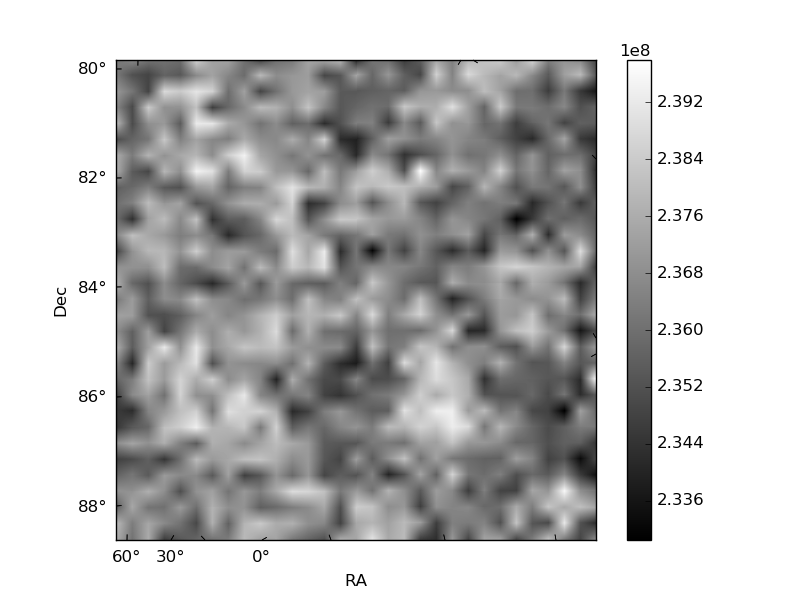
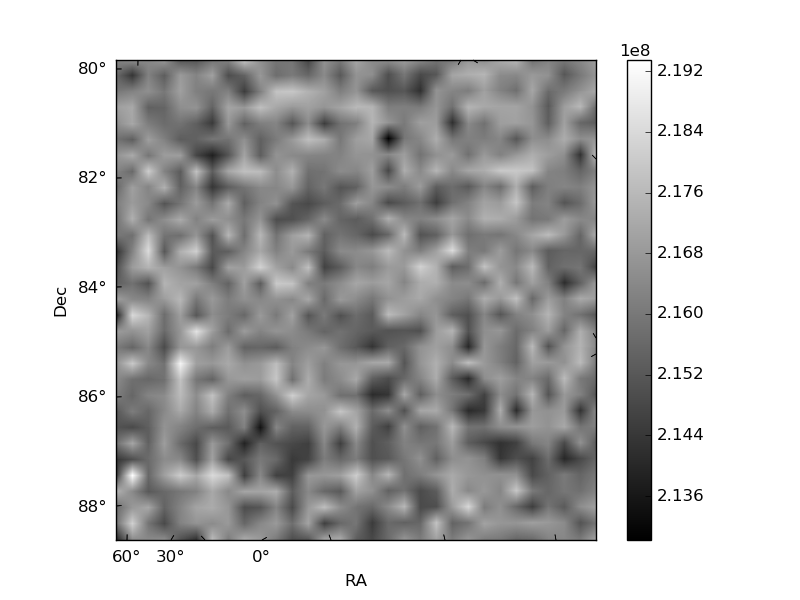
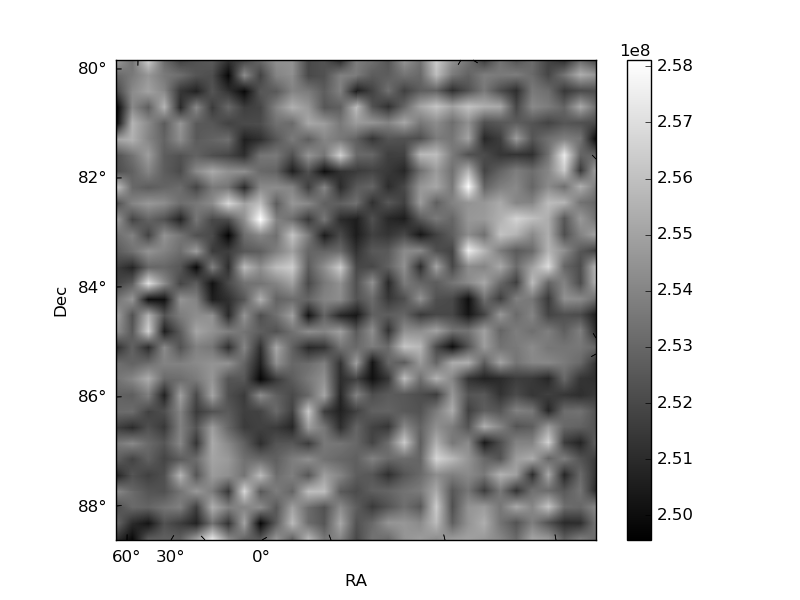
Histogram calculated using DETX and DETY for each event in the final _common_clean file
| Quadrant A | 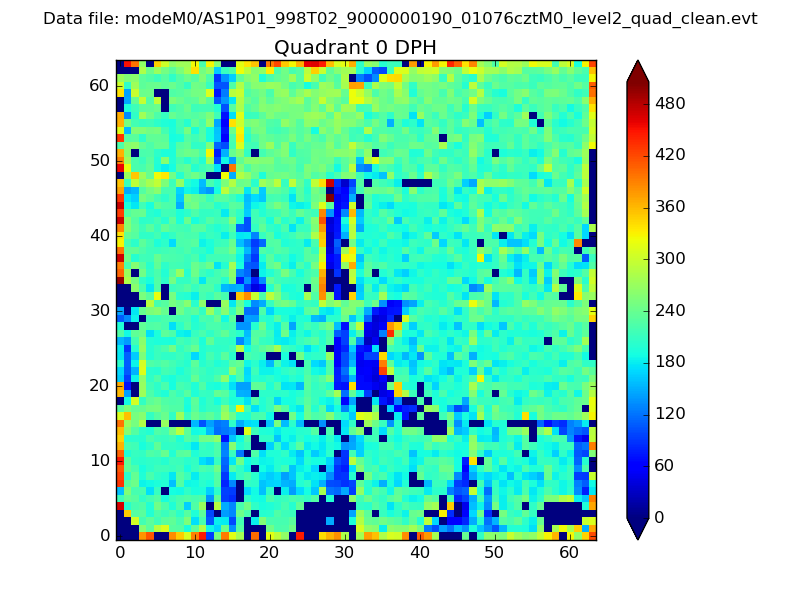 |
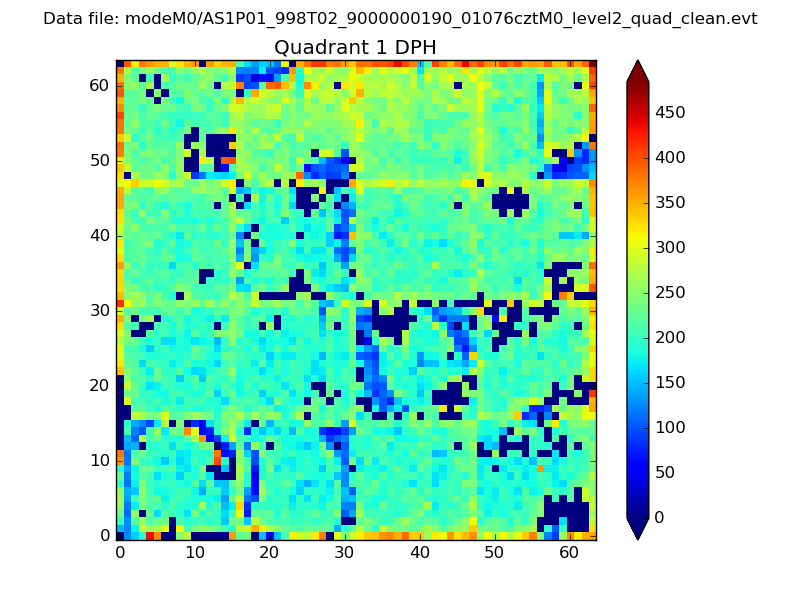 |
Quadrant B |
|---|---|---|---|
| Quadrant D | 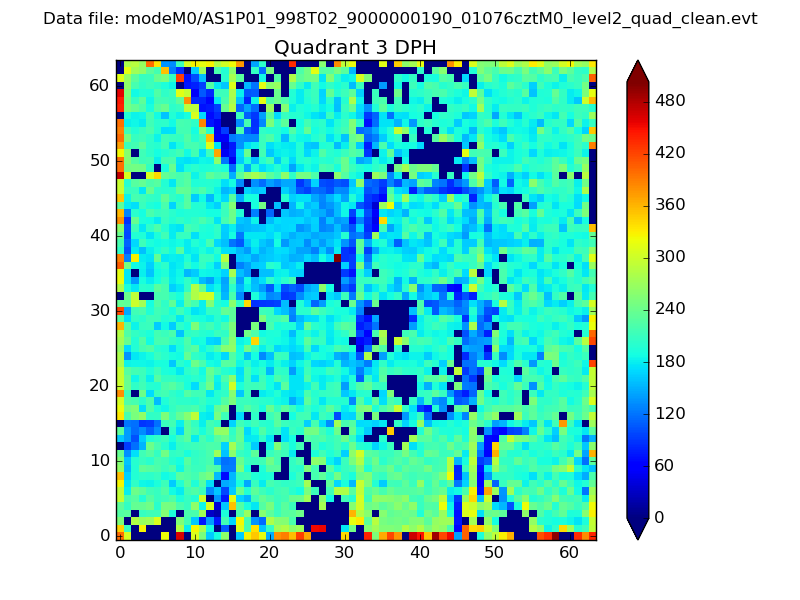 |
 |
Quadrant C |
| Plot type | Count rate plots | Images |
|---|---|---|
| Comparison with Poisson distribution Blue bars denote a histogram of data divided into 1 sec bins. Red curve is a Poisson curve with rate = median count rate of data. |
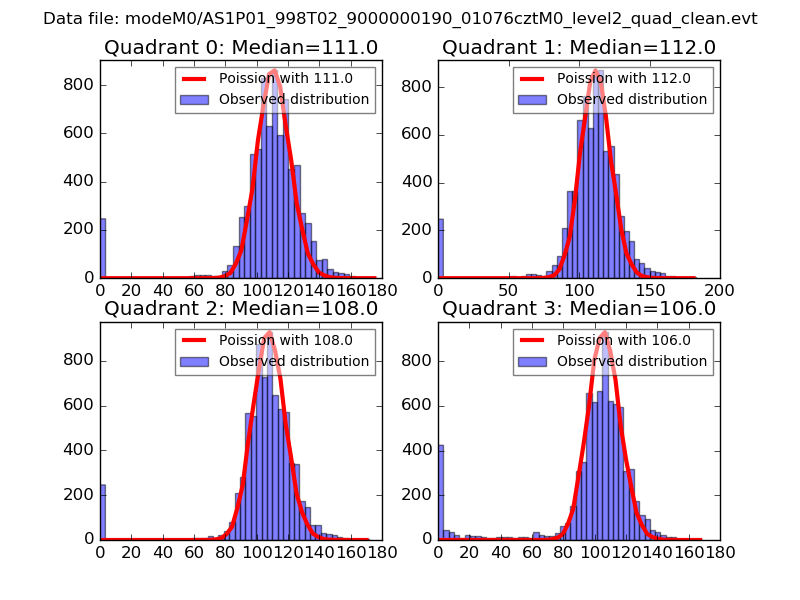 |
 |
| Quadrant-wise count rates Data is divided into 100 sec bins |
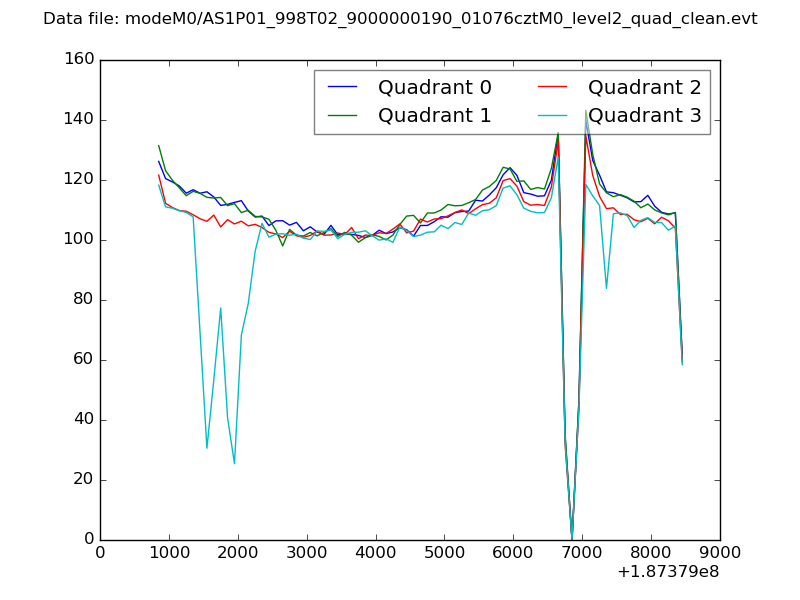 |
|
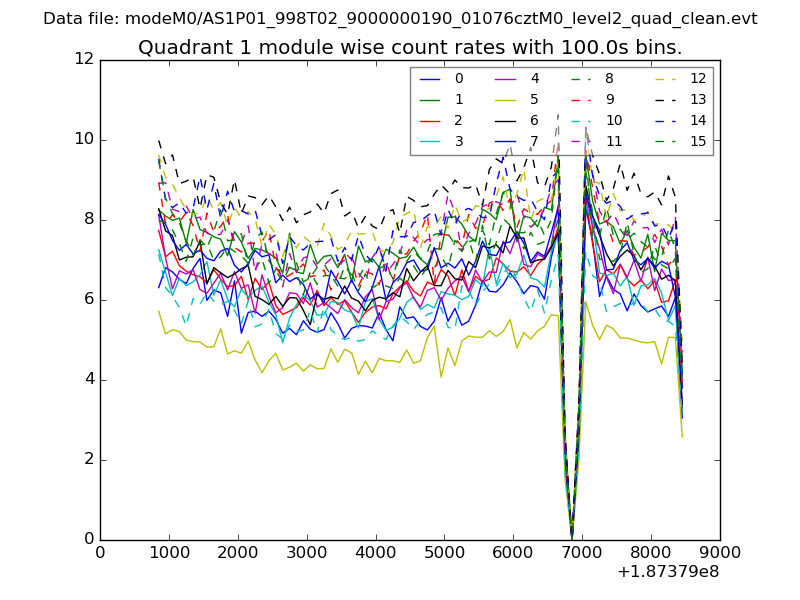
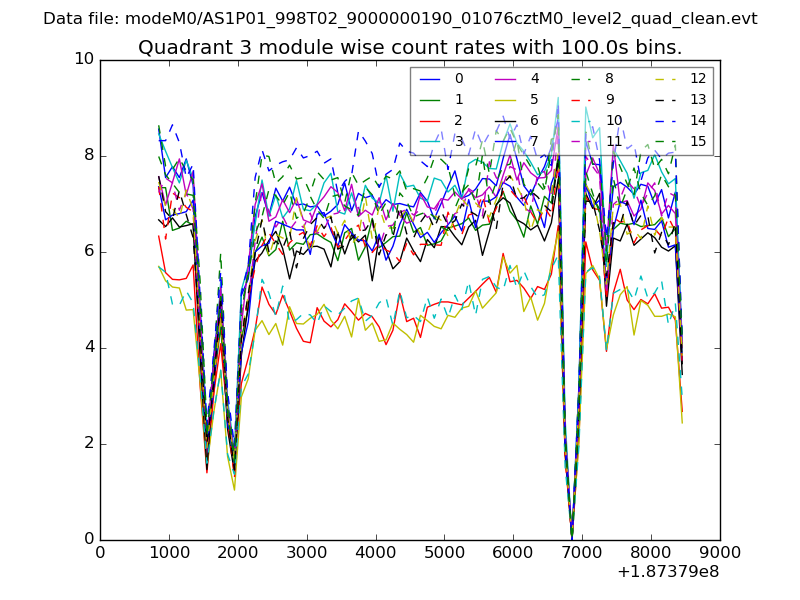
| Module-wise count rates for Quadrant A Data is divided into 100 sec bins |
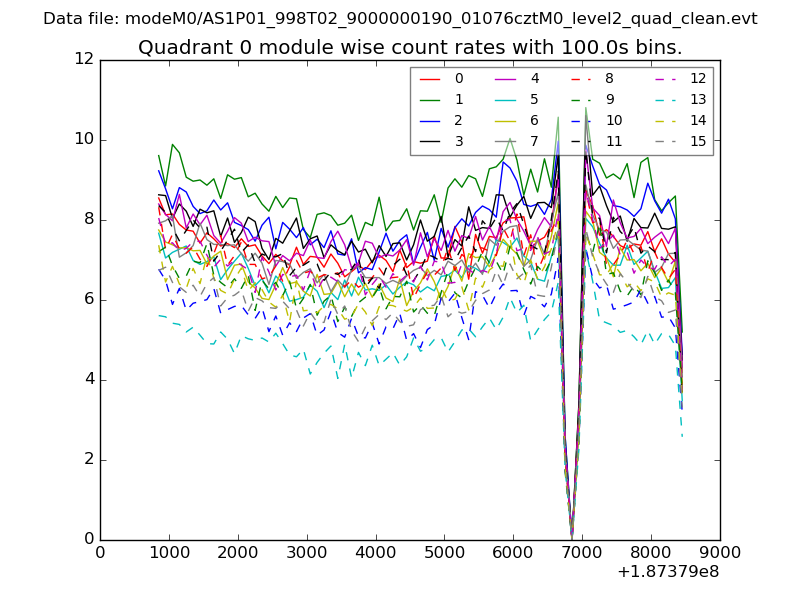 |
 |
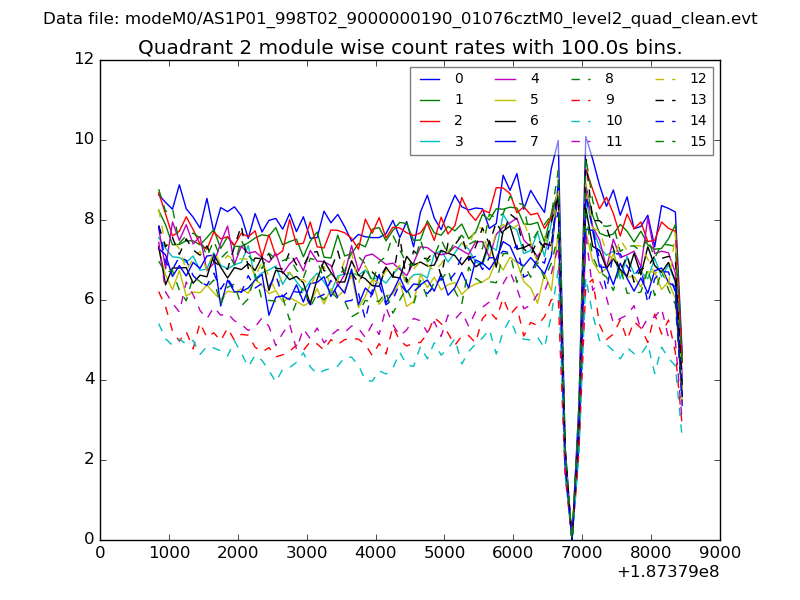
| Module-wise count rates for Quadrant B Data is divided into 100 sec bins |
 |
 |
| Module-wise count rates for Quadrant C Data is divided into 100 sec bins |
 |
 |
| Module-wise count rates for Quadrant D Data is divided into 100 sec bins |
 |
 |
| Parameter | Plot |
|---|---|
| CZT HV Monitor | 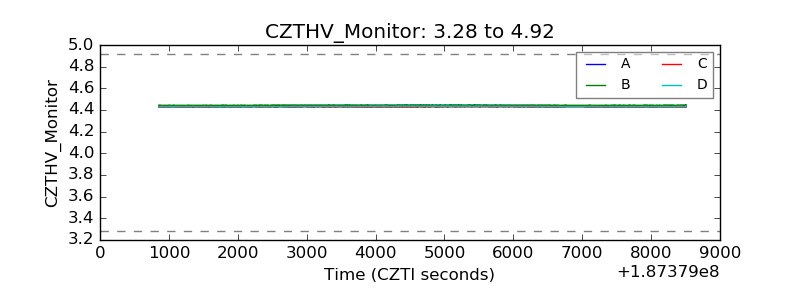 |
| D_VDD | 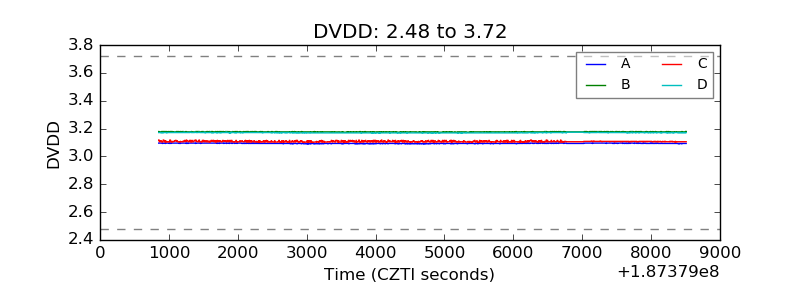 |
| Temperature 1 | 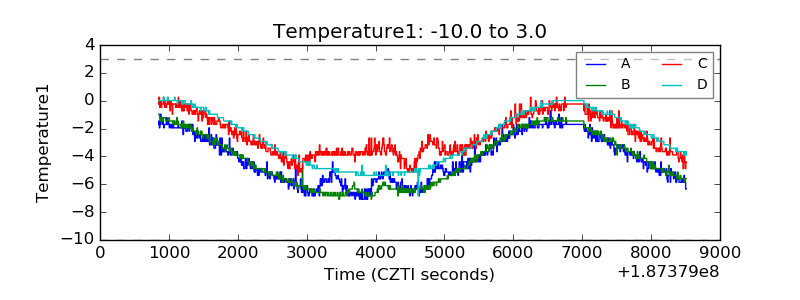 |
| Veto HV Monitor | 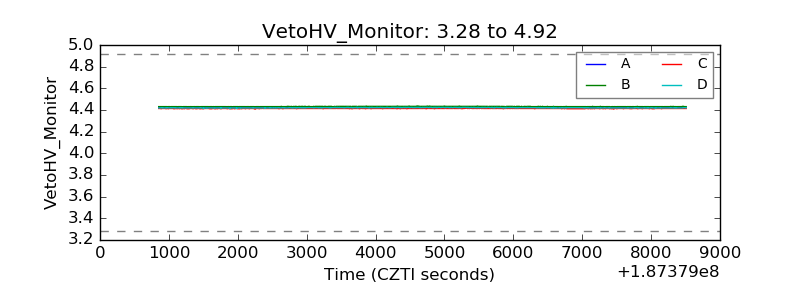 |
| Veto LLD | 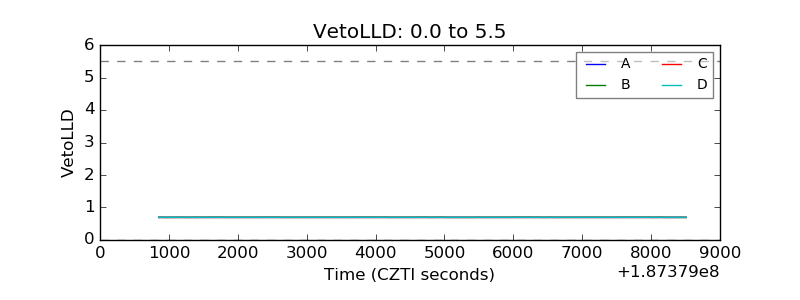 |
| Alpha Counter | 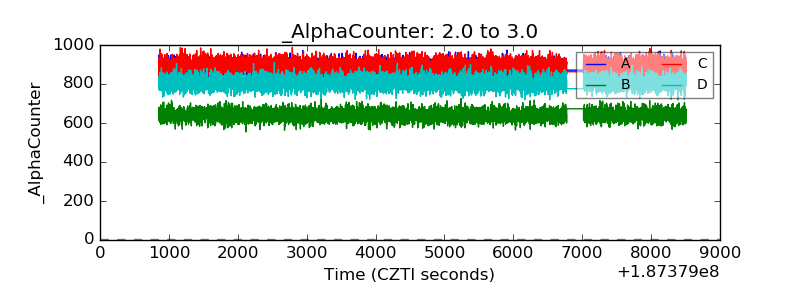 |
| _CPM_Rate | 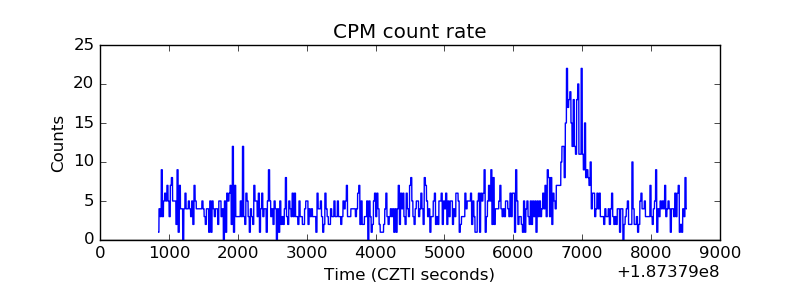 |
| CZT Counter | 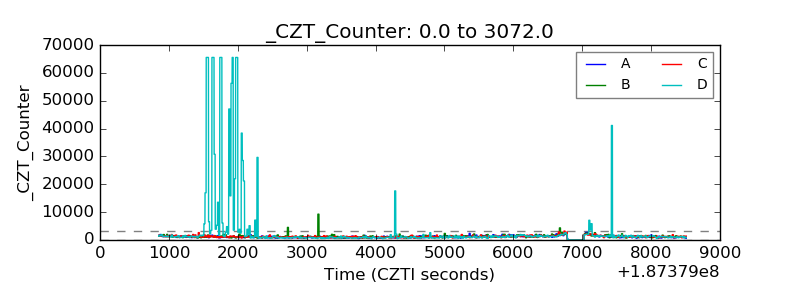 |
| +2.5 Volts monitor | 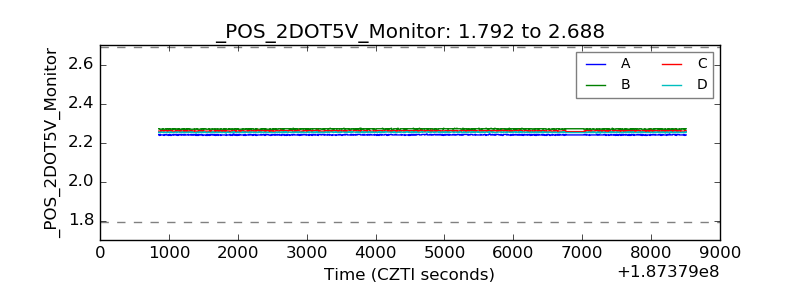 |
| +5 Volts monitor | 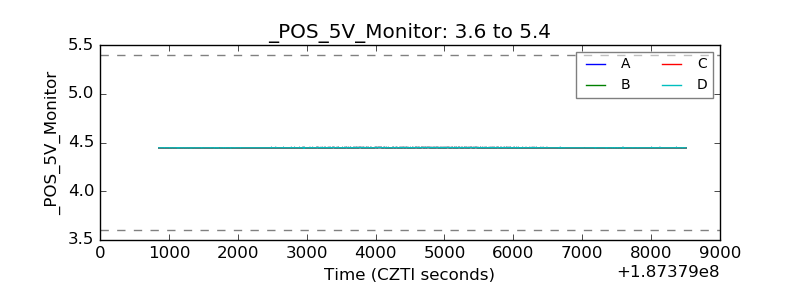 |
| _ROLL_ROT | 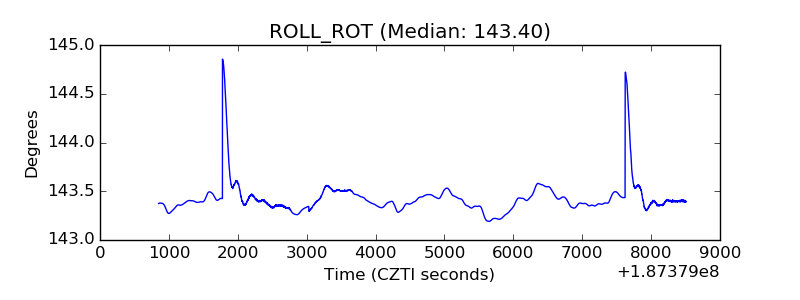 |
| _Roll_DEC | 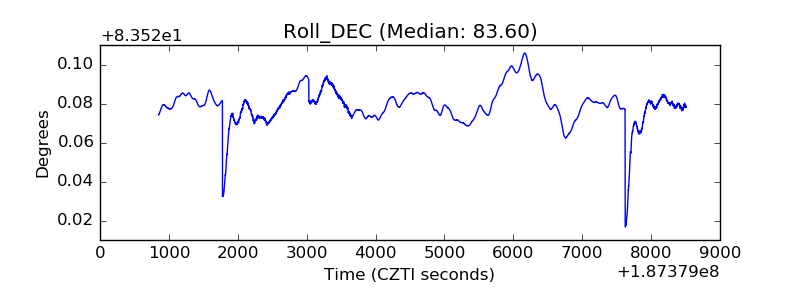 |
| _Roll_RA | 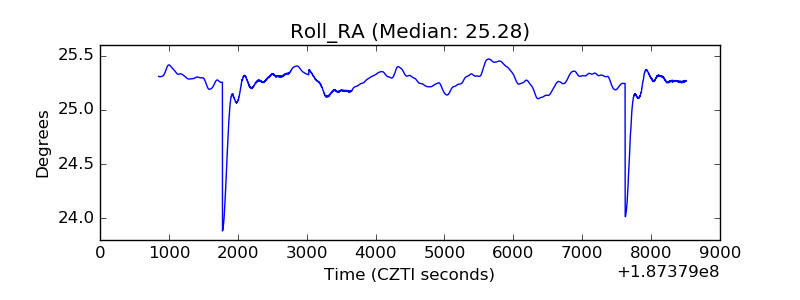 |
| Veto Counter | 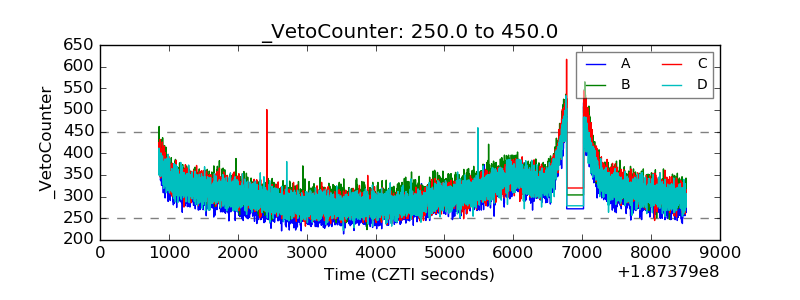 |