| Param | Original file | Final file |
|---|---|---|
| Filename | modeM0/AS1P01_998T02_9000000190_01077cztM0_level2.evt | modeM0/AS1P01_998T02_9000000190_01077cztM0_level2_quad_clean.evt |
| Size (bytes) | 361,169,280 | 36,120,960 |
| Size | 344.4 MB | 34.4 MB |
| Events in quadrant A | 2,567,794 | 239,308 |
| Events in quadrant B | 2,784,144 | 241,339 |
| Events in quadrant C | 2,793,731 | 232,473 |
| Events in quadrant D | 2,652,274 | 229,374 |
| Mode M0 | |||
|---|---|---|---|
| Quadrant | BADHDUFLAG | Total packets | Discarded packets |
| A | 0 | 9098 | 1 |
| B | 0 | 9747 | 1 |
| C | 0 | 9784 | 2 |
| D | 0 | 9355 | 1 |
| Mode SS | |||
|---|---|---|---|
| Quadrant | BADHDUFLAG | Total packets | Discarded packets |
| A | 0 | 42 | 0 |
| B | 0 | 42 | 0 |
| C | 0 | 42 | 0 |
| D | 0 | 42 | 0 |
| Mode M9 | |||
|---|---|---|---|
| Quadrant | BADHDUFLAG | Total packets | Discarded packets |
| A | 0 | 5 | 0 |
| B | 0 | 5 | 0 |
| C | 0 | 5 | 0 |
| D | 0 | 5 | 0 |
| Quadrant | Total seconds | Saturated seconds | Saturation percentage |
|---|---|---|---|
| A | 2086 | 3 | 0.143816% |
| B | 2086 | 9 | 0.431448% |
| C | 2085 | 4 | 0.191847% |
| D | 2086 | 10 | 0.479386% |
Noise dominated data is calculated using 1-second bins in cleaned event files. If a bin has >2000 counts, and if more than 50% of those come from <1% of pixels, then it is considered to be noise-dominated and hence unusable.
| Quadrant | # 1 sec bins | Bins with >0 counts | Bins with >2000 counts | High rate bins dominated by noise | Noise dominated (total time) | Noise dominated (detector-on time) | Marked lightcurve |
|---|---|---|---|---|---|---|---|
| A | 2541 | 2087 | 75 | 75 | 2.95% | 3.59% | 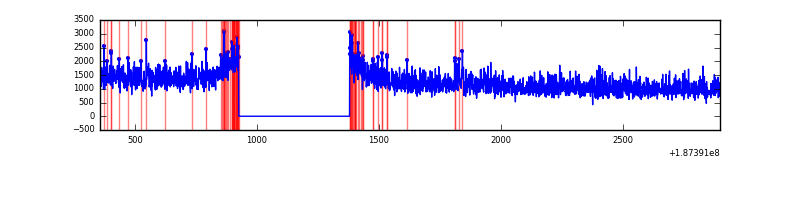 |
| B | 2541 | 2087 | 150 | 150 | 5.90% | 7.19% | 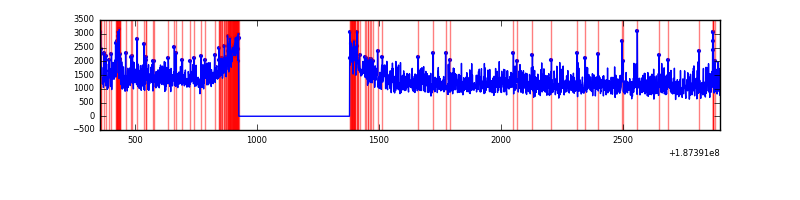 |
| C | 2540 | 2085 | 118 | 118 | 4.65% | 5.66% | 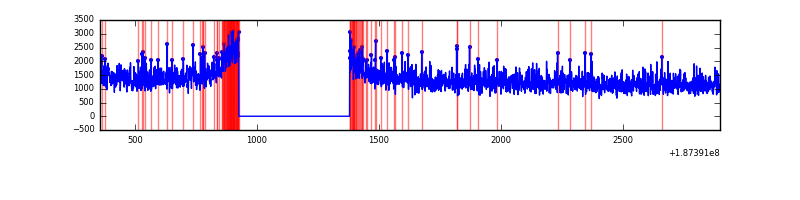 |
| D | 2541 | 2087 | 98 | 98 | 3.86% | 4.70% | 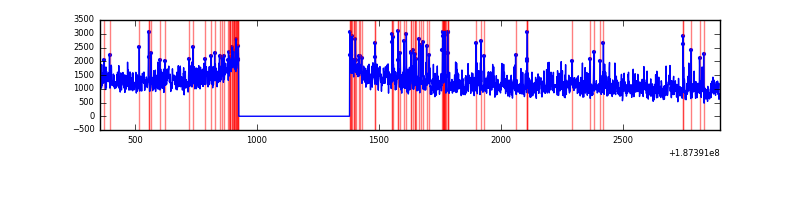 |
Top three noisy pixels from each quadrant. If the there are fewer than three noisy pixels in the level2.evt file, extra rows are filled as -1
| Pixel properties | Quadrant properties | ||||||
|---|---|---|---|---|---|---|---|
| Quadrant | DetID | PixID | Counts | Sigma | Mean | Median | Sigma |
| A | 0 | 253 | 17200 | 102.33 | 664 | 666 | 161.6 |
| A | 11 | 79 | 4145 | 21.53 | 664 | 666 | 161.6 |
| A | 3 | 111 | 2043 | 8.52 | 664 | 666 | 161.6 |
| B | 5 | 191 | 48851 | 283.56 | 706 | 702 | 169.8 |
| B | 15 | 22 | 28543 | 163.96 | 706 | 702 | 169.8 |
| B | 0 | 220 | 9312 | 50.71 | 706 | 702 | 169.8 |
| C | 15 | 241 | 107351 | 558.96 | 678 | 705 | 190.8 |
| C | 9 | 52 | 17950 | 90.39 | 678 | 705 | 190.8 |
| C | 3 | 79 | 10248 | 50.02 | 678 | 705 | 190.8 |
| D | 12 | 22 | 104245 | 516.16 | 646 | 668 | 200.7 |
| D | 2 | 107 | 32915 | 160.7 | 646 | 668 | 200.7 |
| D | 10 | 125 | 24477 | 118.65 | 646 | 668 | 200.7 |
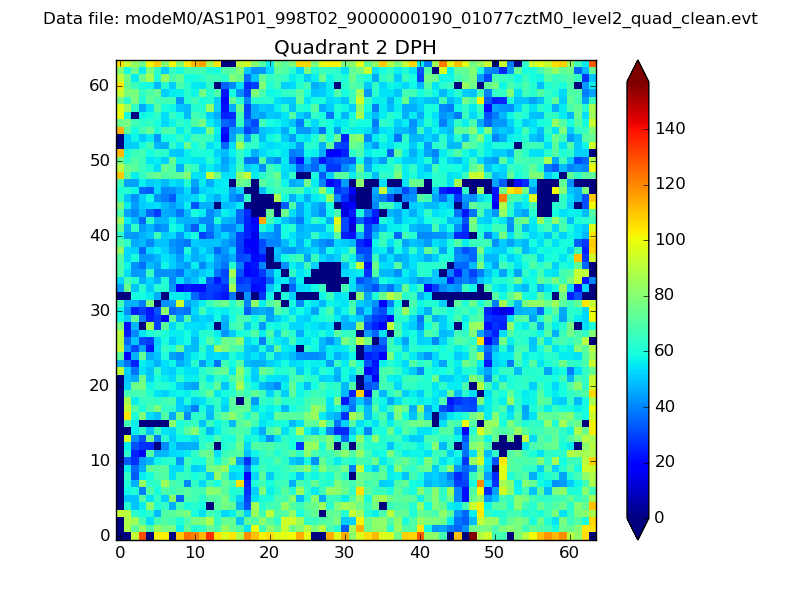
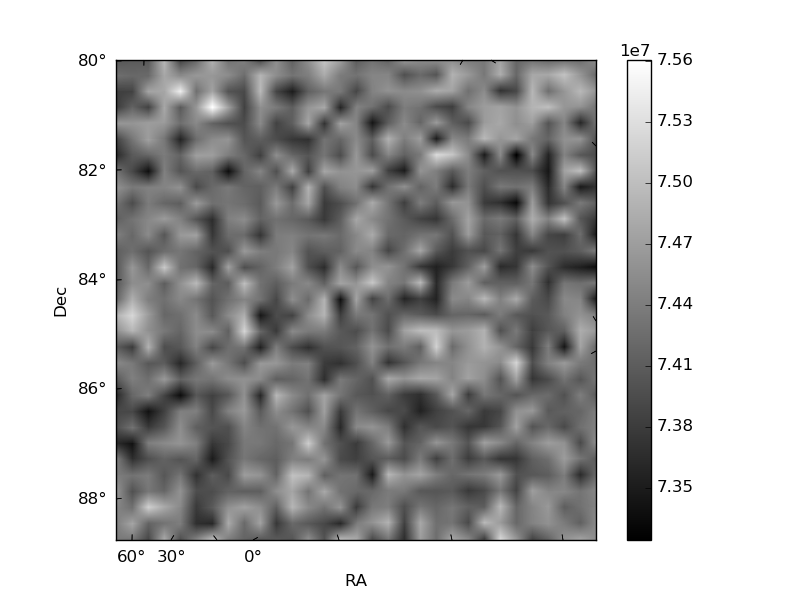
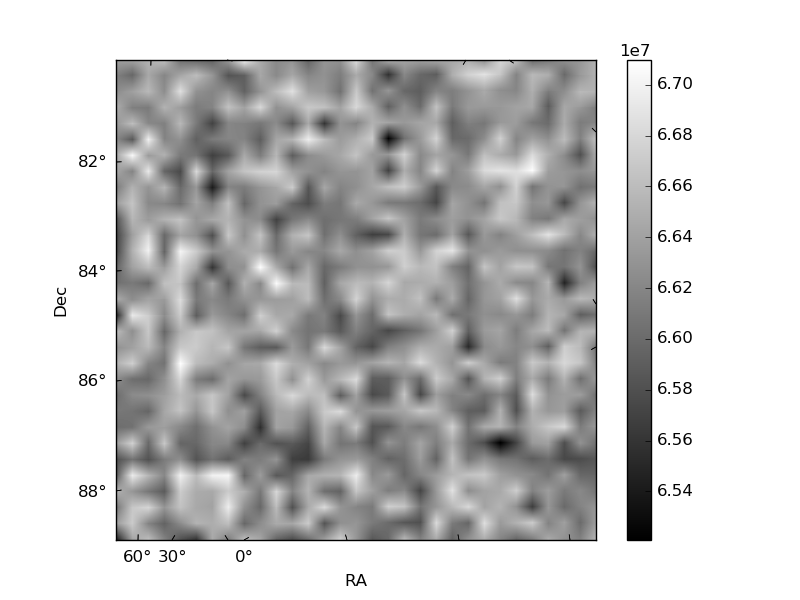
Histogram calculated using DETX and DETY for each event in the final _common_clean file
| Quadrant A | 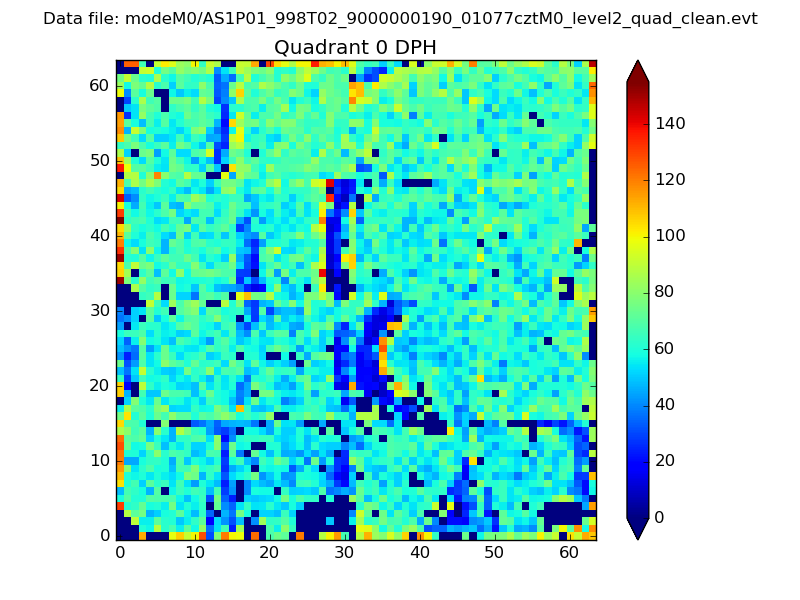 |
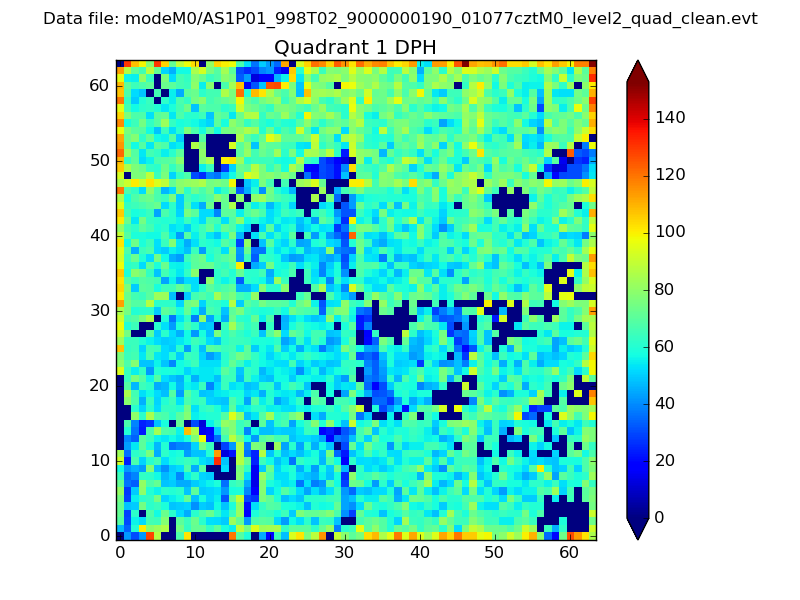 |
Quadrant B |
|---|---|---|---|
| Quadrant D | 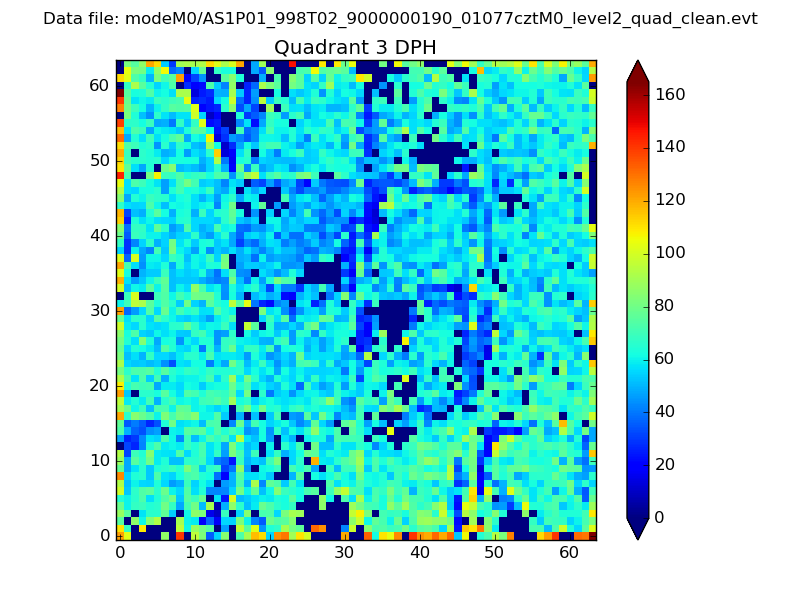 |
 |
Quadrant C |
| Plot type | Count rate plots | Images |
|---|---|---|
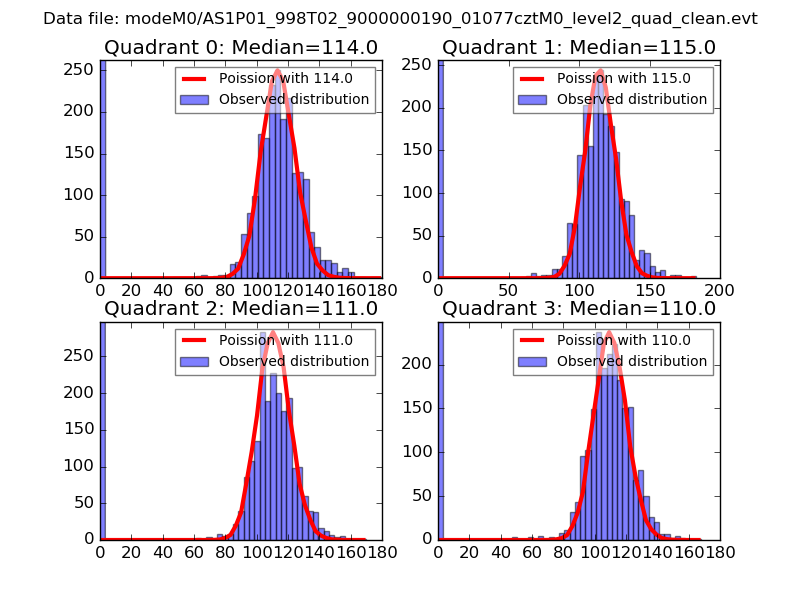
| Comparison with Poisson distribution Blue bars denote a histogram of data divided into 1 sec bins. Red curve is a Poisson curve with rate = median count rate of data. |
 |
 |
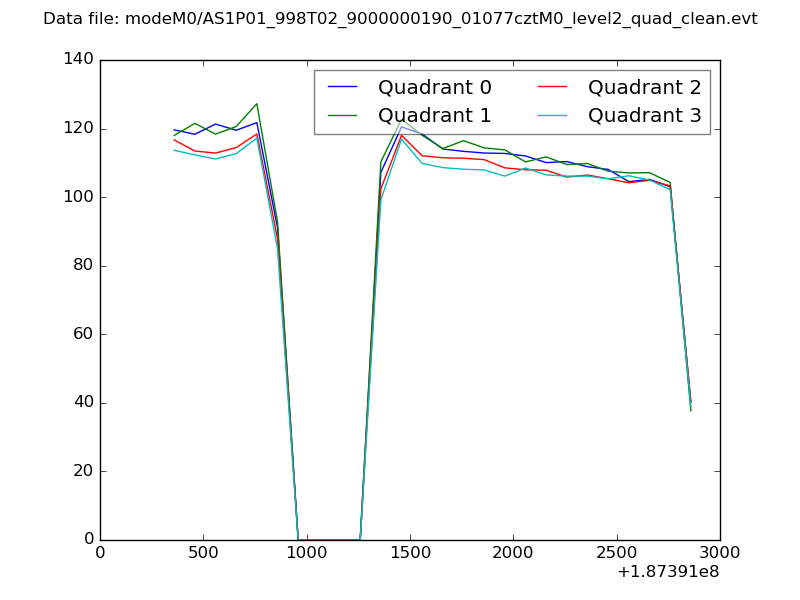
| Quadrant-wise count rates Data is divided into 100 sec bins |
 |
|
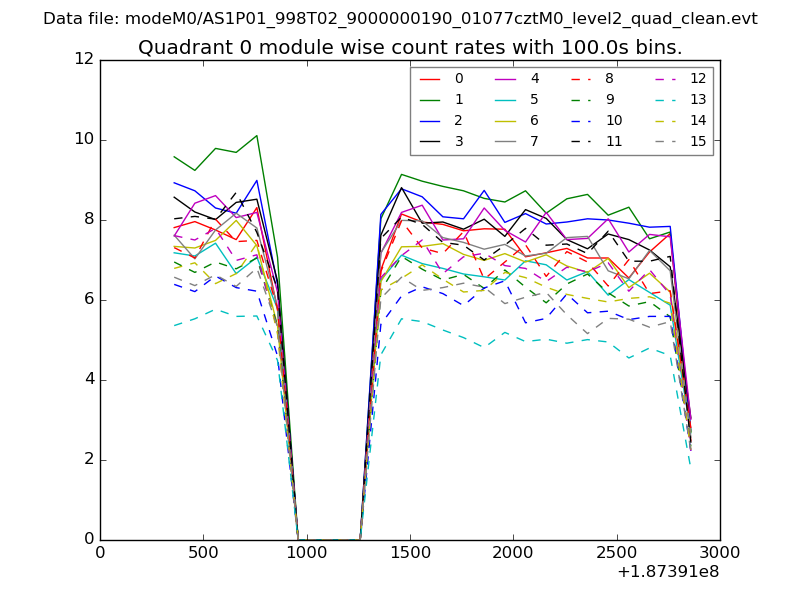
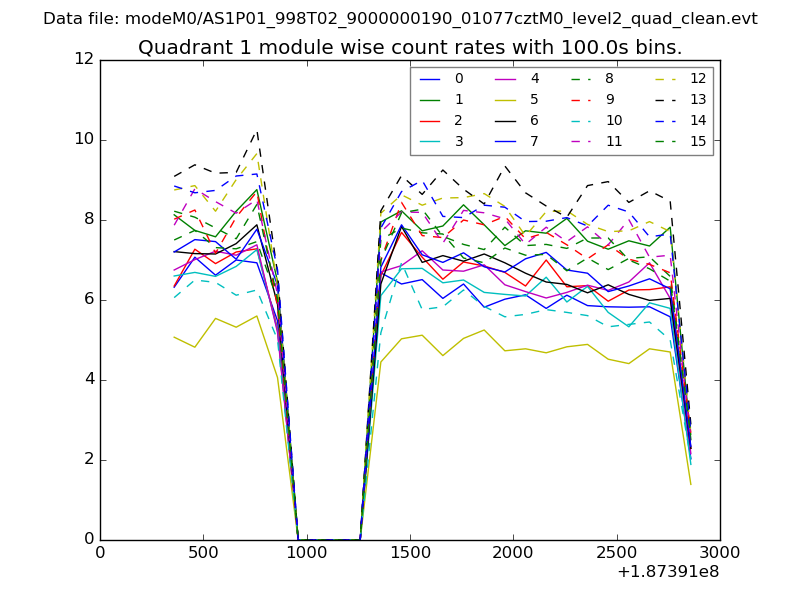
| Module-wise count rates for Quadrant A Data is divided into 100 sec bins |
 |
 |
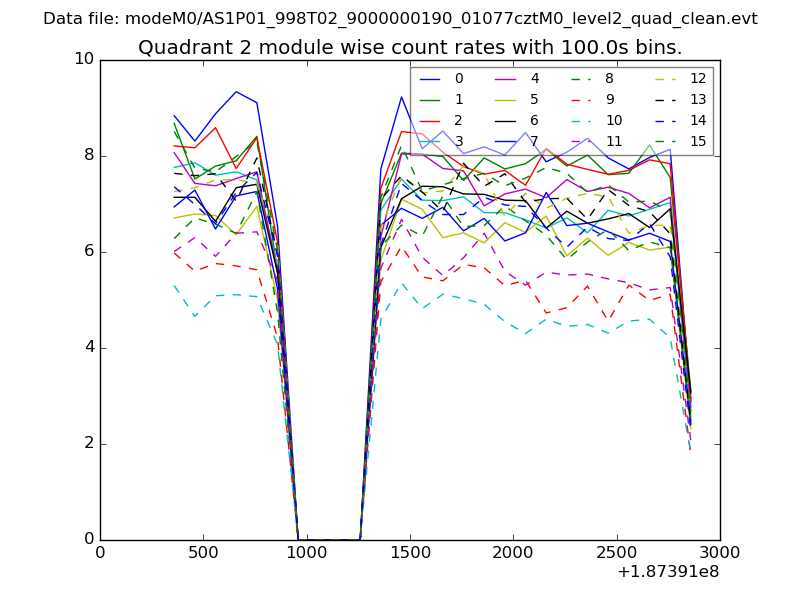
| Module-wise count rates for Quadrant B Data is divided into 100 sec bins |
 |
 |
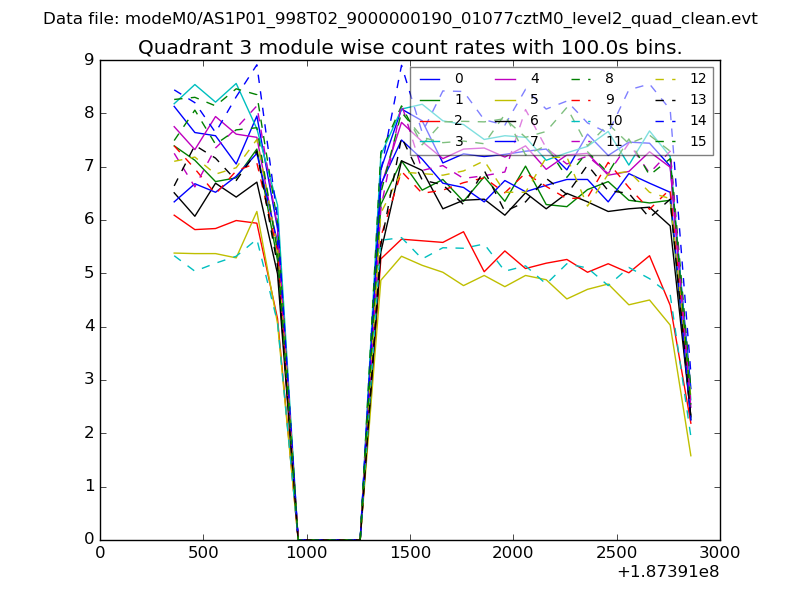
| Module-wise count rates for Quadrant C Data is divided into 100 sec bins |
 |
 |
| Module-wise count rates for Quadrant D Data is divided into 100 sec bins |
 |
 |
| Parameter | Plot |
|---|---|
| CZT HV Monitor | 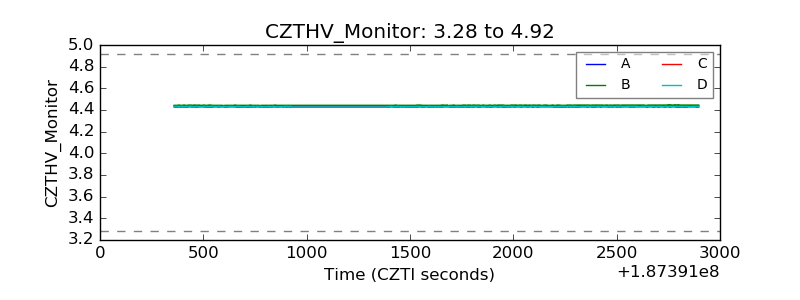 |
| D_VDD | 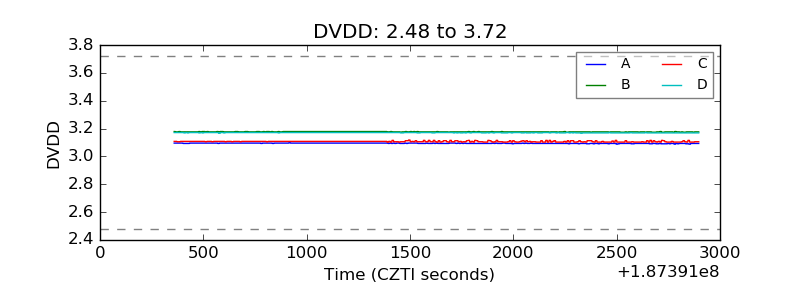 |
| Temperature 1 | 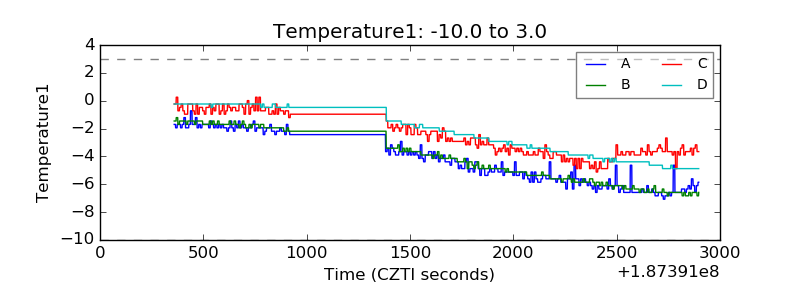 |
| Veto HV Monitor | 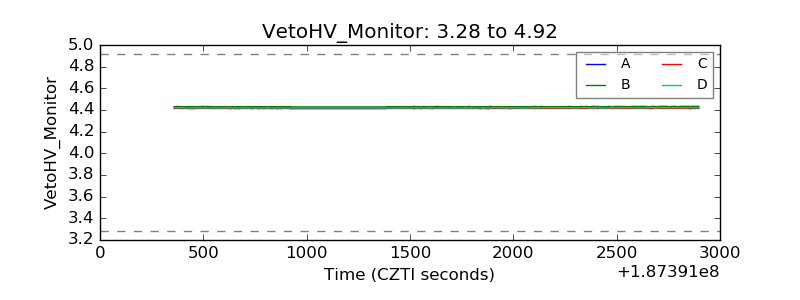 |
| Veto LLD | 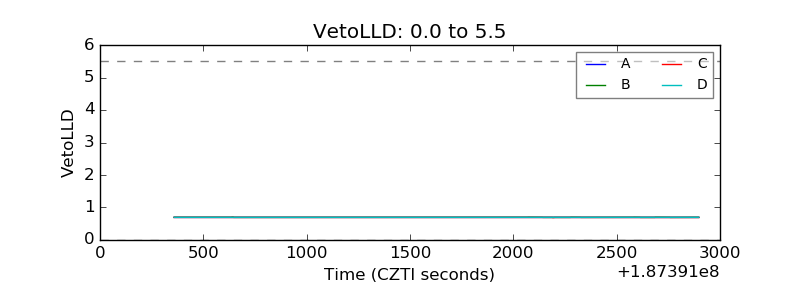 |
| Alpha Counter | 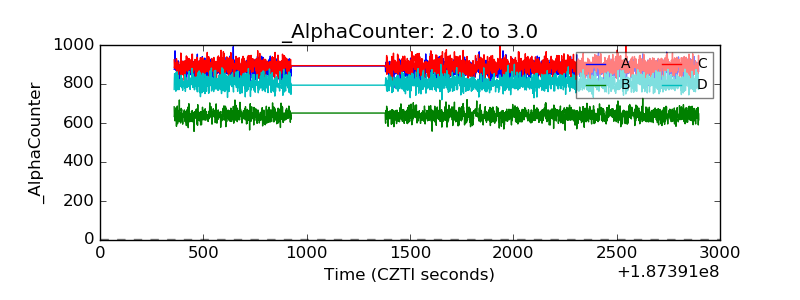 |
| _CPM_Rate | 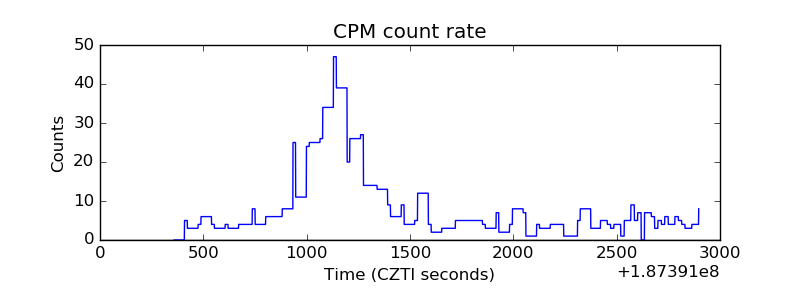 |
| CZT Counter | 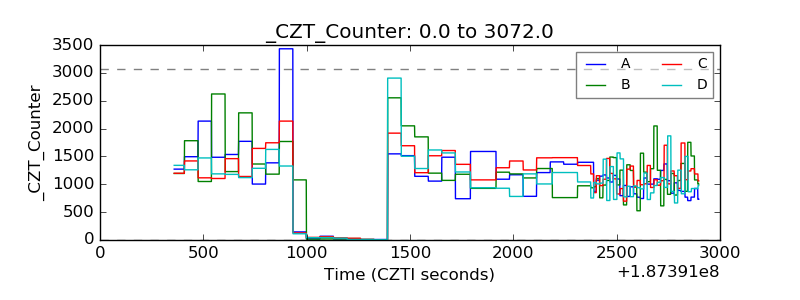 |
| +2.5 Volts monitor |  |
| +5 Volts monitor |  |
| _ROLL_ROT | 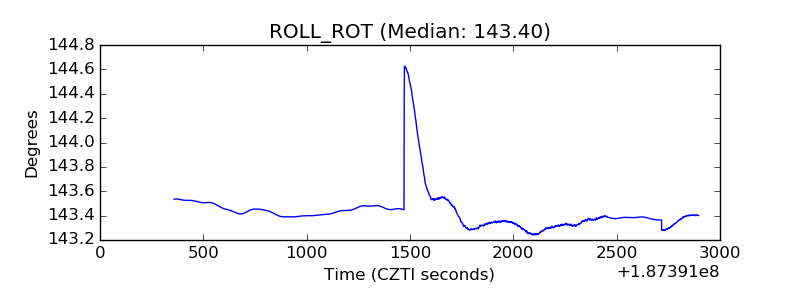 |
| _Roll_DEC | 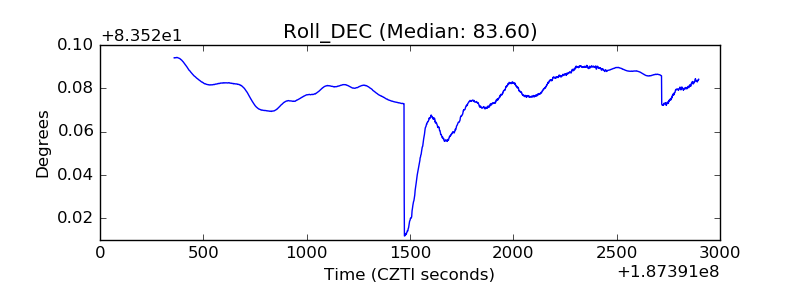 |
| _Roll_RA | 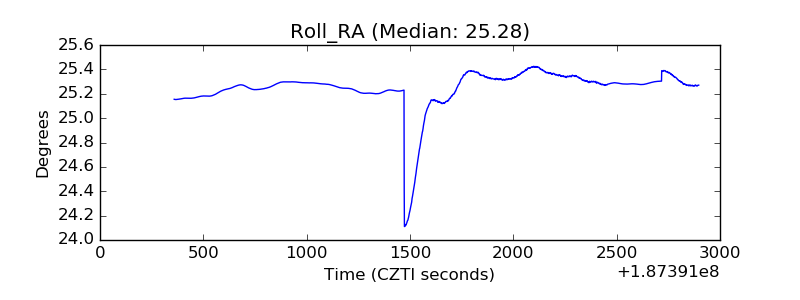 |
| Veto Counter | 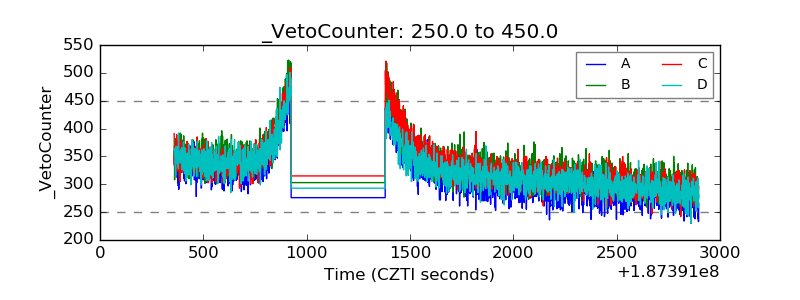 |