| Param | Original file | Final file |
|---|---|---|
| Filename | modeM0/AS1P01_998T02_9000000190_01078cztM0_level2.evt | modeM0/AS1P01_998T02_9000000190_01078cztM0_level2_quad_clean.evt |
| Size (bytes) | 1,104,082,560 | 116,383,680 |
| Size | 1.0 GB | 111.0 MB |
| Events in quadrant A | 8,020,055 | 771,737 |
| Events in quadrant B | 8,561,193 | 777,003 |
| Events in quadrant C | 8,304,774 | 760,572 |
| Events in quadrant D | 8,082,518 | 723,827 |
| Mode M0 | |||
|---|---|---|---|
| Quadrant | BADHDUFLAG | Total packets | Discarded packets |
| A | 0 | 57608 | 28805 |
| B | 0 | 60940 | 30473 |
| C | 0 | 59428 | 29715 |
| D | 0 | 58208 | 29112 |
| Mode SS | |||
|---|---|---|---|
| Quadrant | BADHDUFLAG | Total packets | Discarded packets |
| A | 0 | 288 | 144 |
| B | 0 | 288 | 144 |
| C | 0 | 288 | 144 |
| D | 0 | 288 | 144 |
| Mode M9 | |||
|---|---|---|---|
| Quadrant | BADHDUFLAG | Total packets | Discarded packets |
| A | 0 | 12 | 6 |
| B | 0 | 12 | 6 |
| C | 0 | 12 | 6 |
| D | 0 | 12 | 6 |
| Quadrant | Total seconds | Saturated seconds | Saturation percentage |
|---|---|---|---|
| A | 7060 | 1 | 0.014164% |
| B | 7060 | 28 | 0.396601% |
| C | 7060 | 2 | 0.028329% |
| D | 7059 | 266 | 3.768239% |
Noise dominated data is calculated using 1-second bins in cleaned event files. If a bin has >2000 counts, and if more than 50% of those come from <1% of pixels, then it is considered to be noise-dominated and hence unusable.
| Quadrant | # 1 sec bins | Bins with >0 counts | Bins with >2000 counts | High rate bins dominated by noise | Noise dominated (total time) | Noise dominated (detector-on time) | Marked lightcurve |
|---|---|---|---|---|---|---|---|
| A | 7680 | 7061 | 105 | 105 | 1.37% | 1.49% | 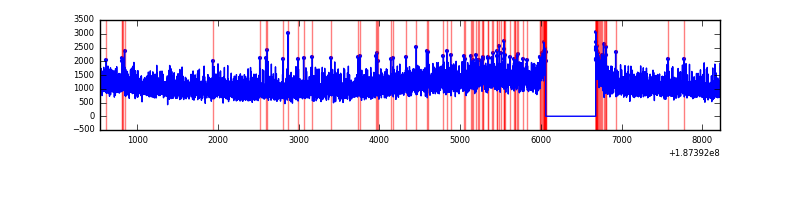 |
| B | 7680 | 7061 | 176 | 176 | 2.29% | 2.49% | 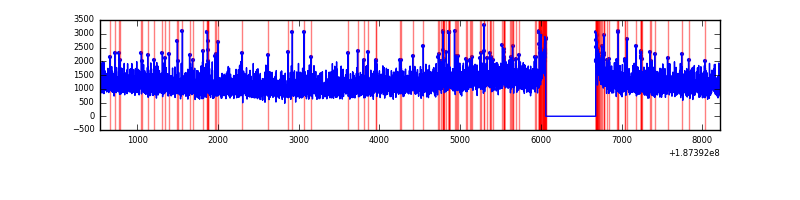 |
| C | 7680 | 7061 | 122 | 122 | 1.59% | 1.73% | 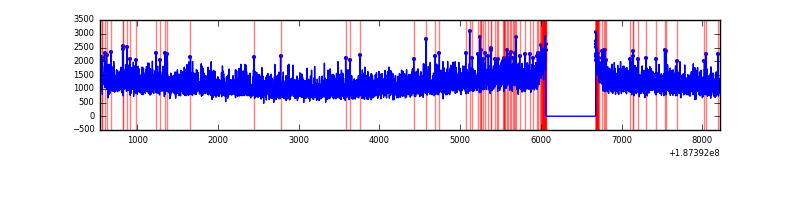 |
| D | 7680 | 7061 | 407 | 407 | 5.30% | 5.76% | 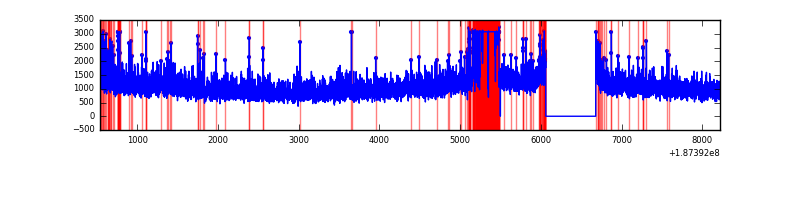 |
Top three noisy pixels from each quadrant. If the there are fewer than three noisy pixels in the level2.evt file, extra rows are filled as -1
| Pixel properties | Quadrant properties | ||||||
|---|---|---|---|---|---|---|---|
| Quadrant | DetID | PixID | Counts | Sigma | Mean | Median | Sigma |
| A | 0 | 253 | 19180 | 33.86 | 2082 | 2095 | 504.5 |
| A | 12 | 243 | 12261 | 20.15 | 2082 | 2095 | 504.5 |
| A | 11 | 79 | 9512 | 14.7 | 2082 | 2095 | 504.5 |
| B | 5 | 191 | 78126 | 146.83 | 2193 | 2201 | 517.1 |
| B | 15 | 22 | 76802 | 144.27 | 2193 | 2201 | 517.1 |
| B | 5 | 249 | 37278 | 67.83 | 2193 | 2201 | 517.1 |
| C | 15 | 241 | 358964 | 640.3 | 2009 | 2080 | 557.4 |
| C | 9 | 52 | 35075 | 59.2 | 2009 | 2080 | 557.4 |
| C | 3 | 111 | 32356 | 54.32 | 2009 | 2080 | 557.4 |
| D | 10 | 125 | 745064 | 1283.66 | 1863 | 1926 | 578.9 |
| D | 12 | 22 | 143630 | 244.77 | 1863 | 1926 | 578.9 |
| D | 2 | 216 | 138129 | 235.27 | 1863 | 1926 | 578.9 |
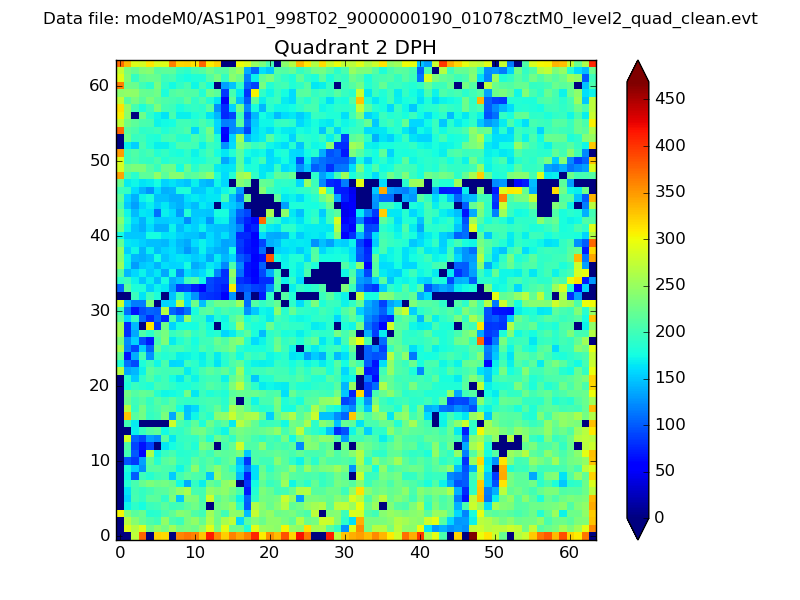
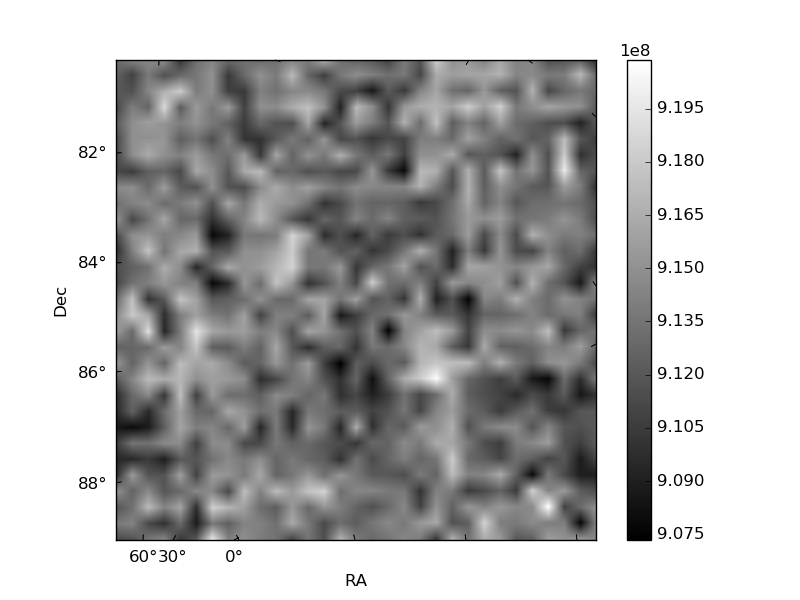
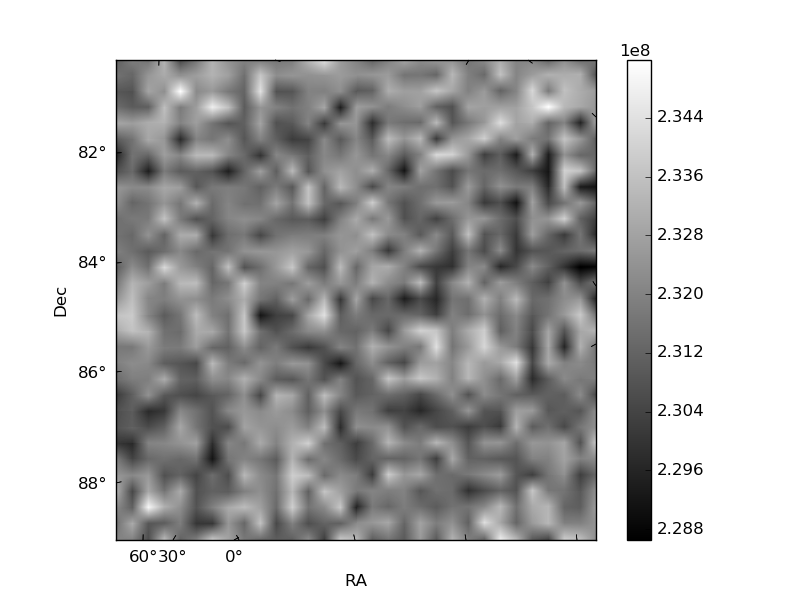
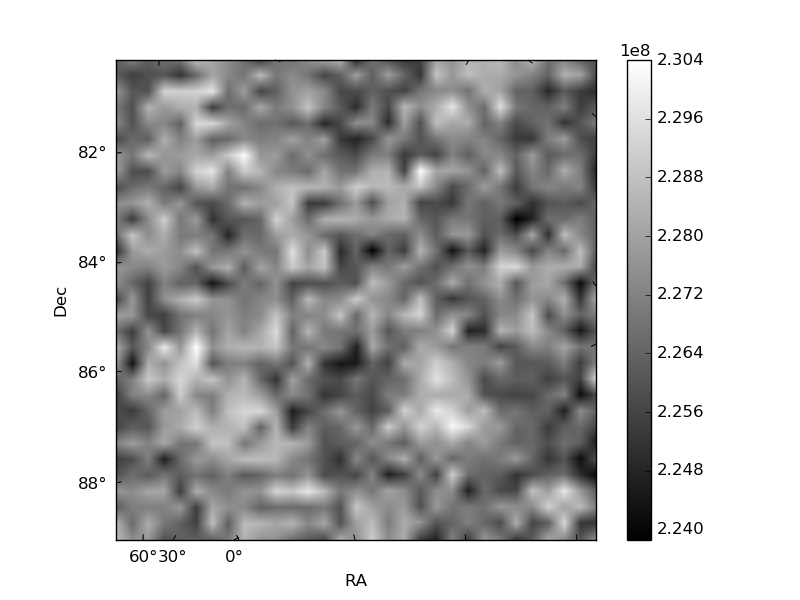
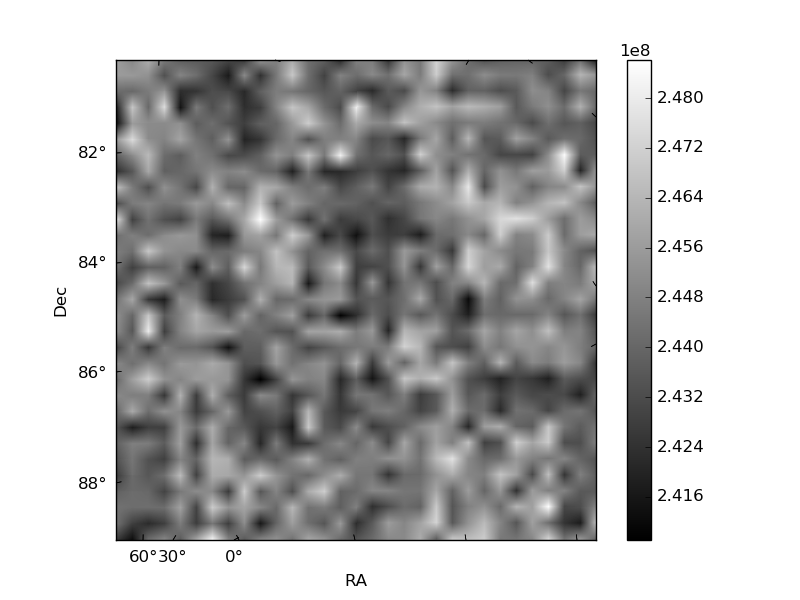
Histogram calculated using DETX and DETY for each event in the final _common_clean file
| Quadrant A | 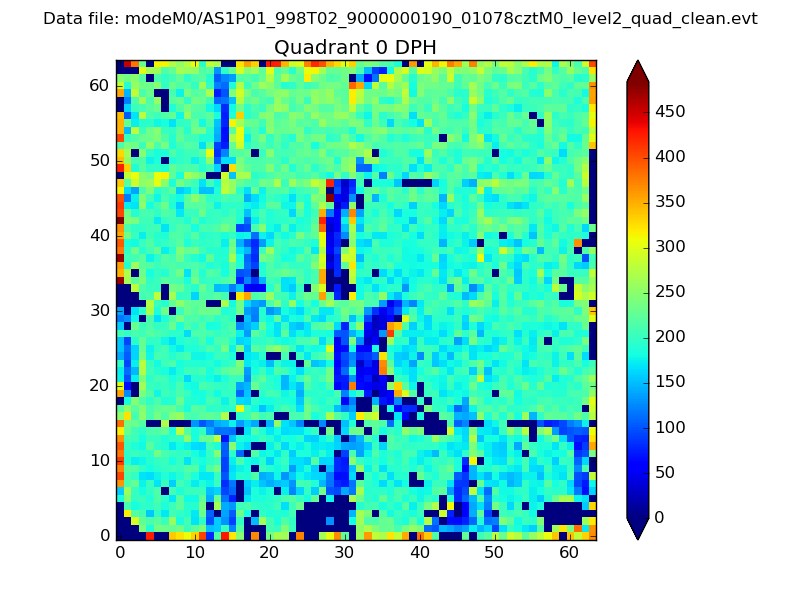 |
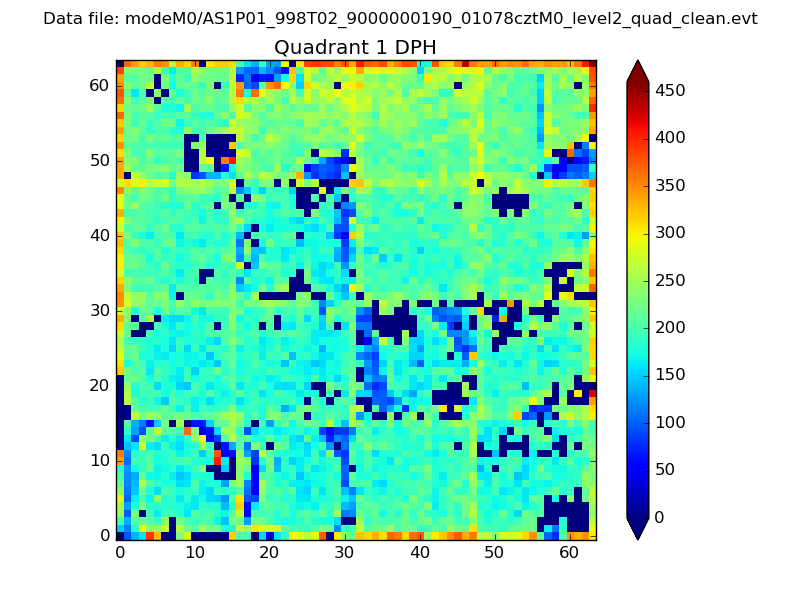 |
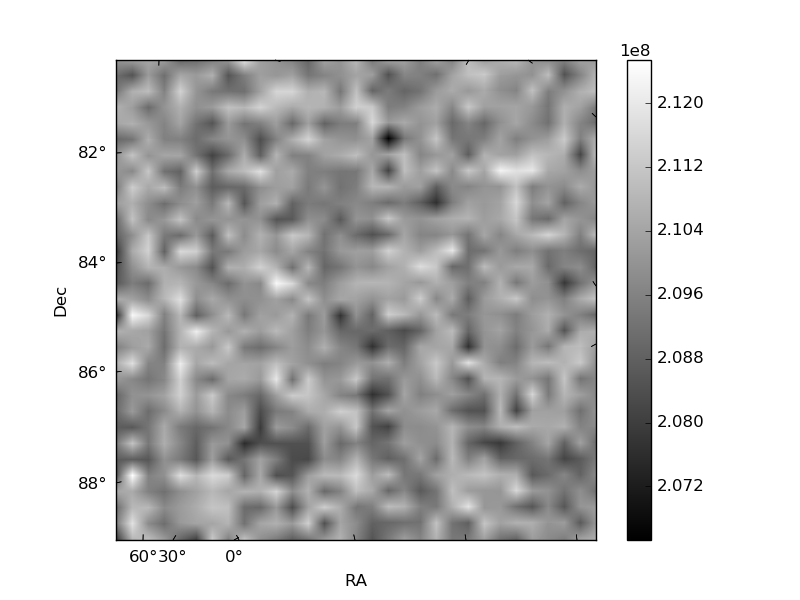
Quadrant B |
|---|---|---|---|
| Quadrant D | 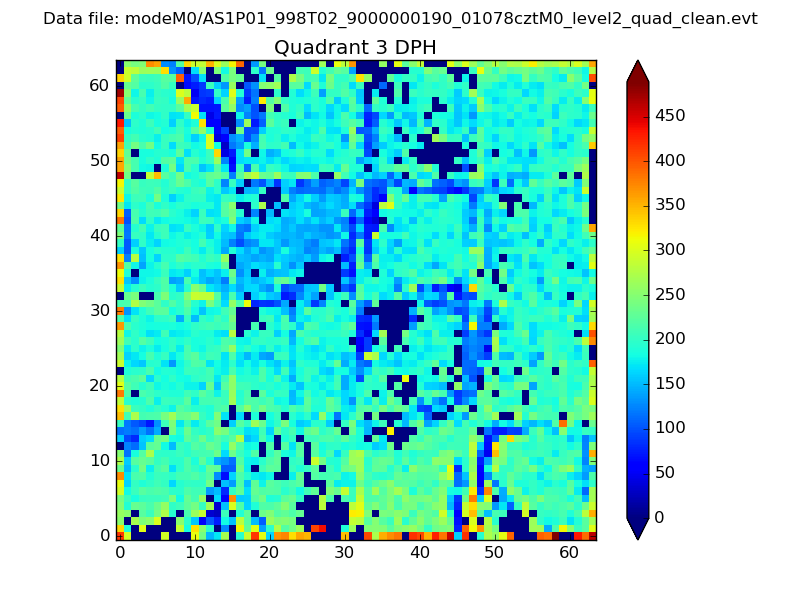 |
 |
Quadrant C |
| Plot type | Count rate plots | Images |
|---|---|---|
| Comparison with Poisson distribution Blue bars denote a histogram of data divided into 1 sec bins. Red curve is a Poisson curve with rate = median count rate of data. |
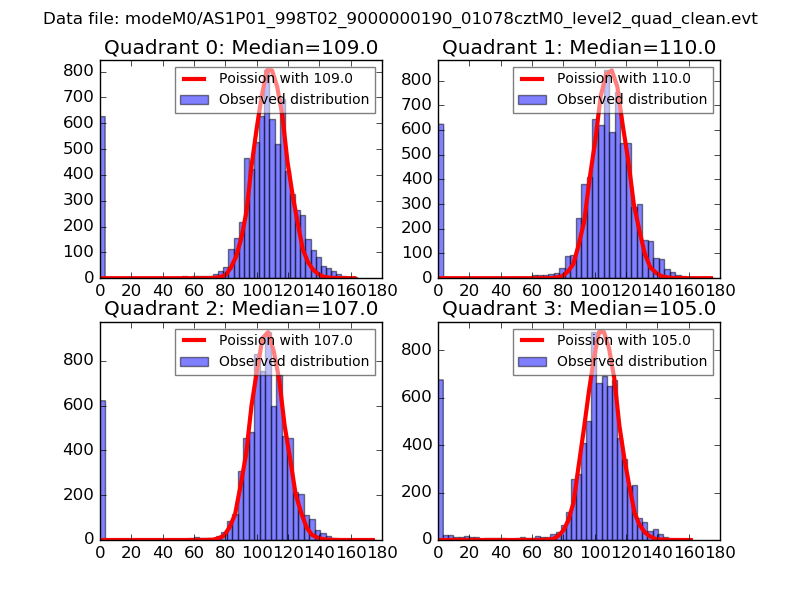 |
 |
| Quadrant-wise count rates Data is divided into 100 sec bins |
 |
|
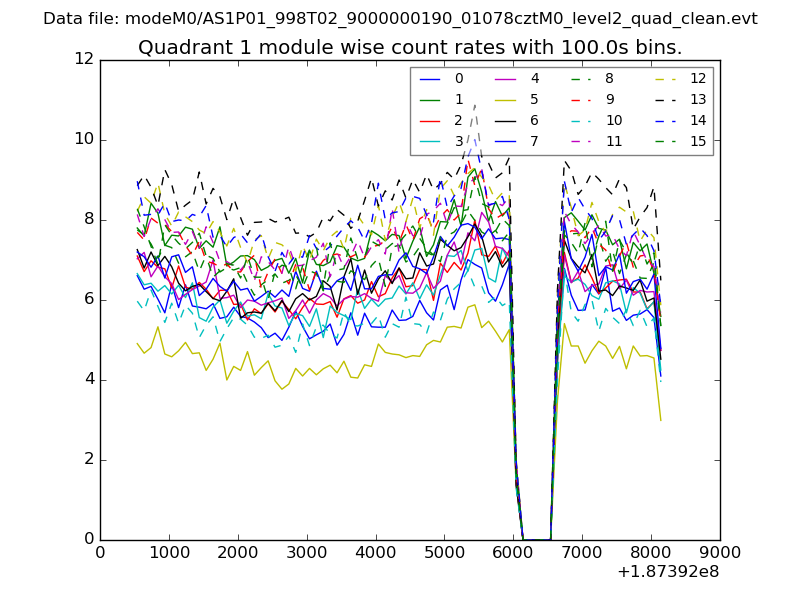
| Module-wise count rates for Quadrant A Data is divided into 100 sec bins |
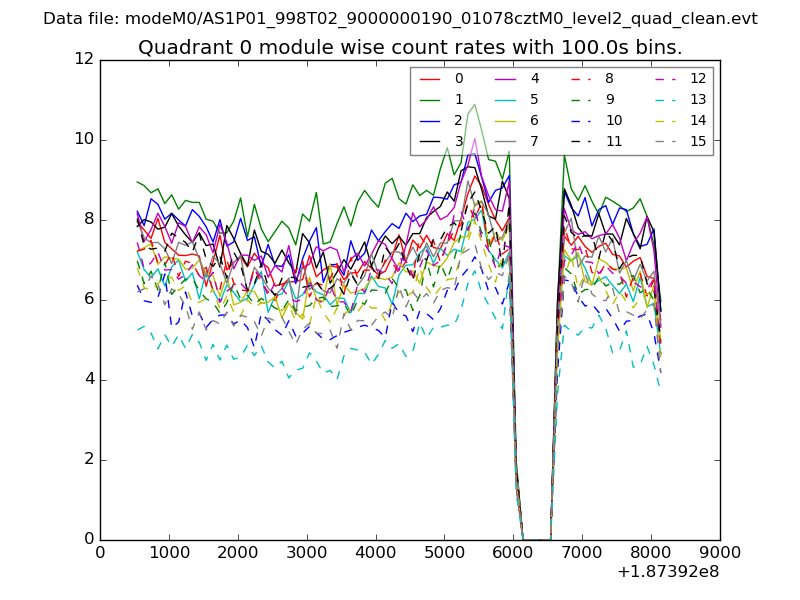 |
 |
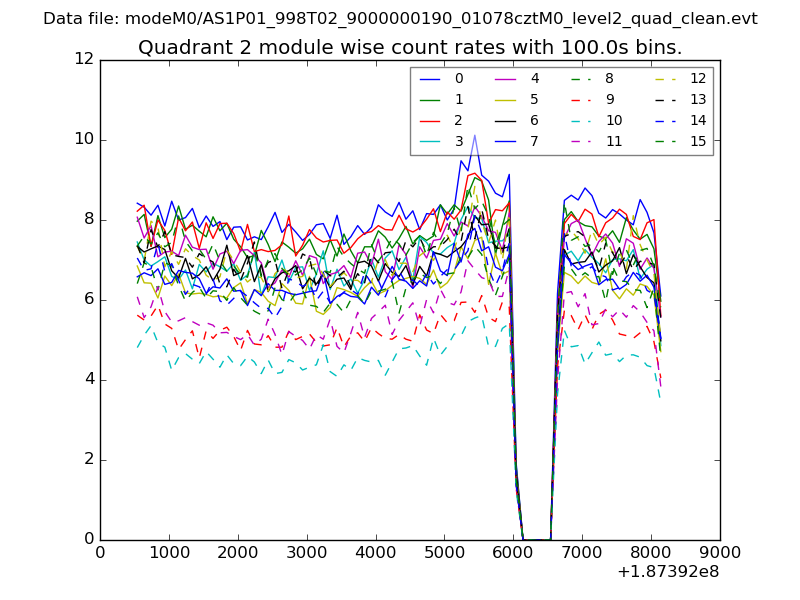
| Module-wise count rates for Quadrant B Data is divided into 100 sec bins |
 |
 |
| Module-wise count rates for Quadrant C Data is divided into 100 sec bins |
 |
 |
| Module-wise count rates for Quadrant D Data is divided into 100 sec bins |
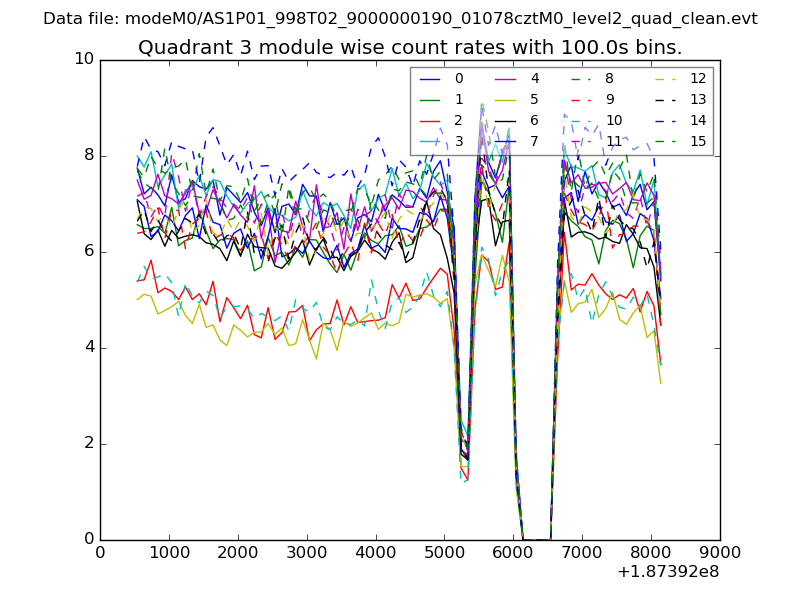 |
 |
| Parameter | Plot |
|---|---|
| CZT HV Monitor | 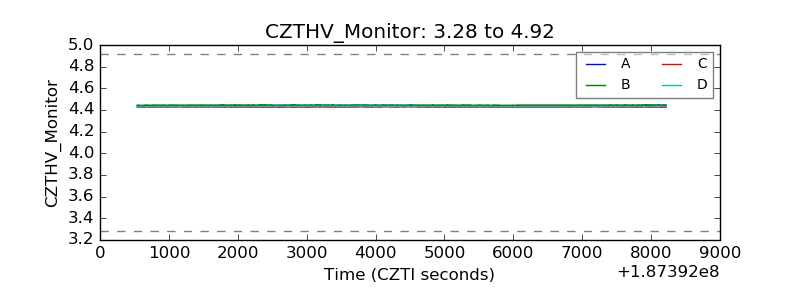 |
| D_VDD | 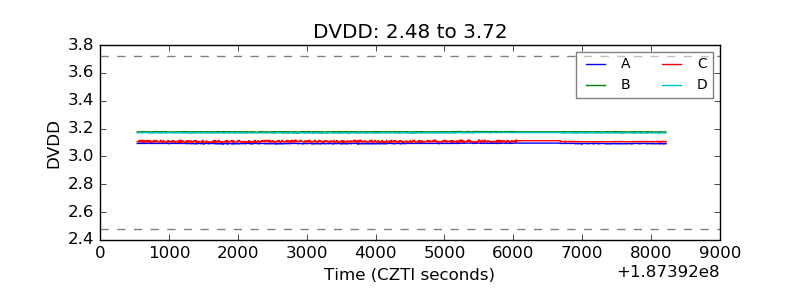 |
| Temperature 1 | 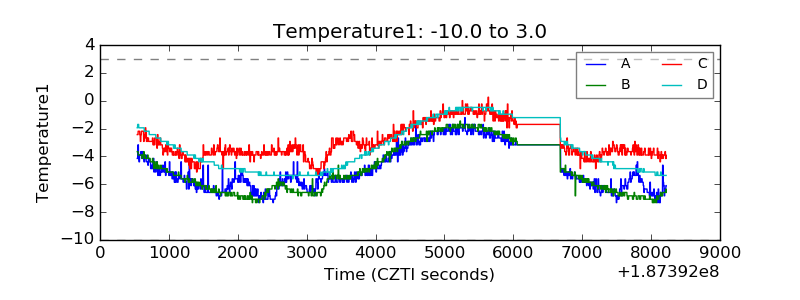 |
| Veto HV Monitor | 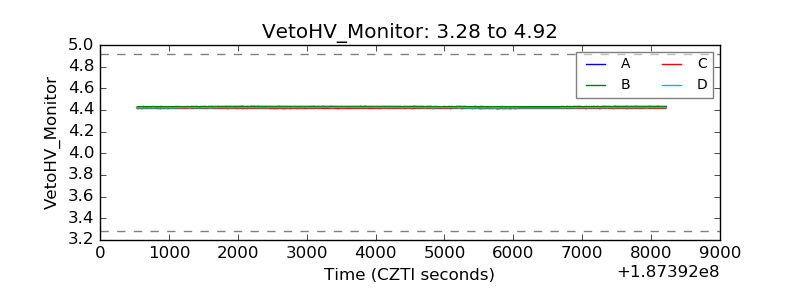 |
| Veto LLD | 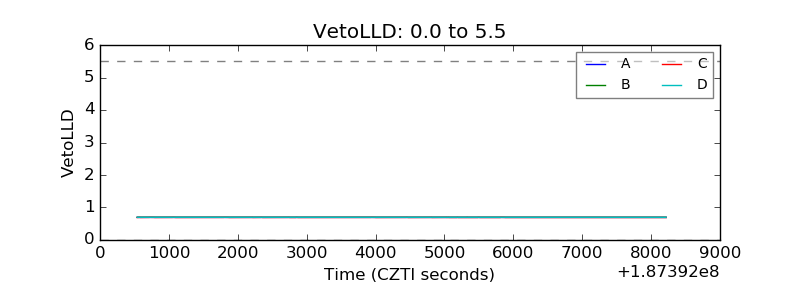 |
| Alpha Counter | 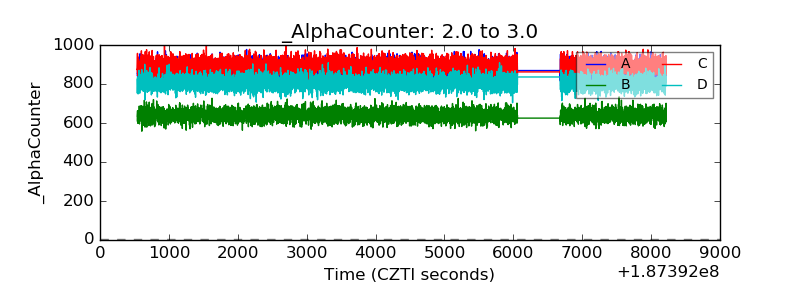 |
| _CPM_Rate | 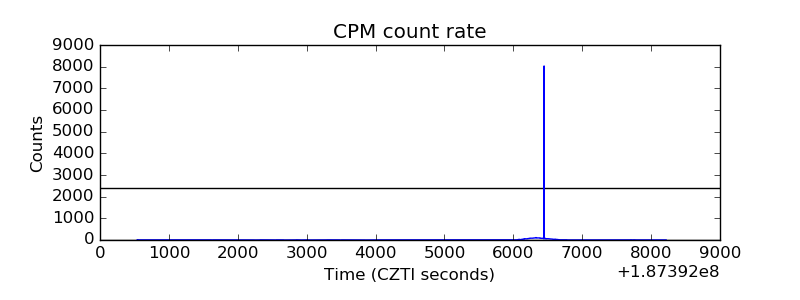 |
| CZT Counter | 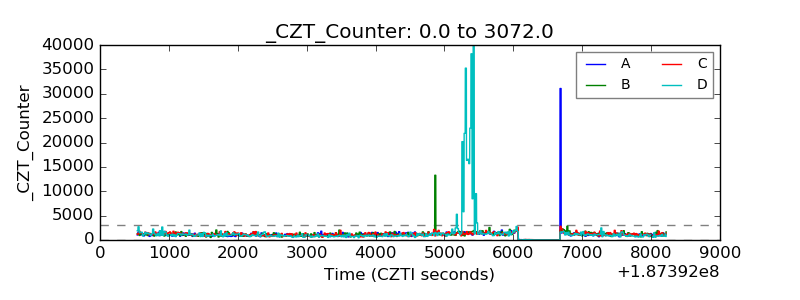 |
| +2.5 Volts monitor |  |
| +5 Volts monitor |  |
| _ROLL_ROT | 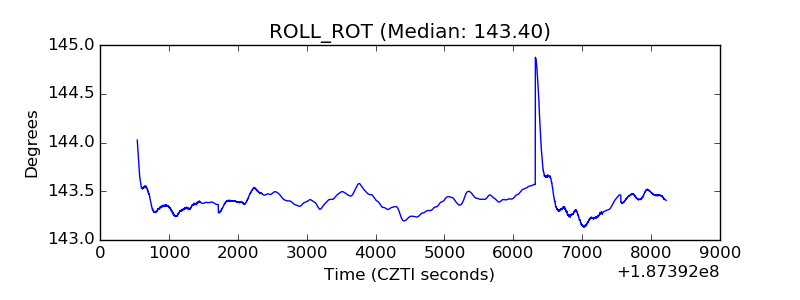 |
| _Roll_DEC | 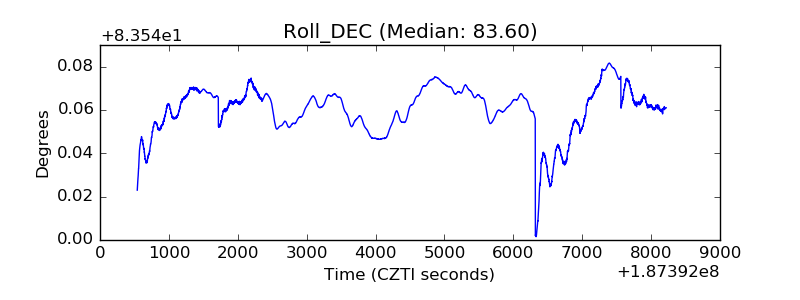 |
| _Roll_RA | 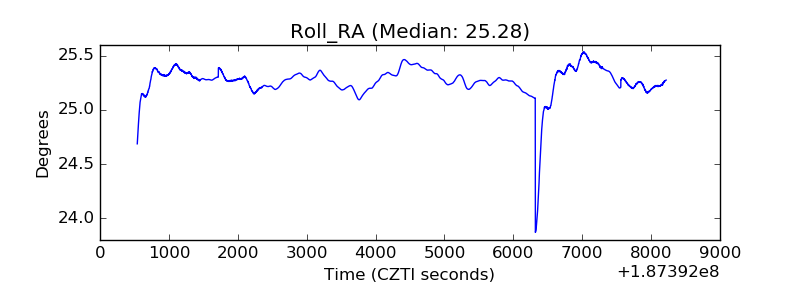 |
| Veto Counter | 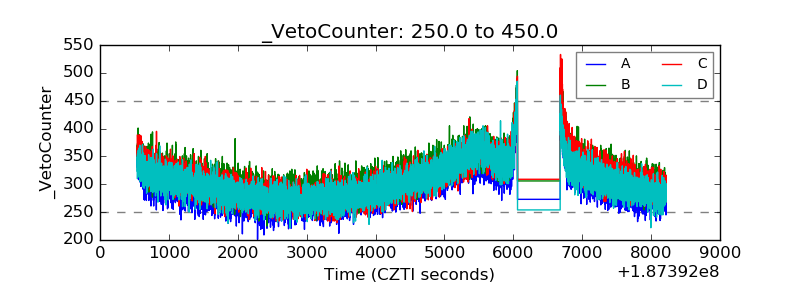 |