| Param | Original file | Final file |
|---|---|---|
| Filename | modeM0/AS1P01_998T02_9000000190_01080cztM0_level2.evt | modeM0/AS1P01_998T02_9000000190_01080cztM0_level2_quad_clean.evt |
| Size (bytes) | 587,692,800 | 66,245,760 |
| Size | 560.5 MB | 63.2 MB |
| Events in quadrant A | 4,471,539 | 430,186 |
| Events in quadrant B | 4,724,211 | 438,815 |
| Events in quadrant C | 4,436,061 | 428,132 |
| Events in quadrant D | 3,893,664 | 421,438 |
| Mode M0 | |||
|---|---|---|---|
| Quadrant | BADHDUFLAG | Total packets | Discarded packets |
| A | 0 | 16204 | 1 |
| B | 0 | 16938 | 1 |
| C | 0 | 16096 | 1 |
| D | 0 | 14516 | 1 |
| Mode SS | |||
|---|---|---|---|
| Quadrant | BADHDUFLAG | Total packets | Discarded packets |
| A | 0 | 82 | 0 |
| B | 0 | 82 | 0 |
| C | 0 | 82 | 0 |
| D | 0 | 82 | 0 |
| Mode M9 | |||
|---|---|---|---|
| Quadrant | BADHDUFLAG | Total packets | Discarded packets |
| A | 1 | 273359709408 | 0 |
| B | 1 | -1 | -1 |
| C | 1 | -1 | -1 |
| D | 1 | -1 | -1 |
| Quadrant | Total seconds | Saturated seconds | Saturation percentage |
|---|---|---|---|
| A | 4074 | 1 | 0.024546% |
| B | 4074 | 1 | 0.024546% |
| C | 4074 | 1 | 0.024546% |
| D | 4074 | 4 | 0.098184% |
Noise dominated data is calculated using 1-second bins in cleaned event files. If a bin has >2000 counts, and if more than 50% of those come from <1% of pixels, then it is considered to be noise-dominated and hence unusable.
| Quadrant | # 1 sec bins | Bins with >0 counts | Bins with >2000 counts | High rate bins dominated by noise | Noise dominated (total time) | Noise dominated (detector-on time) | Marked lightcurve |
|---|---|---|---|---|---|---|---|
| A | 4074 | 4074 | 44 | 44 | 1.08% | 1.08% | 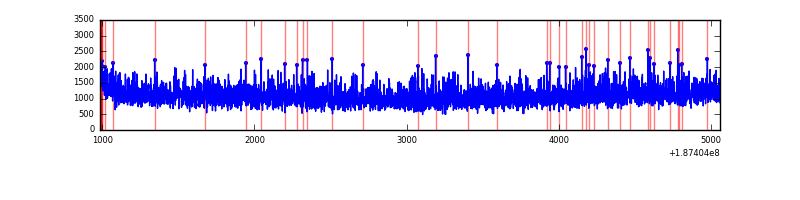 |
| B | 4074 | 4074 | 57 | 57 | 1.40% | 1.40% | 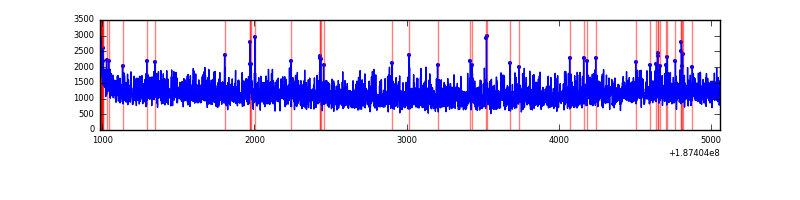 |
| C | 4074 | 4074 | 34 | 34 | 0.83% | 0.83% | 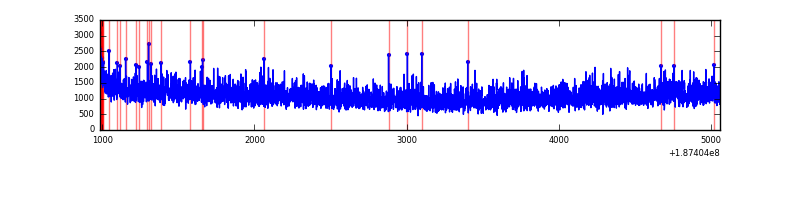 |
| D | 4074 | 4074 | 19 | 19 | 0.47% | 0.47% | 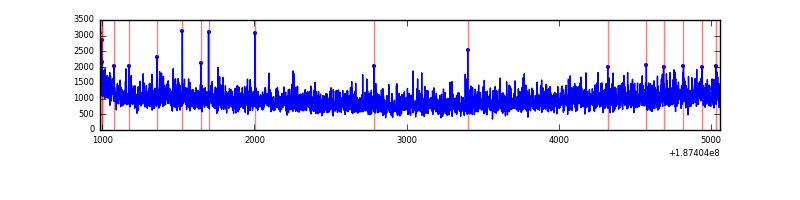 |
Top three noisy pixels from each quadrant. If the there are fewer than three noisy pixels in the level2.evt file, extra rows are filled as -1
| Pixel properties | Quadrant properties | ||||||
|---|---|---|---|---|---|---|---|
| Quadrant | DetID | PixID | Counts | Sigma | Mean | Median | Sigma |
| A | 12 | 243 | 6111 | 17.53 | 1163 | 1173 | 281.6 |
| A | 11 | 79 | 4574 | 12.08 | 1163 | 1173 | 281.6 |
| A | 3 | 111 | 3776 | 9.24 | 1163 | 1173 | 281.6 |
| B | 15 | 22 | 64439 | 220.13 | 1214 | 1224 | 287.2 |
| B | 5 | 191 | 19596 | 63.98 | 1214 | 1224 | 287.2 |
| B | 7 | 221 | 18147 | 58.93 | 1214 | 1224 | 287.2 |
| C | 15 | 241 | 192987 | 639.39 | 1075 | 1111 | 300.1 |
| C | 9 | 52 | 16376 | 50.87 | 1075 | 1111 | 300.1 |
| C | 3 | 111 | 14280 | 43.88 | 1075 | 1111 | 300.1 |
| D | 2 | 216 | 15335 | 44.84 | 1029 | 1063 | 318.3 |
| D | 12 | 22 | 9678 | 27.06 | 1029 | 1063 | 318.3 |
| D | 10 | 85 | 8855 | 24.48 | 1029 | 1063 | 318.3 |
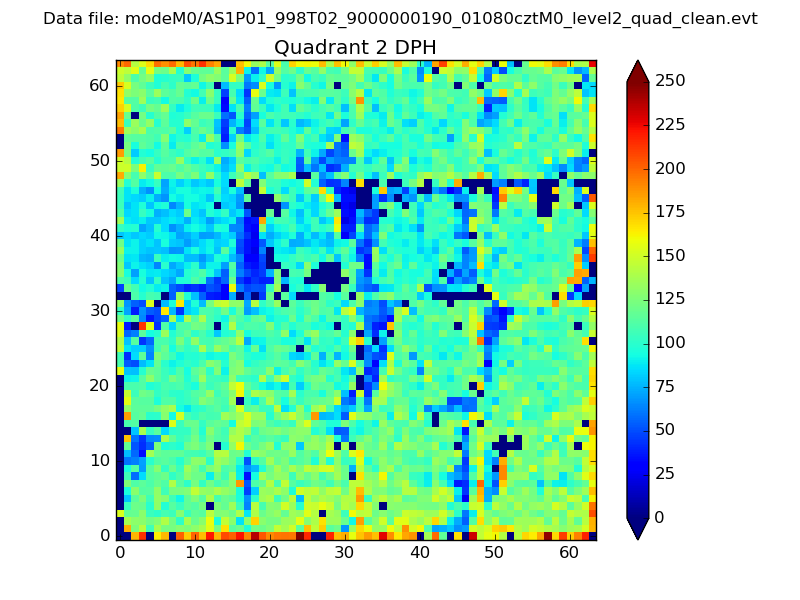
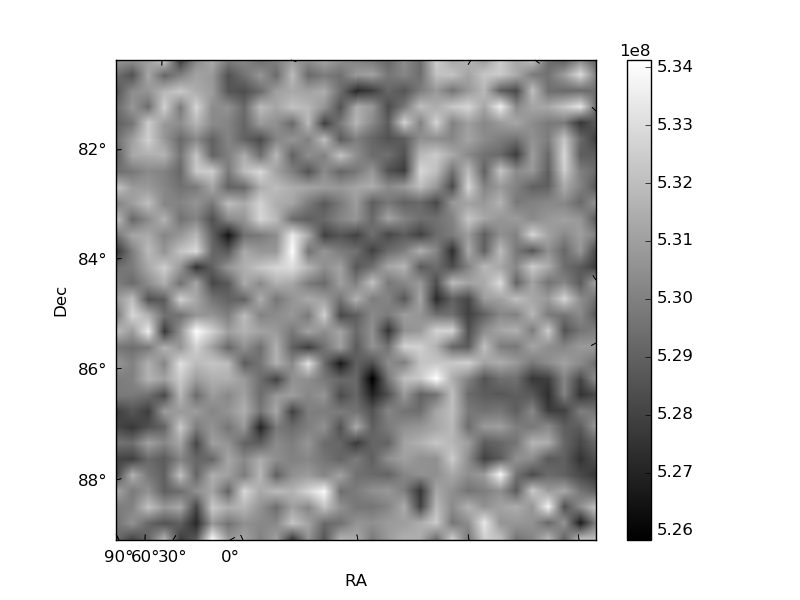
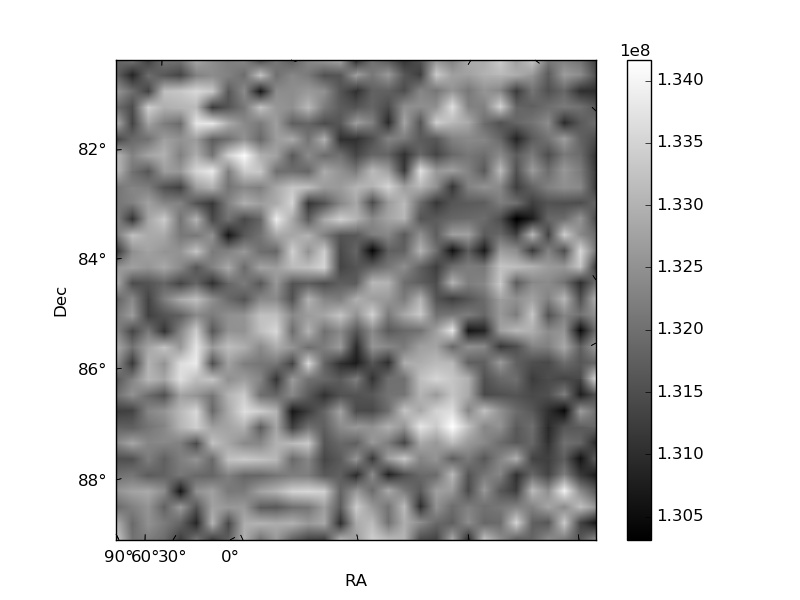
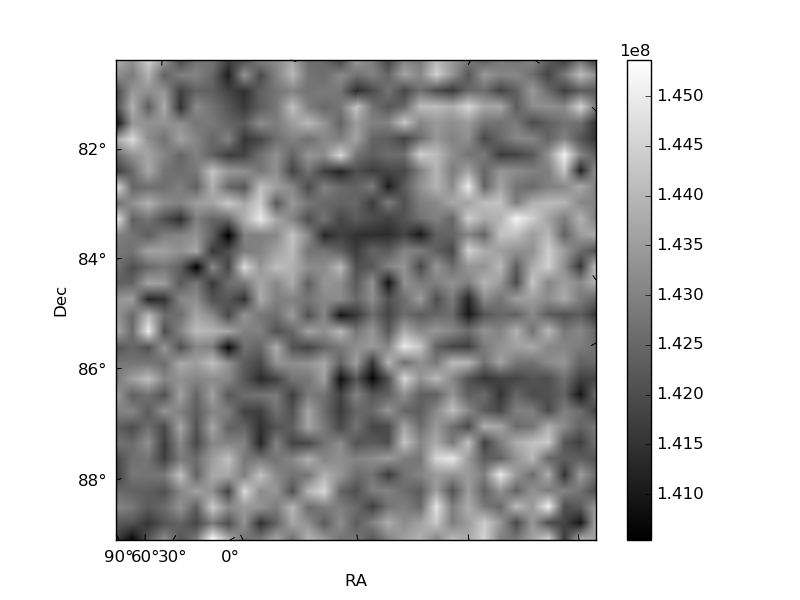
Histogram calculated using DETX and DETY for each event in the final _common_clean file
| Quadrant A | 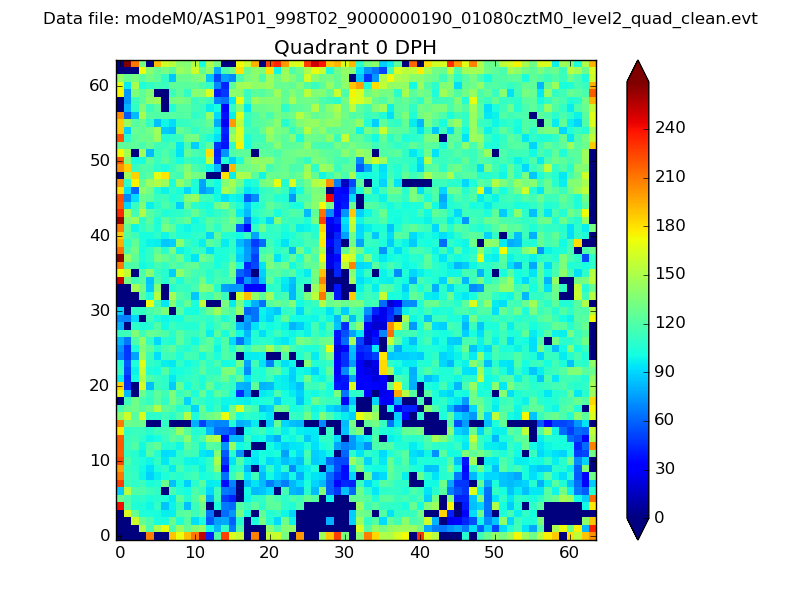 |
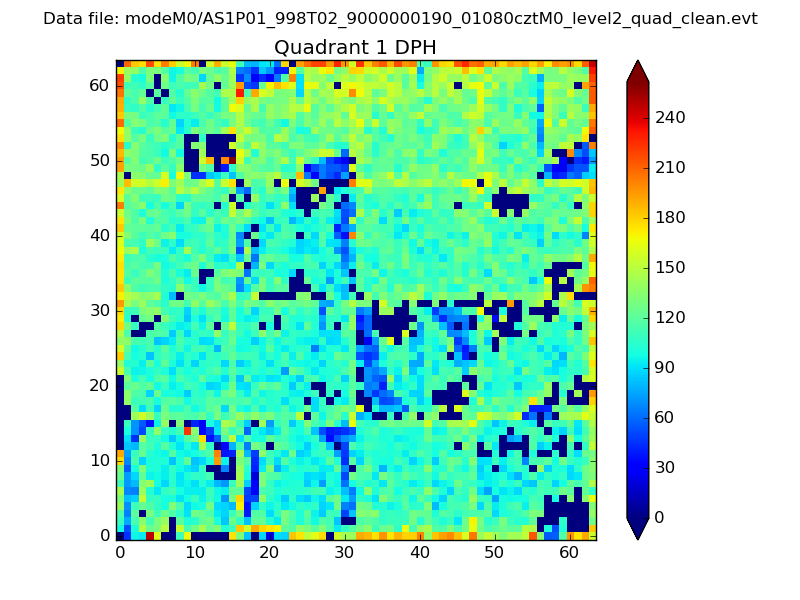 |
Quadrant B |
|---|---|---|---|
| Quadrant D | 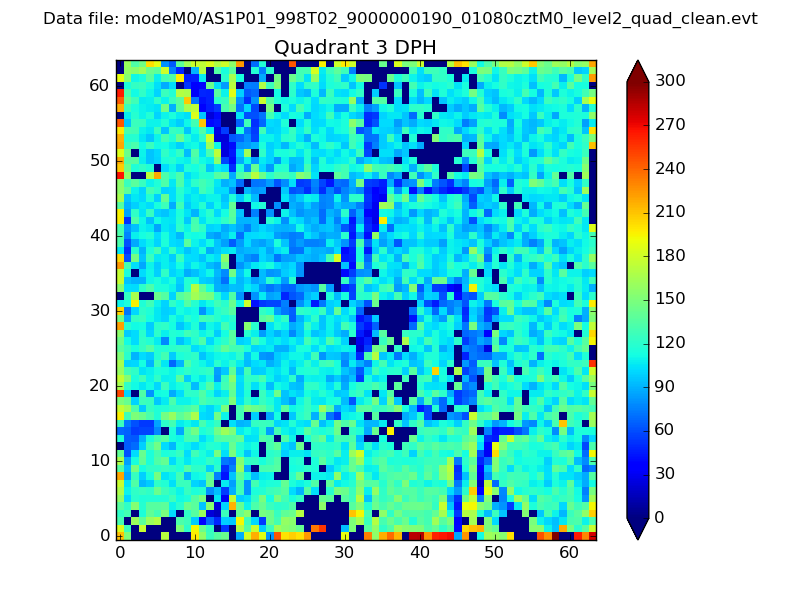 |
 |
Quadrant C |
| Plot type | Count rate plots | Images |
|---|---|---|
| Comparison with Poisson distribution Blue bars denote a histogram of data divided into 1 sec bins. Red curve is a Poisson curve with rate = median count rate of data. |
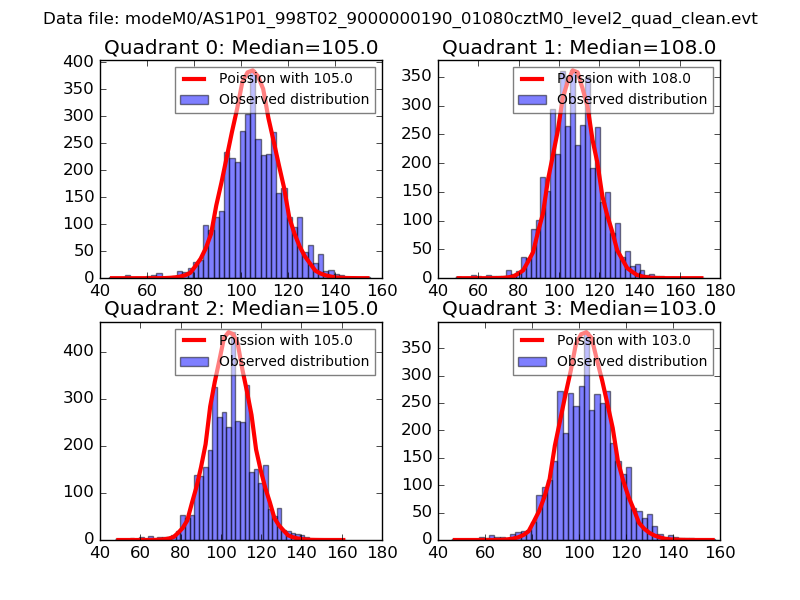 |
 |
| Quadrant-wise count rates Data is divided into 100 sec bins |
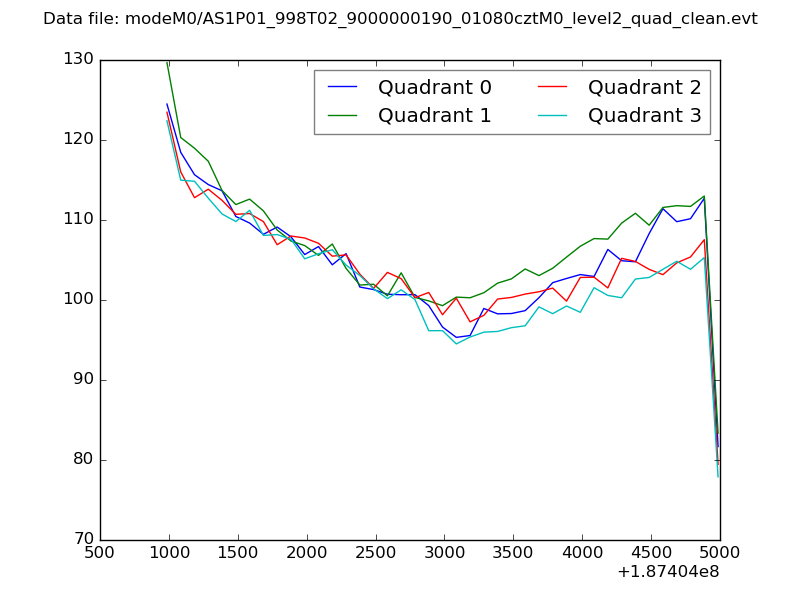 |
|
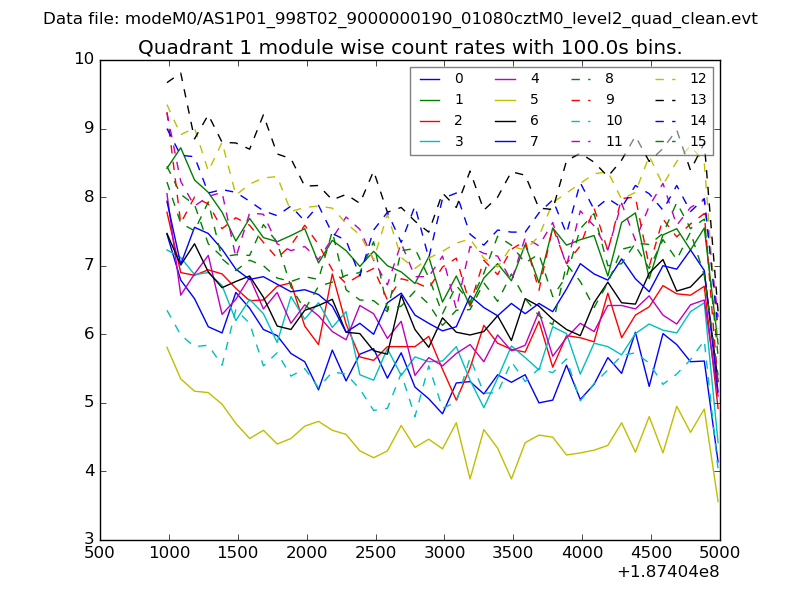
| Module-wise count rates for Quadrant A Data is divided into 100 sec bins |
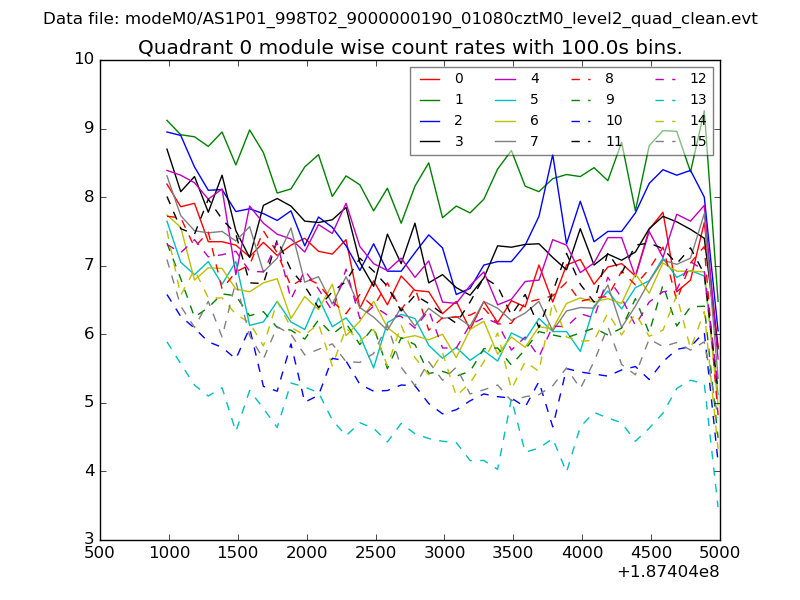 |
 |
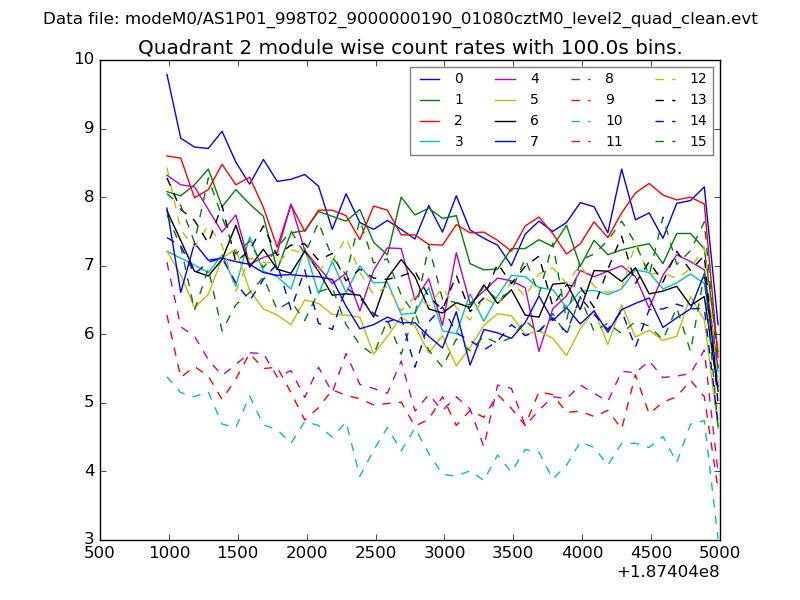
| Module-wise count rates for Quadrant B Data is divided into 100 sec bins |
 |
 |
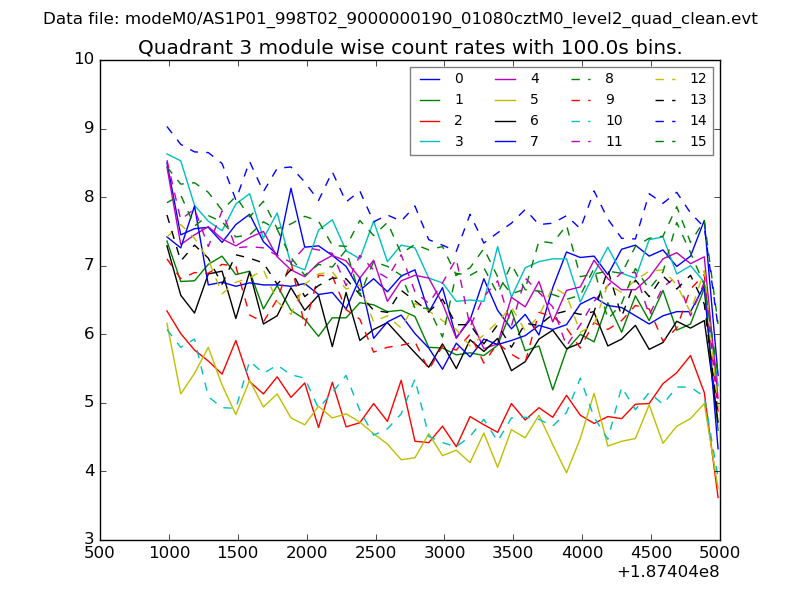
| Module-wise count rates for Quadrant C Data is divided into 100 sec bins |
 |
 |
| Module-wise count rates for Quadrant D Data is divided into 100 sec bins |
 |
 |
| Parameter | Plot |
|---|---|
| CZT HV Monitor | 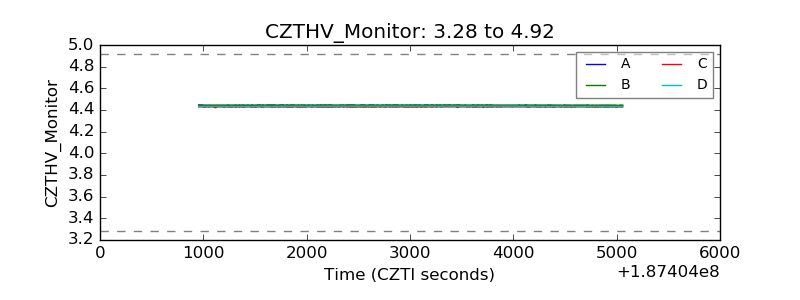 |
| D_VDD | 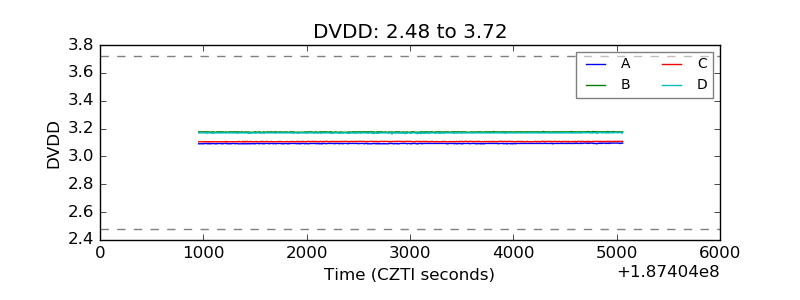 |
| Temperature 1 | 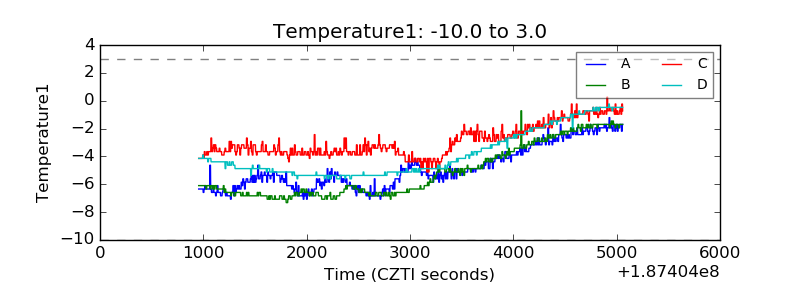 |
| Veto HV Monitor |  |
| Veto LLD | 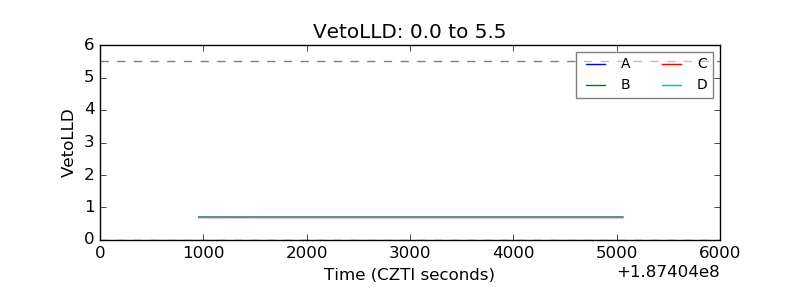 |
| Alpha Counter | 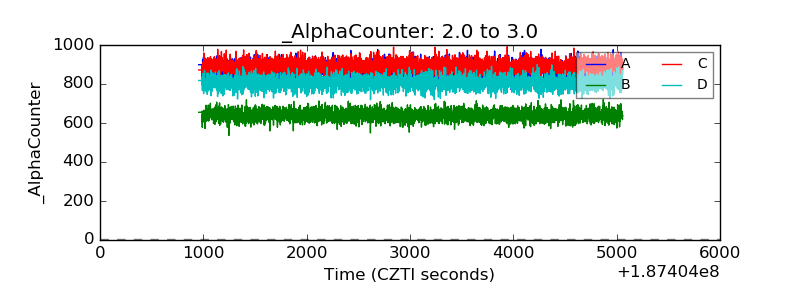 |
| _CPM_Rate | 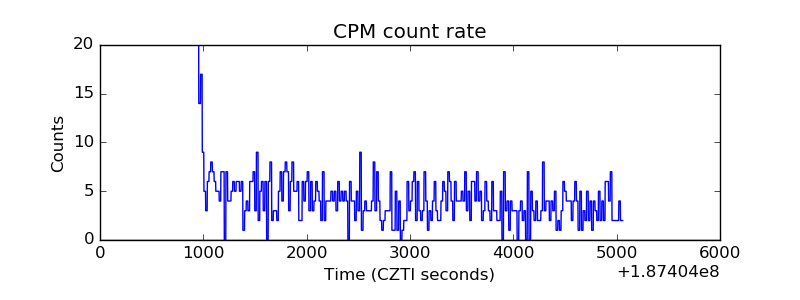 |
| CZT Counter | 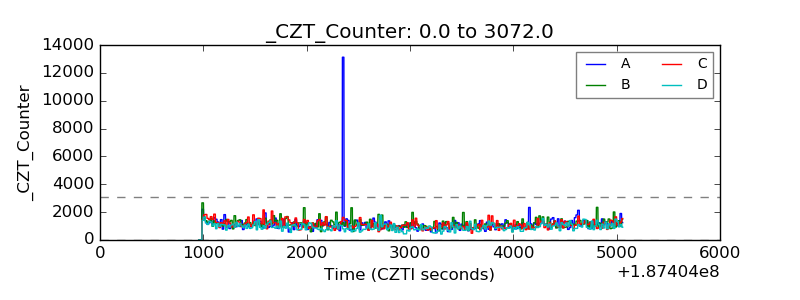 |
| +2.5 Volts monitor |  |
| +5 Volts monitor |  |
| _ROLL_ROT | 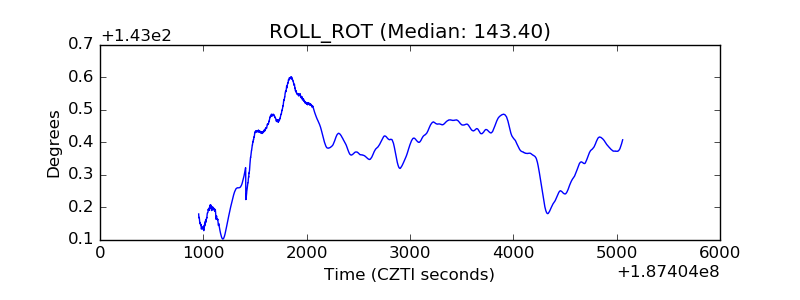 |
| _Roll_DEC | 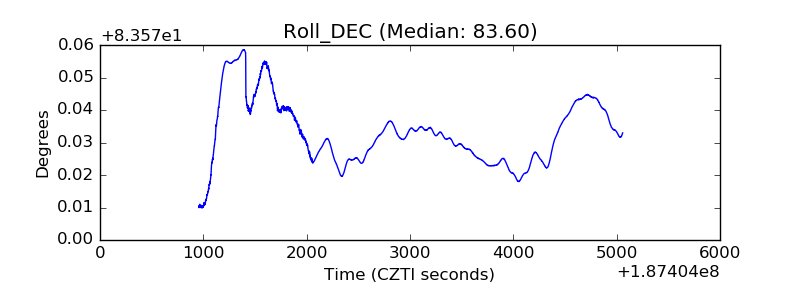 |
| _Roll_RA | 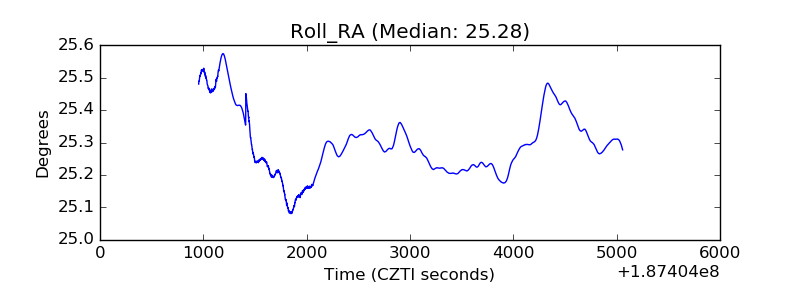 |
| Veto Counter | 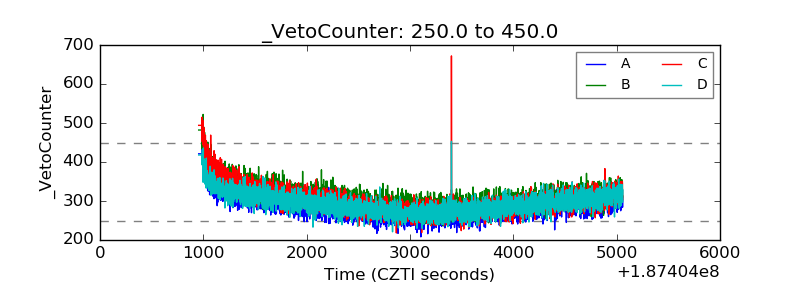 |